

Spencer Platt
Introduction
A correction, market crash, bear market, recession, or however you want to call a severe downtrend in the stock market can create great, sometimes once-in-a-lifetime, opportunities to buy stocks. In my opinion, the best stock opportunities are not some young, small, growth companies like Opendoor Technologies (OPEN), Pinterest (PINS), or DraftKings (DKNG), which are also cheaper than ever due to massive losses in value. I don’t want to say that such stocks can’t be “buys” right now, but such companies can be found almost every time. The much more interesting and unique opportunities lie in stocks like Microsoft (MSFT), Alphabet (GOOG)(GOOGL), Nike (NKE), or BlackRock, Inc. (NYSE:BLK). These blue-chip stocks have been around for a long time and have been very expensive in the last few years. Their expensiveness was justified due to their leadership in their respective markets, superior growth, profitability, balance sheets, and shareholder returns. The happier we should be that we finally get to buy these stocks at lower valuations.
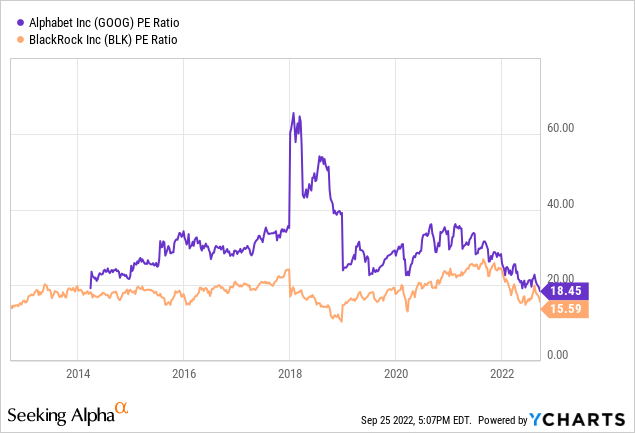
Alphabet, for example, trades at a P/E of 18.5 for the first time in its history. BlackRock is currently trading at a P/E of 15.6, giving you a chance only seen in three of the last ten years. Not as cheap as an Alphabet, but still cheaper than 70% of the time over the past ten years.
But even though these opportunities are rare and shouldn’t be missed, we should not buy at any price. Just because BlackRock is cheap right now, it doesn’t mean the share price can’t drop even more. In this article, I want to assess if there is any more downside potential due to this rough market, giving you a better buy opportunity soon. Since the stock market’s and the economy’s health are the two critical factors for BlackRock’s earnings, I will analyze them in more detail. If you’re already well informed about the current market, you can skip a bit until the headline “Case scenarios for the S&P 500.” I will work with these scenarios later in the article.
Today’s market
Since the beginning of the year, the market has been rough due to inflation, rising rates, supply chain issues, and the war in Ukraine. This shouldn’t be new to most readers, so I won’t go on about this anymore.
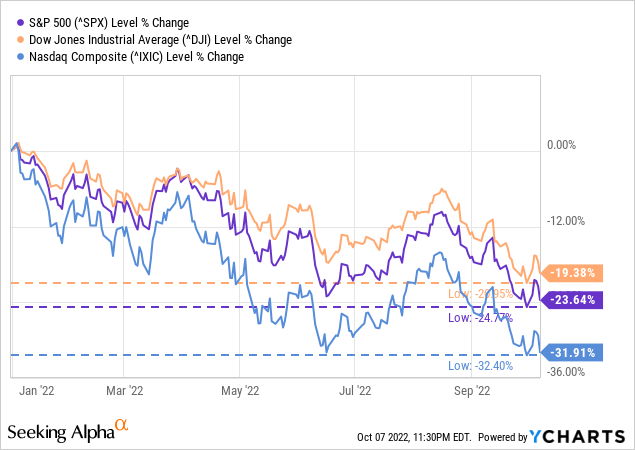
Since the June lows, the broad market rallied, with the Dow (DIA) rising 14+%, the S&P 500 (SPY) rising 17+%, and the Nasdaq (QQQ) rising 23+% to their peaks in mid-August. The big question during the rally was if this is the end of the bear market and will we see new highs again or if this is a bear market rally pointing to more downside. Since mid-August, the indices have retreated again, giving up on their newly achieved gains. Right now, we are sitting slightly below the June lows, with the exception of the Nasdaq. Now we have to assess if the market is testing the lows to form a bottom and finally end the bear market, or if we will see further declines.
Monetary policy
Well, after the latest FOMC meeting last week, I think (a lot) more declines are inevitable. Rising rates and fiscal tightening, summarized as a ”hawkish stance” of the FED, were the main reason for the stock market to tank. Investors feared that the FED would plunge the economy into a recession while trying to lower inflation. Looking at the latest FOMC meeting, I don’t think that is the question anymore. It is more the question of “how severe” this recession will get. Let me quote Jerome Powell to show you why (emphasis added):
Price stability is the responsibility of the Federal Reserve and serves as the bedrock of our economy…Restoring price stability will likely require maintaining a restrictive policy stance for some time. Reducing inflation is likely to require a sustained period of below-trend growth. Moreover, there will very likely be some softening of labor market conditions.We will keep at it until we are confident the job is done
You can look up these quotes here and here.
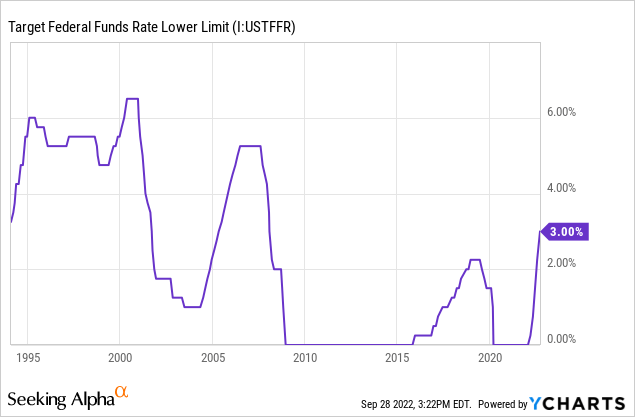
Looking at these quotes, I think there is no doubt that Powell will maneuver the economy into recession mode to lower inflation. Since the rate hikes and recession fears are the most dominant reasons for the market selloff, I see this as a strong warning sign of further declines, as I have said earlier. Additionally to Powell’s quotes, I want to show you the FEDs dot plot tool, which lets us imagine future federal funds rate target ranges.
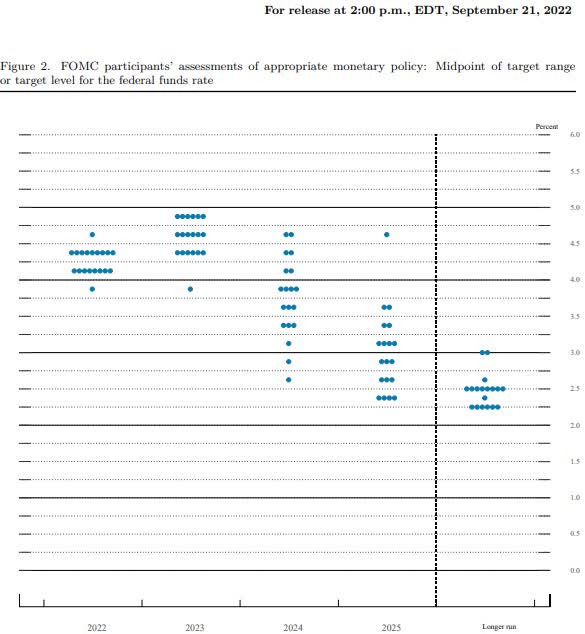
FED dot plot tool (www.federalreserve.gov/monetarypolicy/files/fomcprojtabl20220921.pdf)
Official explanation by the FED: Each shaded circle indicates the value (rounded to the nearest 1/8 percentage point) of an individual participant’s judgment of the midpoint of the appropriate target range for the federal funds rate or the appropriate target level for the federal funds rate at the end of the specified calendar year or over the longer run. One participant did not submit longer-run projections for the federal funds rate.
We can see that most participants see the target range way below what we thought was appropriate. Given that the near-term dots have risen since the last two FED meetings and the quotes by Powell, I believe it is justifiable to think that the 2024 and 2025 forecasts will increase, too. Considering the inflation rates we experience currently, this does seem necessary.
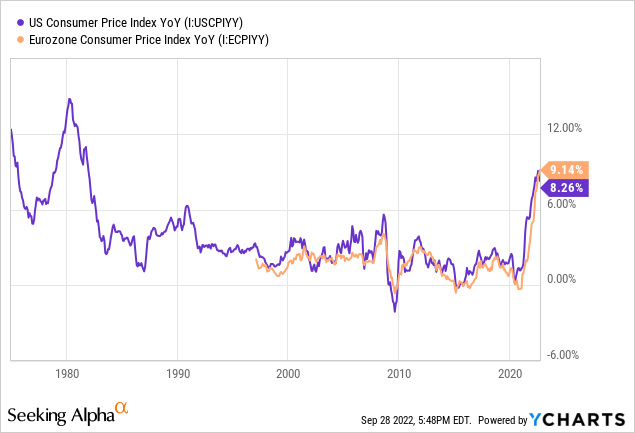
Inflation rates are at 40-year highs – both in the U.S. and EU. To set these rate hike ambitions into perspective: if we compare the current rate to the past, we see that we already have the highest rate since 2008 – 14 years back. And still, the FED wants and needs it to hike even further.
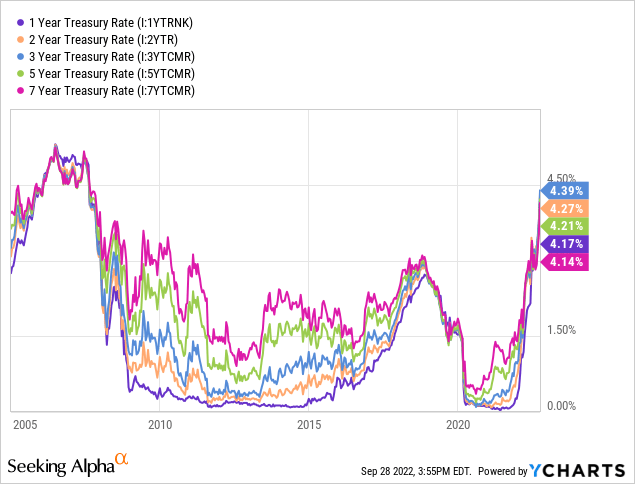
And not only is the hawkishness of the FED a threat to the economy, but it also creates alternatives to stocks, something we haven’t seen in many years. All treasuries between 1 and 7 years are above 4% – for the first time since 2007.
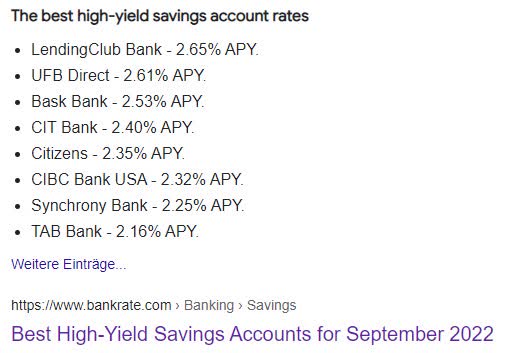
Even FIDC-secured saving accounts can offer you more than 2%+ now. Also, something we haven’t seen in a while.
FIDC savings accounts rates (www.google.com)
For me, and probably most readers here, stocks are the only real option to let the capital work. But there are people, and I assume the number to be quite high, that just used stocks because there was no alternative. These people will gladly rotate from stocks into savings accounts or treasuries/bonds again.
For me, and probably most readers here, stocks are the only real option to let the capital work. But there are people, and I assume the number to be relatively high, that just used stocks because there was no alternative. These people will gladly rotate from stocks into savings accounts or treasuries/bonds again. At this point, I can bring in some personal experience I got as a wealth manager at a German bank. Over the last few years, I had many customers strongly against investing in the stock market, even though we offered them very defensive products.
That is something the US and Germany are very different about anyway. Stocks are uncommon here, with only about 7% of German citizens investing in stocks and 12% investing in funds/ETFs.
Most of these customers did it anyway because they had no alternative and couldn’t let the money sit in their accounts for 0%. Even though most savings accounts are still at 0% in Germany, many customers ask daily if or when we will get yields on savings accounts again. As soon as they come, these customers will rotate their money into these accounts again. You may wonder why I am telling you this, but BLK makes up about a third of its revenue in Europe, and a lot of this comes from Germany. So that could hit the inflows and outflows of BLK. I will get to this point later.
Housing Market
Powell also had something to say about the housing market, which is going to be in distress soon (emphasis added).
For the longer term what we need is supply and demand to get better aligned so that housing prices go up at a reasonable level, at a reasonable pace, and that people can afford houses again… We in the housing market probably have to go through a correction to get back to that place.
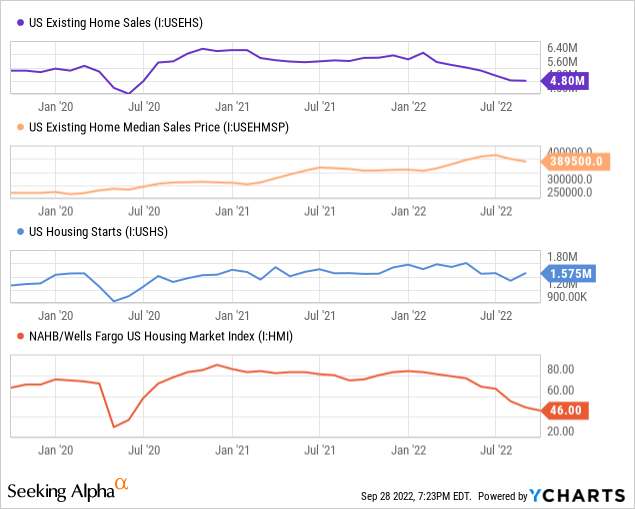
I think “correction” is a prettier word for “crash” in this context. I mean, Powell isn’t wrong here. In the last few years, house prices have greatly appreciated, especially since 2020. Since the start of the year, in addition to high house prices, mortgage rates have risen significantly. This development has made it even more difficult for the “average” citizen to buy a house – especially a new one. The mixture of historically high prices and mortgage rates as high as 2008 was enough to let the housing affordability index drop to its lowest level since 1991.
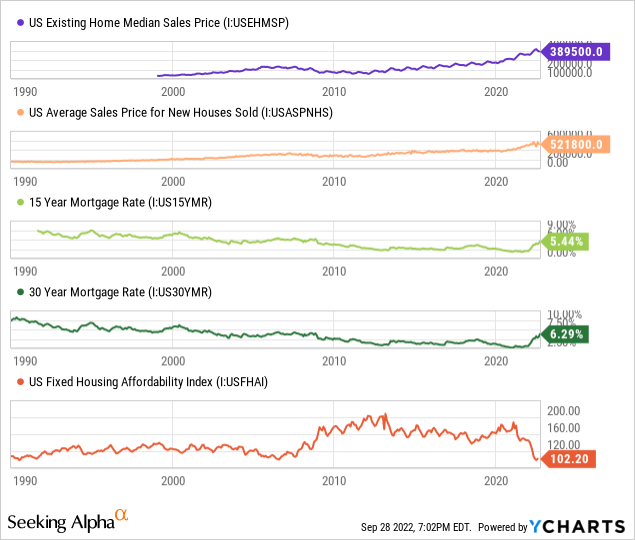
As a result, the sentiment in the housing market worsened dramatically. Sales, prices, house starts, and the NAHB/Wells Fargo U.S. Housing Market Index fell in the last few months. The U.S. Housing Market Index is currently at level 46, below the critical level of 50. Below 50 = more builders view conditions as “poor” than “good.”
Even though prices have already started to fall, the percentage of the median income a household has to pay for housing is at its highest ever, with data going back to 2006. Rent escalations and higher mortgage payments mainly drive this.
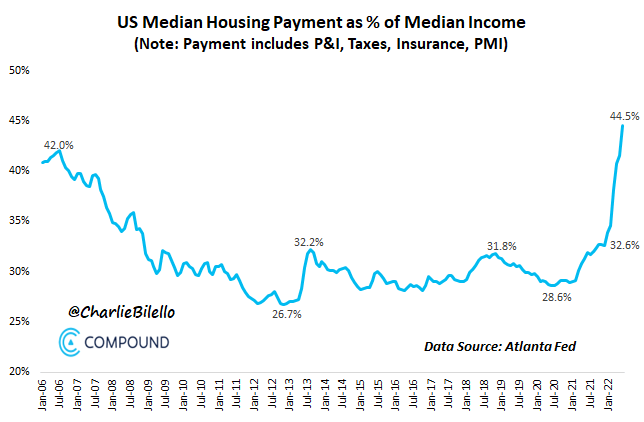
US median housing payment as % of income (compoundadvisors.com / Charlie Bilello)
History of bear markets and recessions
The two following charts are giving us a taste of what is to come.
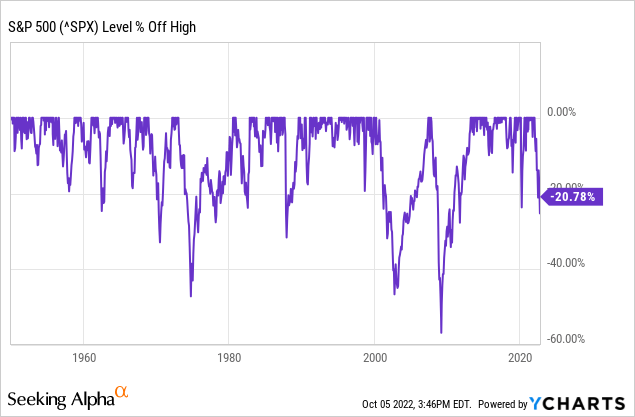
When we see a YTD performance of -20+%, most of us probably think, “oh, that’s bad.” But as you can see in the chart, the S&P 500 is trading just in the middle of all drawdowns since 1950. In short: there is room for more. The following chart shows this in more detail and with a greater time horizon:
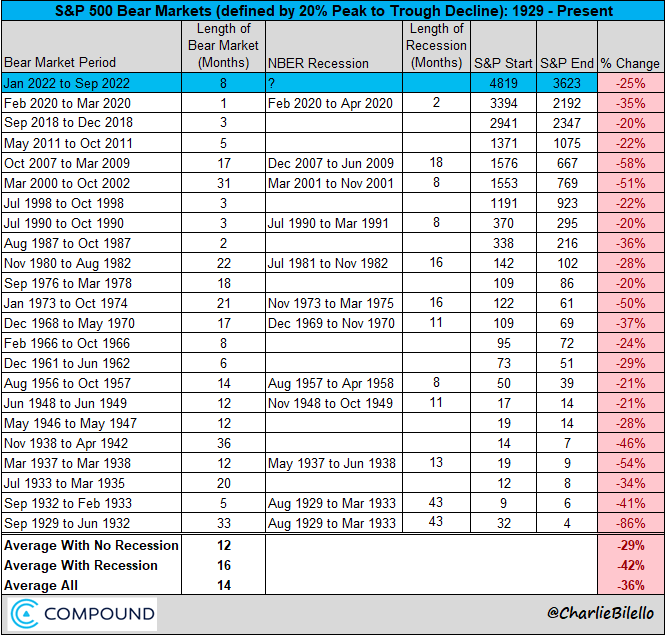
Average market downturn since 1929 (compoundadvisors.com / Charlie Bilello)
According to data from Charlie Bilello, the average bear market loss with recession is 42% in the S&P 500. At the time of writing, the S&P 500 is down 21% YTD, so there is still much room to fall. To assess how much BLK’s earnings could decline, I want to present different scenarios of how much the market could fall further.
What is BlackRock thinking about the market outlook?
Just a few days ago, BLK released its Q4 2022 outlook. I will mention two quotes and one slide showing that BLK has similar assumptions to mine.
Central banks’ focus on bringing down inflation quickly implies a clear sequence: overtighten policy first, significant economic damage second and then signs of inflation easing only many months later.
We think recession is coming. Europe is set for a deep one given its vulnerability to the energy spike. We think the U.S. recession won’t be deep enough to bring down inflation to the Fed’s target of 2%
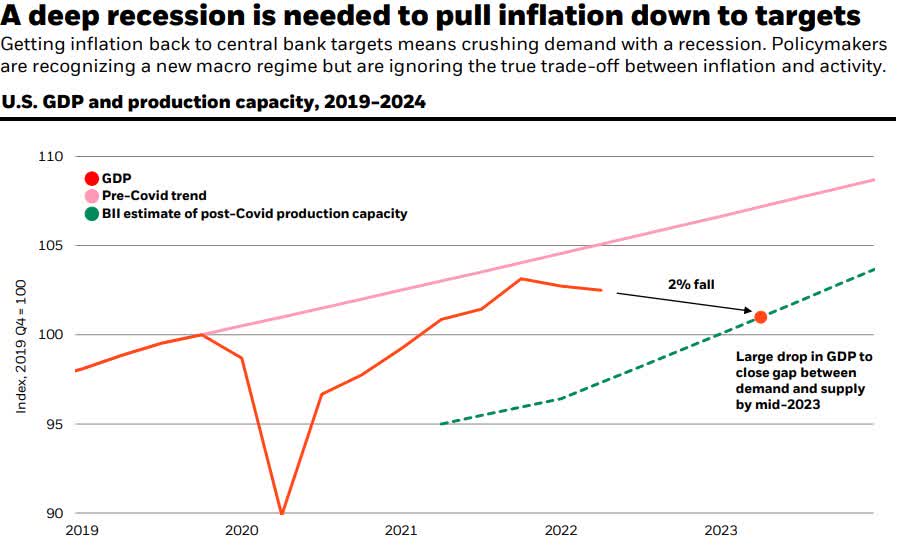
BlackRock thinks a deeper recession is needed to tame inflation (BlackRock Q4 outlook)
While the quotes line up with my own assumptions, the slide presents something new. According to BLKs estimates, we need a 2% fall in U.S. GDP until mid-2023 to close the gap between demand and supply.
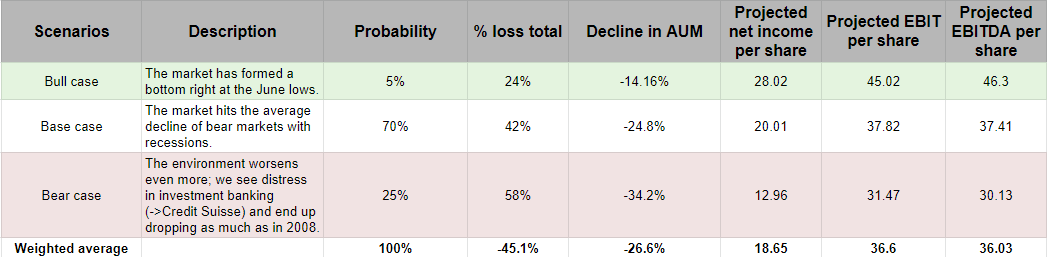
Case scenarios for the S&P 500
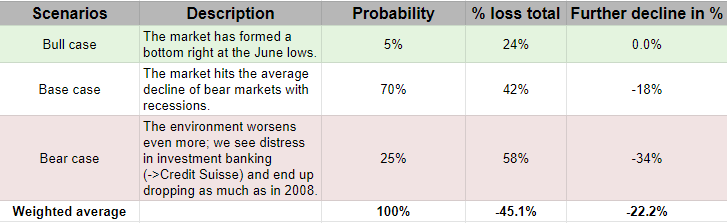
Case scenario for the S&P 500 (Author, data from compoundadvisors.com / Charlie Bilello)
The bull case would mean that we have reached the bottom, which is highly unlikely considering all the unfavorable data we have analyzed. But “never say never,” so I gave it a 5% probability. My base case is that the market will present itself as the typical recession bear market. I assume this to be highly likely, with a 70% probability. The bear case could occur if factors like inflation, rate hikes, monetary tightening, job data, and the housing market turn even more unfavorable. Also, the distress of investment banking, like Lehman Brothers in 2008, isn’t as far away as I would like to think. In the last few days, the market spoke a lot about Credit Suisse (CS), which seems to be in a situation that could bring them down if the financial conditions worsen. Its credit default swaps (CDS) spread rose significantly this year, and the fact that they have around $900B in leveraged exposure reminds some people of Lehman Brothers in 2008. Even though I still think that a Lehman 2.0 is unlikely, I put a 25% probability on the bear case. The weighted average of my assumptions suggests a further decline of 24% for the S&P 500.
Quick summary of the market’s health and outlook
We have the following problems, most of which were mentioned in detail earlier:
- Decade high inflation
- A very hawkish FED, willing to put the economy into recession
- Average mortgages are as high as last seen in 2001
- Highest debt levels ever
- A very (too) strong USD
- We have reached a long-gone level of geopolitical tensions
- One of the largest banks in the world is too close to default to feeling comfortable
- Start of one of the most significant energy crises in decades.
Considering this and the fact that history projects much greater losses for the S&P500, I think it is fair to say that we will see more declines for a longer time.
How could BlackRock’s earnings react to this?
BLK generates revenue as follows:
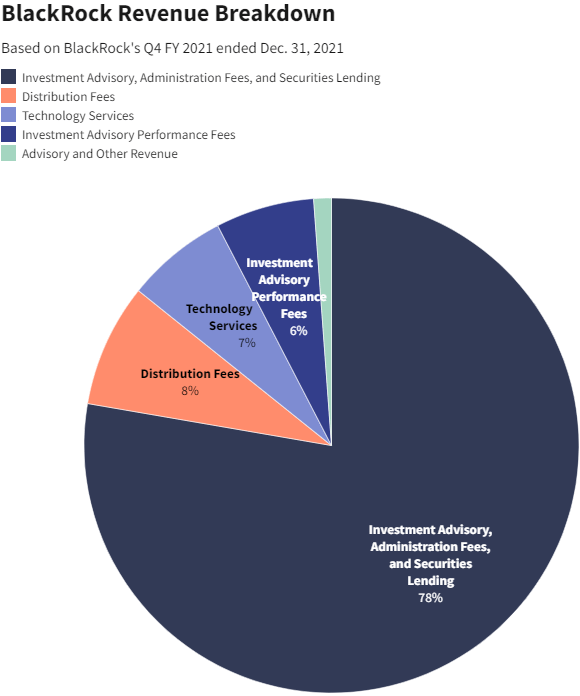
BlackRock revenue structure (BlackRock 8-K)
So, the vast majority of its revenue comes from fees. These fees are based on the Assets under Management (AUM). A significant decline in AUM will strongly affect BLKs income. Threats to AUM:
- The decline of stocks and bonds
- FX changes
- Outflows > inflows.
Because of these three risks, I spent much time explaining the current market, economy, and outlook. Earlier, we assessed the first threat, the decline of stocks and bonds. There is a high likelihood that the market will see a further weakening of about 24%. If the USD continues to strengthen against its peers, this could further threaten BLKs earnings. The inflows and outflows are also dependent on the health of the economy. The following topics will affect the future inflows and outflows of BlackRock:
- Inflation
- Alternatives to stocks and bonds
- Highest % of income required for housing.
Higher prices due to inflation and higher mortgage or rent payments will continue to limit the amount of money people can spare to invest. The average savings of U.S. citizens have already reached a long-time low. The fact that we have real alternatives to stocks and bonds for the first time in years will probably lead to some people rotating out of stocks and bonds into savings accounts. The development we saw in the last few years, people had much money to save, and stocks and bonds were the only solutions, are over.
Analyzing BLKs Q2 earnings, it becomes clear that threat nr. 1 and 2 have already struck while threat nr. 3, the inflows and outflows, has yet to materialize.
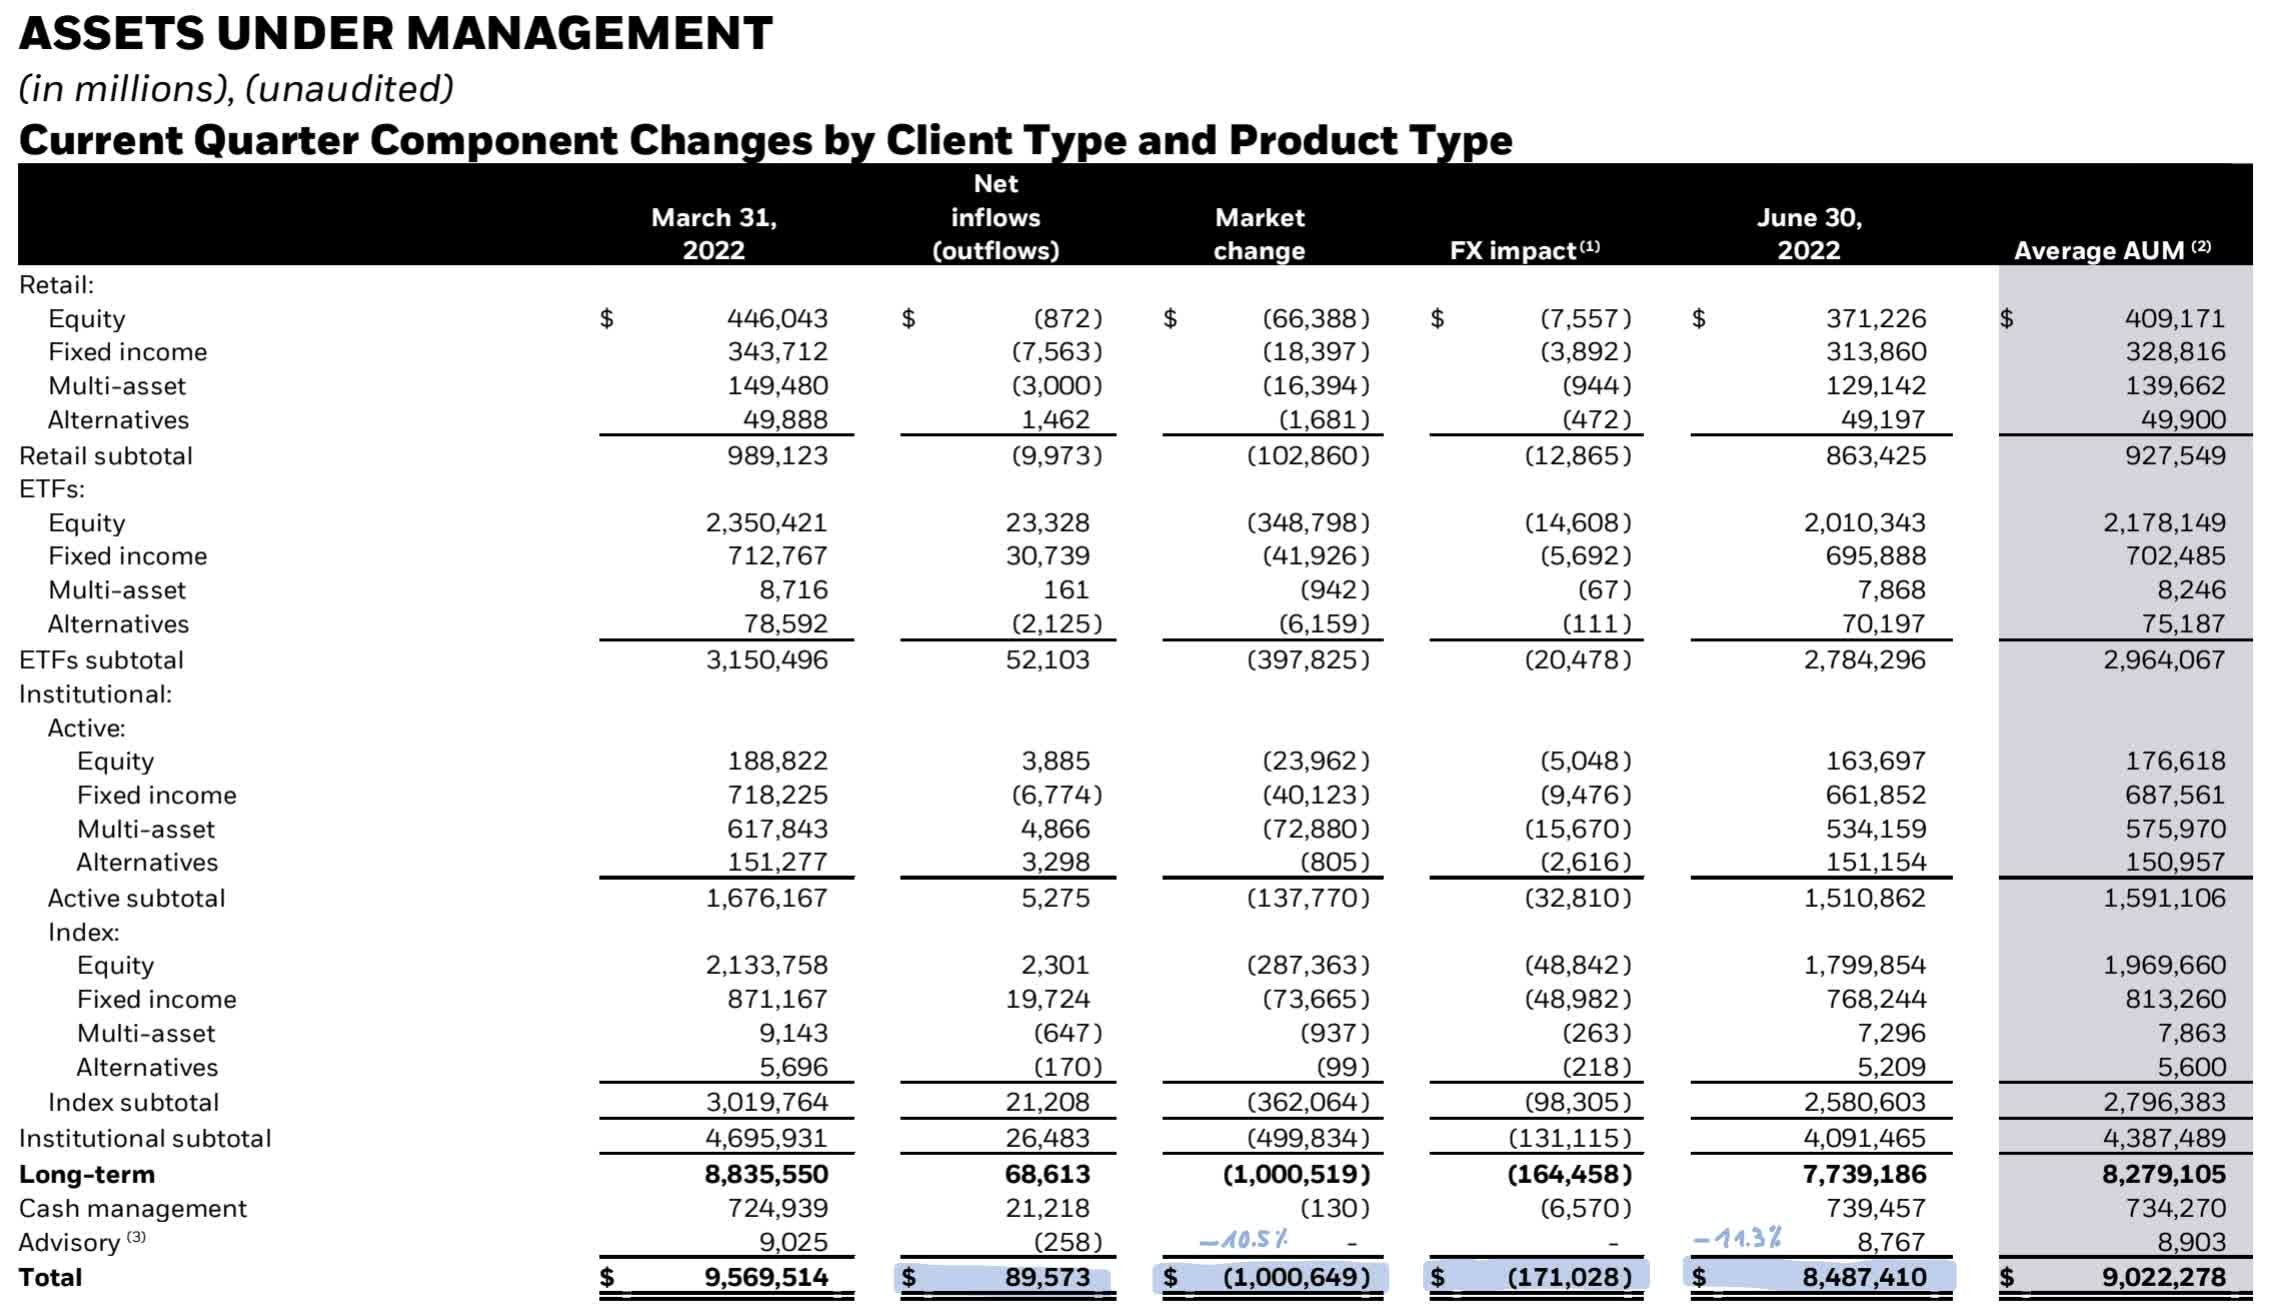
BlackRock Q2 AUM (BlackRock investor relations)
In Q2, AUM came out with $8.49T. That is a QoQ decline of 11,3% and 15,2% from its peak in Q4 2021. Looking at the numbers, we can see that market and fx changes were the most significant factors for the decline. The market change took away over $1T in AUM, more than 10% of the total AUM from the previous quarter. Fx change was -$170B. Most comments about BLKs Q2 earnings were positive due to the good inflow of $90B, which was more than in the previous quarter. Considering that the inflow only makes for 53% of the fx change loss and 9% of the market change loss, I don’t think of it as “that great.” The significantly lower AUM represents the net income and operating income changes.
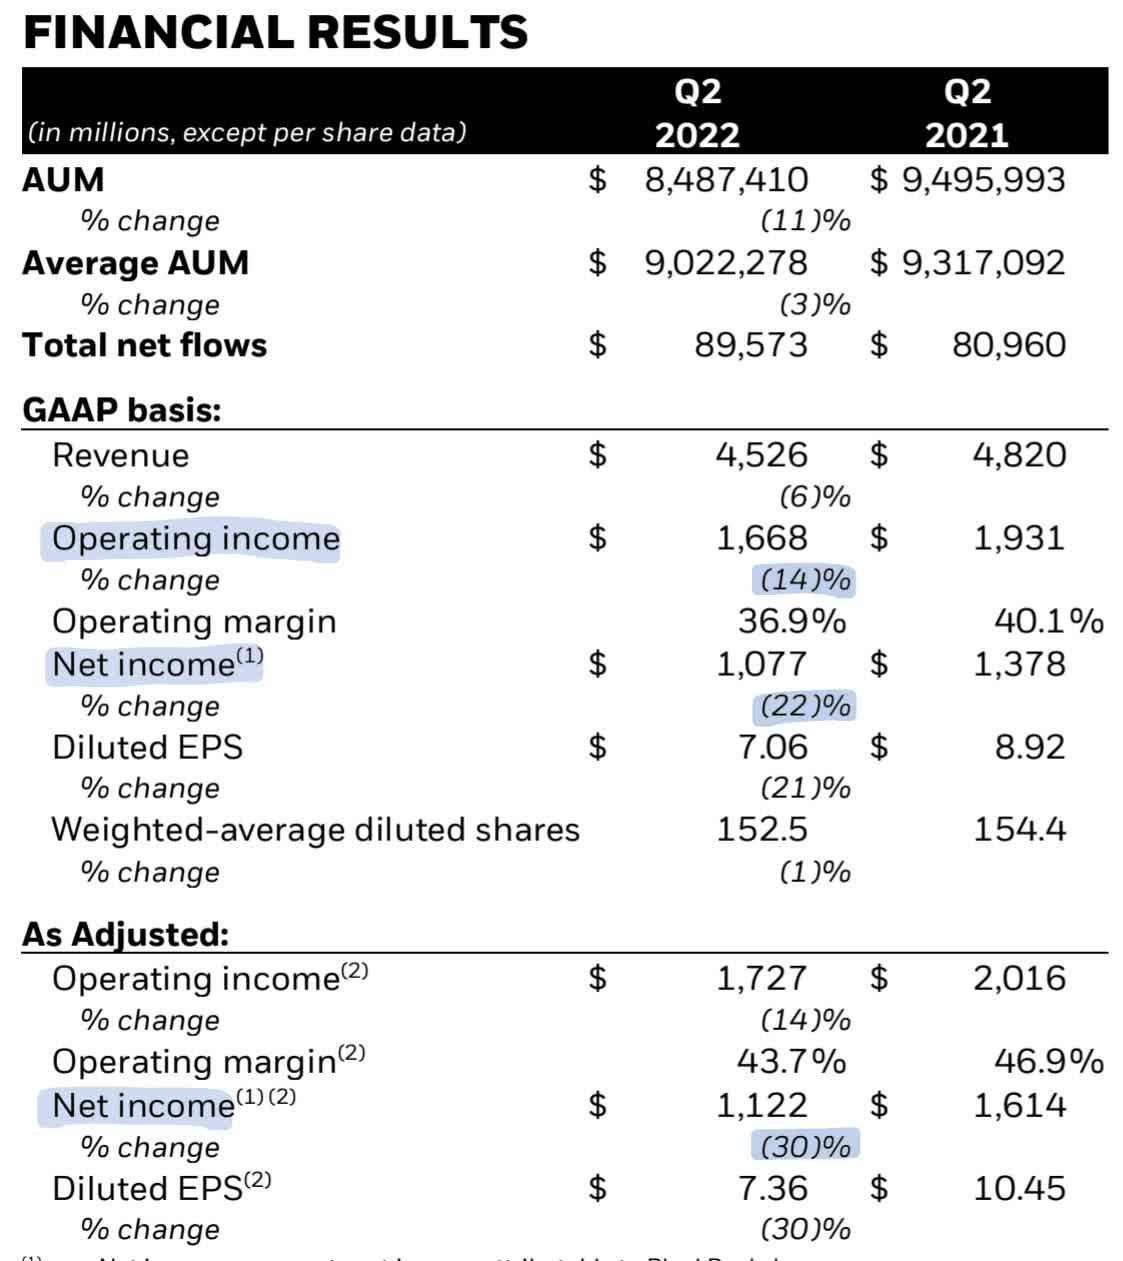
Blackrock Q2 financial highlights (Blackrock investors relations)
The significantly lower AUM represents the net income and operating income changes. Operating and net income changed by 14% and 22% YoY, respectively. “As adjusted,” a metric BlackRock calculates by themselves, gives it an even worse look with net income down by 30% YoY. To visualize this:
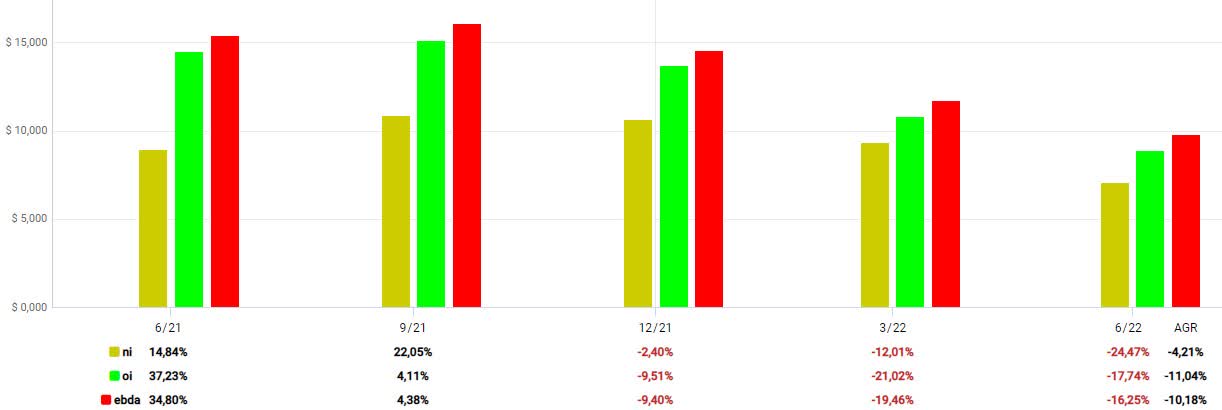
Net income (yellow), operating income (green), EBITDA (red) (FastGraphs -> Fun Graphs)
Since the earnings metrics primarily determine a stock’s valuation, declining earnings could bring more pain to the share price. As I said earlier, with this article, I want to assess how much downside potential is still there for BLK. For this, I analyzed the declines of AUM in correlation to drops in the S&P 500. The following chart shows five examples of drops in the S&P 500 and the correlated declines in AUM. I then calculated an average and broke it down to a 10% drop in the S&P 500.
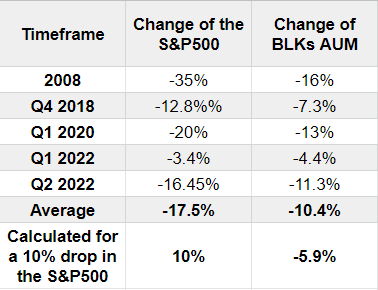
Declines in AUM in correlation to the S&P 500 (Author, data from FastGraphs and Blackrock investors relations)
Past averages suggest that for every 10% drop in the S&P 500, the AUM declines by 6%. I combined that with my case scenarios for the S&P 500 to assess the projected decrease in AUM and then calculate the earnings per share. I used past percentage declines correlated to a decrease in AUM to figure this out.
Projection of earnings in correlation with AUM (Author, data from FastGraphs / Blackrock investors relations)
These earnings represent the bottom of the bear market based on the probability assumptions I explained earlier. If we combine these earnings per share with BLKs average multiples, we get the price target.
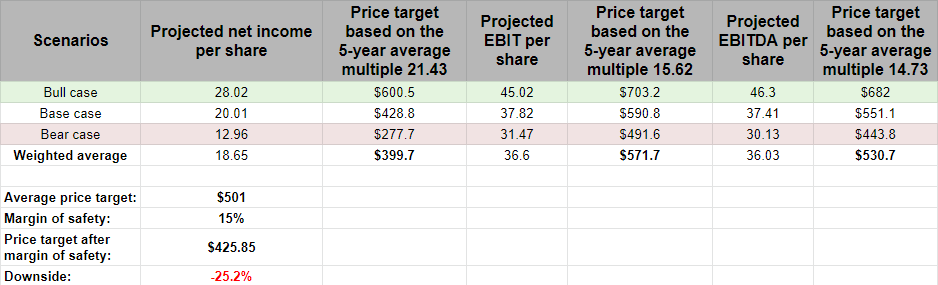
Price target (Author, data from FastGraphs / BlackRock investors relations)
The average price target is $501. Due to many variables in this calculation and the fact that BLK trades below its 5-year average multiples, I suggest subtracting a margin of safety. I chose 15%, which gives us a price target of $425, implying a downside of 25%. With a 20% margin of safety, you get a price target of $400, implying a 30% downside. I did include the fx changes in my calculations but didn’t put them into the charts. In my calculations, fx changes played a minor role. Note: I don’t say that BLK will definitely reach these price targets. Rather I want to tell you what prices are possible. Why so? In my time here on Seeking Alpha, several social media platforms, and as a financial advisor at a bank, I have heard so many people telling stuff like “No, this stock will never be at… price again,” or “If you wait for it to drop, you will never buy.”
A few months ago, I chatted with someone on Twitter about Alphabet, and he told me that the stock won’t ever dip below $100 USD due for several reasons. I’m a fan of Alphabet, too, but in this market, everything is possible. And on 09/30 the stock hit $96, currently sitting slightly below $100. What I am trying to accomplish with this article and these price targets is, that you get a more conservative and careful look at the future of BLKs stock in contrast to the many buy ratings for BLK you can find here on Seeking Alpha. Conservativeness is what you need in times like that. It reduces risks and can boost your returns when you get to buy something even deeper.
FastGraphs forecast (FastGraphs)
At the current price, the total return until the end of 24 is 42% or 17% per year, according to analysts. If the share price drops to $425 by the mid of 23, the total return until 24 would be close to 75%, or 50% annually.
Another way to assess a potential buy point is the analysis by Cory Cramer. He uses historical earnings or market cycles to estimate the bottom of a stock.
My analysis focuses on the cyclical nature of individual companies and of markets in general. I’ve developed a unique approach to estimating the fair value of cyclical stocks, and that approach allows me to more accurately buy near the bottom of the cycle.
Read more about this on his profile. There, you will also find his marketplace, a one-in-a-kind service all around the analysis of different cycles.
I found his articles very helpful, so I asked him to give me his opinion on BLK, which you can read here:
“The interesting thing about BlackRock (BLK), and a few other stocks (like T.Rowe Price Group (TROW) and Texas Instruments Incorporated (TXN)) is that EPS declines during recessions tend to be moderate (less than -50% total off their peak EPS), but the price declines can be much deeper. This creates a situation where an investor can buy these stocks during recessions at tremendous discounts without taking on a lot of actual earnings risk. In other words, the market tends to put these types of stocks on a super-sale, which offers a very good deal for longer-term investors.
Below is a table comparing BlackRock stock’s current earnings and price decline compared to what it suffered in 2008/9:
Metric
2008
2022
EPS Decline
-24%
-14% (So Far)
Price Decline
-60%
-41% (So Far)
Peak P/E
27.5
24.66
It’s worth noting that the peak P/E ratios going into each decline were roughly similar, so it’s likely that near the cyclical peak, BLK in 2008 and 2022 were valued similarly by the market. In 2008, BLK’s EPS fell -24% on an annual basis, while the stock fell a whopping -60% before bottoming. This downturn, analysts currently expect EPS to fall -14% (though I expect this number to get lower as time goes on) and so far the stock price has fallen -41% off its highs. This is almost the exact same ratio of EPS decline to stock price decline we saw in 2008/9. I think there are a couple of ways an investor can play this. The first way is to compare the current bear market to 2008/9 and take a guess at how the current bear market will ultimately compare. If you think it will be about the same, then you could aim to buy BLK when it is about -60% off its highs. If you think this decline will be shallower, you could buy at -50% off the highs, or if you think our current situation will be worse, perhaps aim for a -70% purchase price. The second way to do it is to use what I call a “Recession P/E” as a guide. This will be a more fundamentally-based approach, where an investor aims to buy when the stock has P/E ratio similar to what it had near the bottom of 2009. I take these monthly average P/Es from FAST Graphs, and for BLK back in 2009 the recession P/E was 14.06. However, the recession P/E for March 2020 was lower, at 11.96, and I always like to be conservative, so I am using the 11.96 metric. Right now, the blended P/E is 16.72 (if their earnings expectations fall, that P/E will rise if the “E” gets smaller, which I expect it to do). Right now, that implies a further -30% price decline for BLK if the market treats the stock as it did in the past. This implies a recession buy price roughly around $409 per share, which is actually pretty close to the -60% off high price of $389 per share. So, if the price were to get down to that range, it should offer a very good medium and long-term value for those investors willing to buy.”
Conclusion
Today’s market is set up perfectly for deep distress, with many problems already here, like inflation and rate hikes, and many just starting, like the housing market. In my opinion, this alone suggests that there is more pain to come. Furthermore, we know that history repeats itself. If that is the case here, this would also mean that we face further declines in the market.
BlackRock relies entirely on the health of the market and the economy, which is why I give it a hold rating right now. I like the company, I really do. But due to the current situation, I am confident we will see lower share prices for BlackRock. When they come, or the market miraculously brightens up, I will buy myself a significant position. But until then, this is a hold for me. Additionally, this matches Cory’s estimates of a good entry point.
Be the first to comment