


Vertigo3d
It was coming surely. History has taught us that these things do not end well. A friend mentioned the other day he missed the boat on Bitcoin (BTC-USD). But what boat? With certain confidence, I can say that everyone that has mentioned crypto to me in passing in the last couple of years has absolutely no idea of how to sail “the boat” as in order to do so, you must have experience on when to set sail along with a target destination and plan if the waters get choppy.
And so for many I’d imagine, unfortunately it has been a hard lesson, people with absolutely no prior financial trading experience buying crypto as it elevated from a relative novelty to just a touch under 70k per coin.
And it is there we will start, at the top and work our way down. An astronomical wave one downwards consisting of nearly half the overall price of a Bitcoin will actually send it to zero should the wave three numerically copy it so we will delve into the third wave and see where Bitcoin may turn around if it’s going to.
Below we can find the monthly chart.
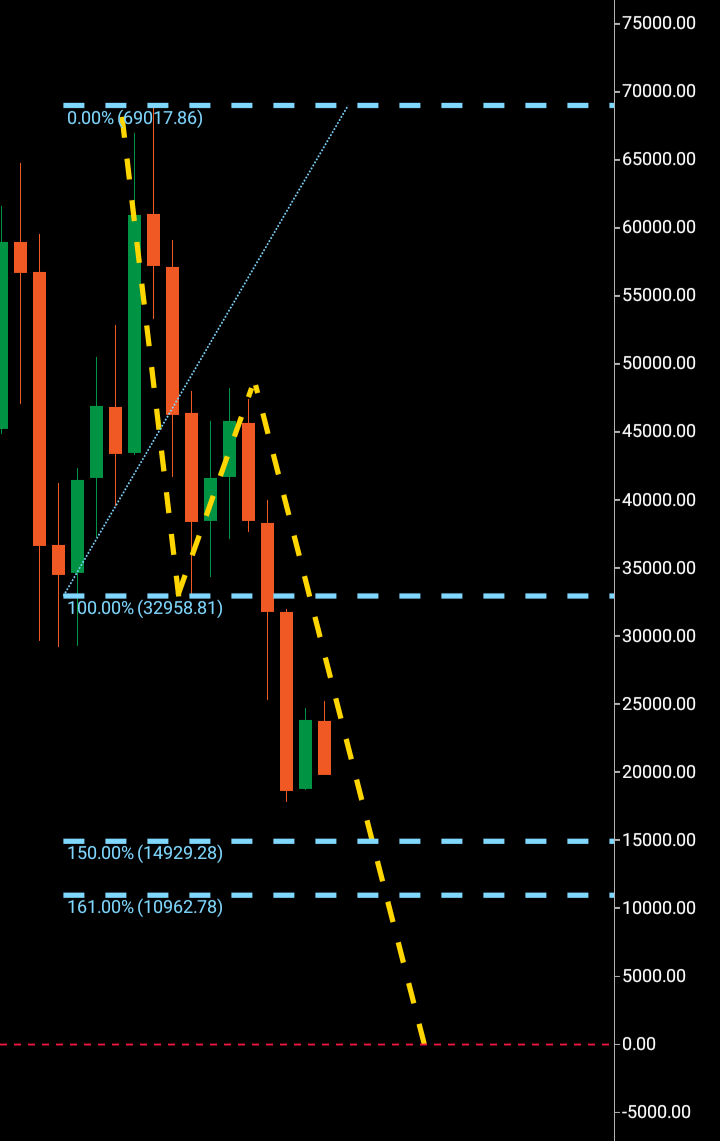
Bitcoin Monthly (C Trader )
Topping out at $69k in October 2010 and soon following a rapid decline we can see initial support being created at $32k. This has now set out the map of the bearish wave one but not until the initial bounce from support to $47k failed by the break of that support at $32k that waves one two and three were cemented.
We can see outlined Fibonacci levels outlined with the 150% and 161% at 14k and 10k respectively.
Bitcoin has so far found technically weak looking support at the high $17k region which in wave theory territory classifies as thin air.
Below we can see a magnified shot of the current monthly candles.
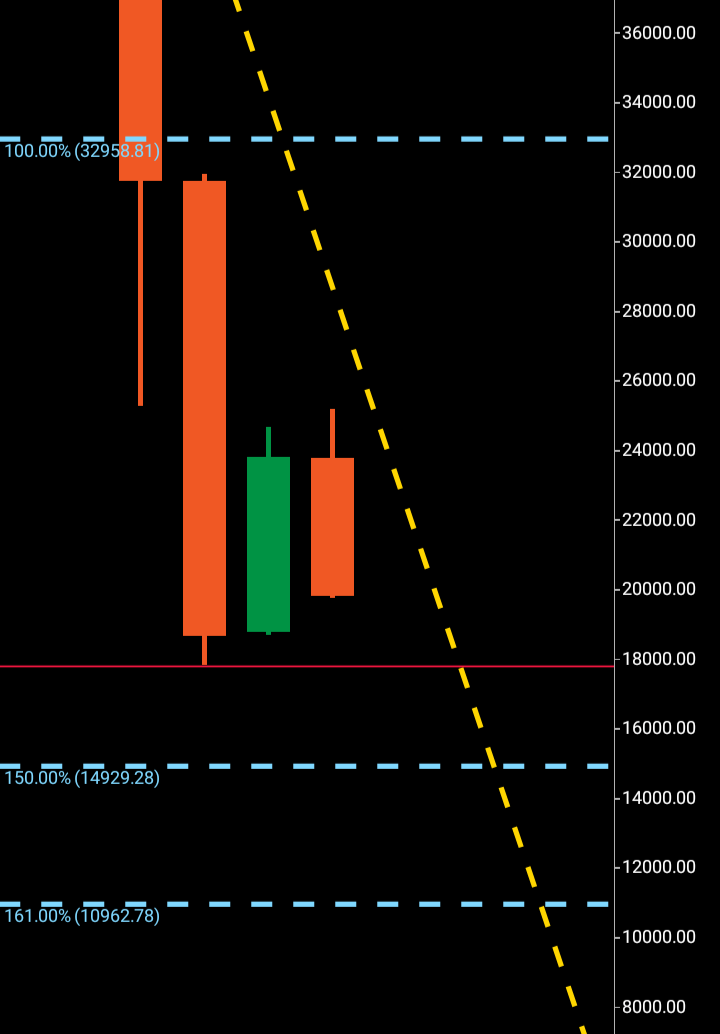
Bitcoin Monthly (C Trader )
First of all, the monthly chart certainly provides no solid evidence of a turn around. If we look at the macro candles in picture above, they consist of no bottom wick action what so ever. Bottoming candles must possess at the very least a third of the overall candle settled by a wick at the bottom. This is representative of orders that must act as foundation to cement the financial product going higher.
If anything, this can be interpreted as a very bearish structure as a bullish candle with virtually no bottom wicks that forms beside fully bearish candles generally give insight that there is absolutely no one willing to buy directly underneath.
Waves don’t normally settle at the Fibonacci 150% so it is the 161% that we must technically look to.
But first, to get a different perspective, we can switch to the weekly chart which show the initial three wave pattern that came before the monthly. We can see that the $25k region is the Fibonacci 161 which did see a small bounce at that level and then a bearish follow through to where we are today with the $14k region the target for that weekly third wave completion which matches confluence with the monthly chart and the Fibonacci 150% area. Below we can see the weekly chart with the wave one two and three along with targeted areas .
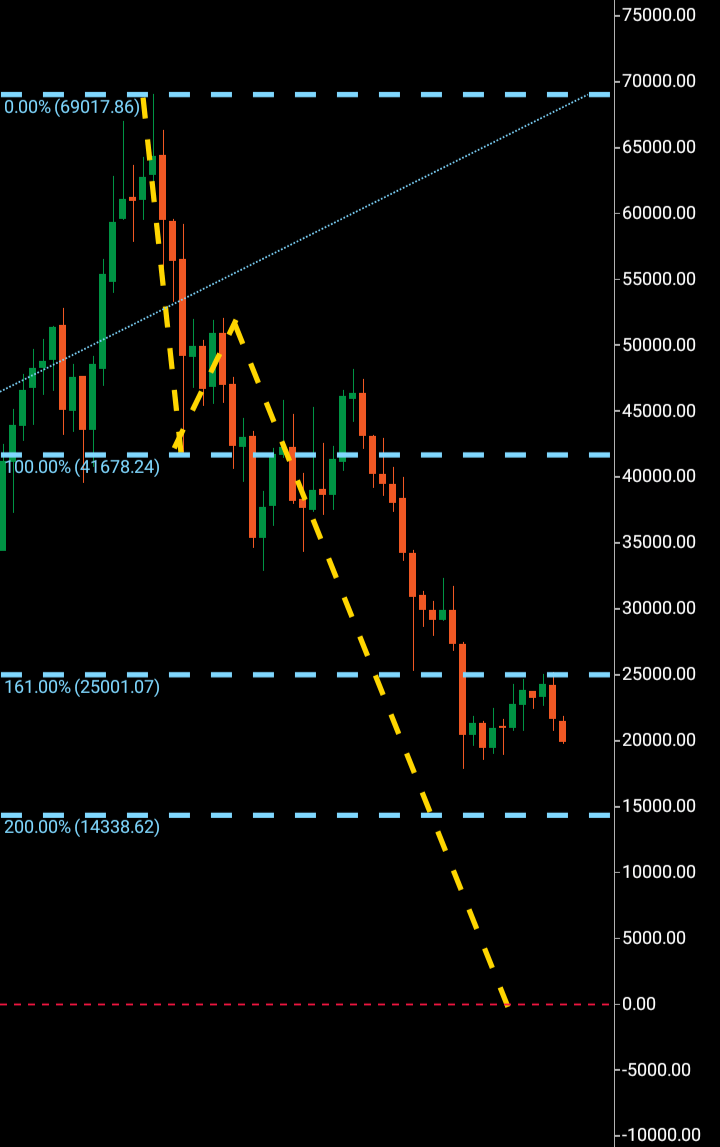
Bitcoin weekly (C Trader )
If Bitcoin were to reach $14k , this could possibly have two outcomes, that Bitcoin gets a bounce off that 14k region or it could look to make a more solid attempt at a turnaround. More technical evidence would be revealed should the price reach this point.
Here again is the monthly chart that outlines the macro wave target.

Bitcoin Monthly (C Trader )
To finalize, I would expect Bitcoin to see it’s macro monthly Fibonacci 161 at $10k as a bearish target for this crypto currency. Given there is evidence of a bearish structure candle wise at the $17-$20k area which we have covered above, I expect Bitcoin to break through that and ultimately continue to 10k within the next 90-120 days.
About the Three Wave Theory
The three wave theory was designed to be able to identify exact probable price action of a financial instrument. A financial market cannot navigate it’s way significantly higher or lower without making waves. Waves are essentially a mismatch between buyers and sellers and print a picture of a probable direction and target for a financial instrument. When waves one and two have been formed, it is the point of higher high/lower low that gives the technical indication of the future direction. A wave one will continue from a low to a high point before it finds significant enough rejection to then form the wave two. When a third wave breaks into a higher high/lower low the only probable numerical target bearing available on a financial chart is the equivalent of the wave one low to high point. It is highly probable that the wave three will look to numerically replicate wave one before it makes its future directional decision. It may continue past its third wave target but it is only the wave one evidence that a price was able to continue before rejection that is available to look to as a probable target for a third wave.
Be the first to comment