


3 Irresistible Picks
GlobalP/iStock via Getty Images
We’ve got three REITs to highlight. These REITs:
- Earned over $100,000 of our capital allocations in the last few months.
- Trade at substantial discounts to NAV, which is unusual for them.
- Have outstanding growth in rental rates year after year.
- Have seen growth in rental rates increase even faster in 2022.
- Appear to still be posting excellent growth in Q3 2022 from the data disclosed by the largest player in the sector.
- Are down over 32% year-to-date.
We will start with Rexford Industrial (REXR).
Rexford
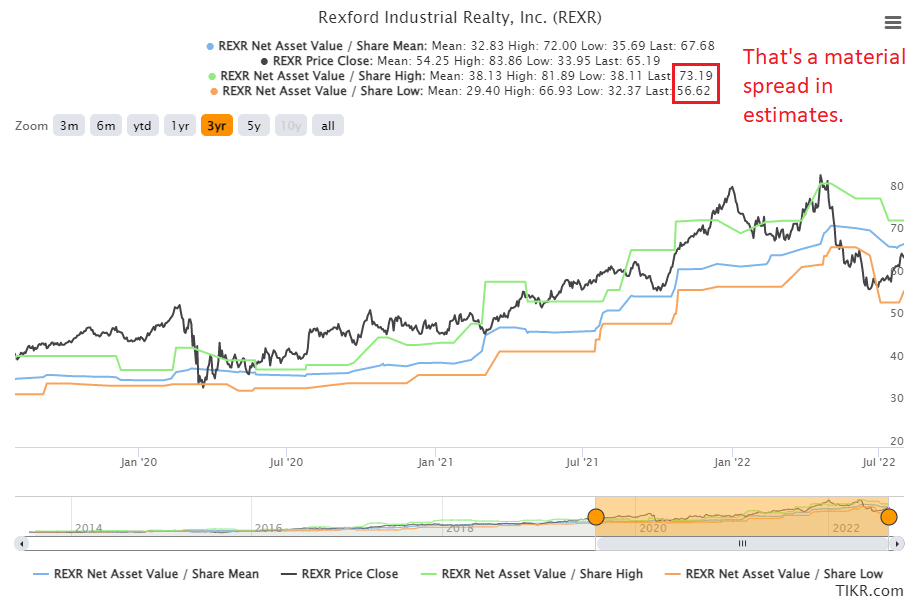
Using consensus NAV estimates (which are not always precise), REXR’s estimated NAV was running around $67 in July.
TIKR.com
Note: This chart ends earlier to demonstrate the values through Q2. I’ll provide an updated chart a bit further down.
That would put the issuance below NAV. On the other hand, we’ve found management tends to achieve higher stabilized cap rates on acquisitions than the cap rates used in estimating NAV. Consequently, there’s a bit of a disconnect. I’d feel more comfortable seeing issuance above $67 or $68, but if management has the right opportunities to buy new properties, the issuance could still be accretive.
Enhanced 2-Year Guidance
On the Q1 2022 earnings call, management said:
From an internal growth perspective, over the next 24 months, we project approximately $140 million, or 33% of annualized NOI growth embedded within our in-place portfolio assuming no further acquisitions, which includes $31 million of incremental NOI as our redevelopment and repositioning projects stabilized, $29 million of incremental NOI from recent acquisitions, and $82 million of incremental NOI contributed as we roll below market rents to higher market rates.
Sounds good, right?
But on the Q2 2022 earnings call, management said:
Over the next 24 months, we project approximately $172 million equal to 43% of annualized cash NOI growth embedded within our current portfolio, assuming no further acquisitions and based upon today’s market rents.
The components of our internal NOI growth include $73 million of incremental NOI as we roll in place rents to higher market rates and as we ratchet up our annual contractual rent steps, $45 million of incremental NOI as our redevelopment and repositioning projects stabilize and $54 million of incremental NOI contributed from recent acquisitions. Within our embedded NOI growth, we are projecting annual same property cash NOI growth of approximately 8% to 10% over the next two years.
That’s generally positive as we’re looking at even more growth. However, we want to break down the comparison:

The REIT Forum
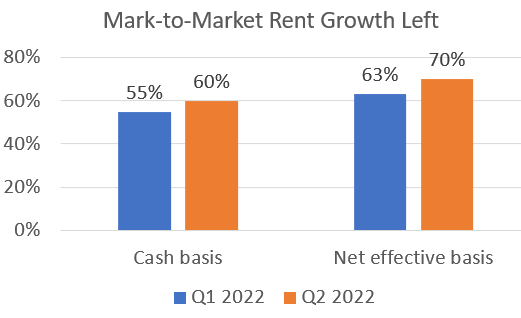
Using the Q2 metrics, less of the rent growth comes from rolling rents higher. I believe that is because so many leases were rolled dramatically higher during Q2 2022. Some investors might misconstrue this information as suggesting that industrial rent growth suddenly fell off late in the quarter. However, that would be wrong. Based on management’s commentary, the growth left from raising rental rates is even higher than before:
The REIT Forum
Market rates for industrial real estate continued to increase so quickly that on average the portfolio is even further below market rates today than they were before. To be fair, part of this is probably due to including acquisitions for Q2 2022 with significantly below-market rental rates. Those acquisitions would drag average rental rates lower to partially offset the growth in rates on all the new leases.
Same Property NOI Growth
When we’re looking at industrial REITs, two of the most critical factors are the growth rate in cash leasing spreads (a leading indicator) and the growth rate in same property cash NOI. These factors work together to drive growth in AFFO per share.
We already know from the earnings call that management is projecting same property cash NOI growth in the range of 8% to 10% over the next 24 months. That’s massive and it means investors should be projecting very strong growth in AFFO per share.
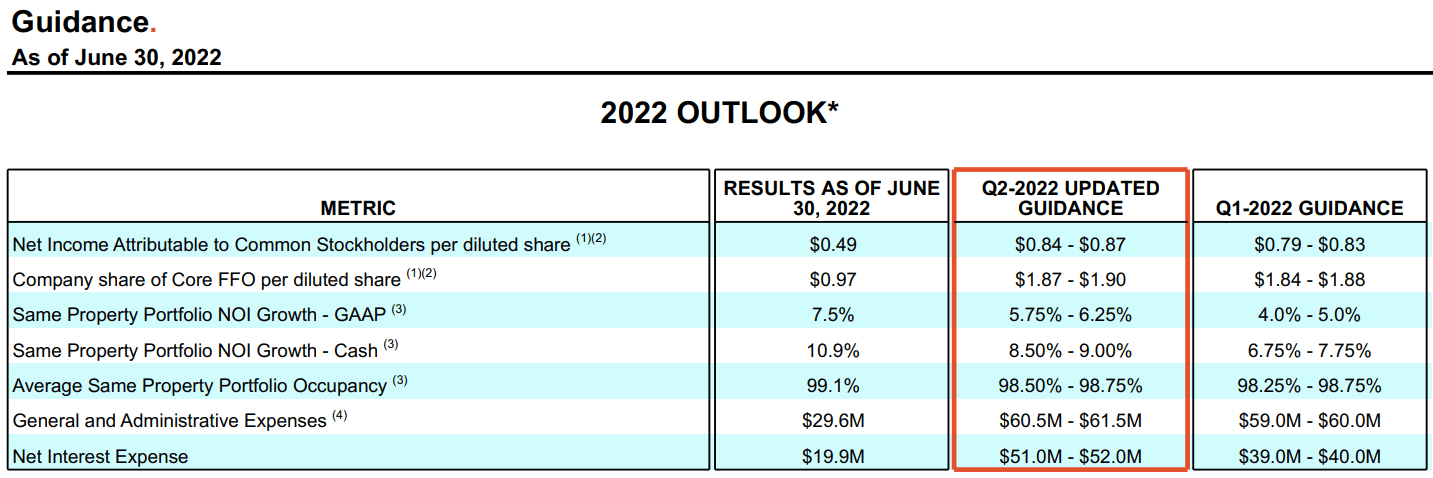
However, REXR also raised their guidance for 2022:
REXR
Guidance for 2022 saw same property cash NOI growth projections increased from a range of 6.75% – 7.75% to a range of 8.5% – 9.0%. That’s a material improvement and aligns well with the two-year projection. However, investors should be aware that the 8.5% to 9.0% range is below the 10.9% posted in Q2 2022.
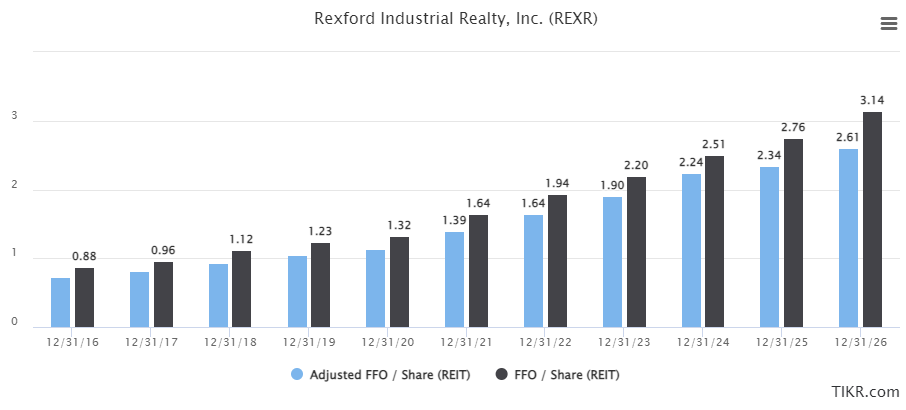
Consensus estimates for growth rates in FFO and AFFO appear to be accurately reflecting the expected level of same property NOI growth:
TIKR.com
It’s worth noting that the FFO estimate at $1.94 is a bit above management’s estimate for Core FFO. We focus more on AFFO since it does a better job of reflecting actual cash flows. However, you can see the projected growth from $1.64 for 2022 to $2.61 for 2026. That would represent about a 12.3% compound annual growth rate in AFFO per share over the next four years.
Updated Rexford Chart
Here’s a new chart for REXR running through the present day:

TIKR.com
You can see that the top estimate is down a hair while the bottom estimate climbed slightly. Overall, NAV estimates remain pretty similar as rapid growth in NOI can offset modest increases in cap rates.
You can also see that shares are trading at a material discount to the consensus NAV estimate, which has been very rare. Since its inception, REXR has usually traded at a premium to NAV:
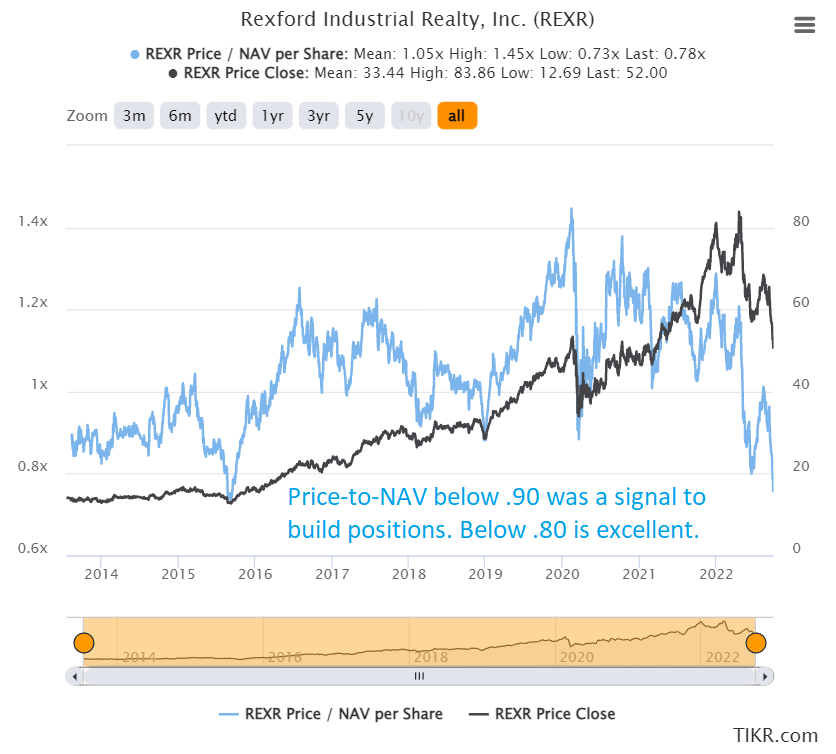
TIKR
Pretty easy to see why REXR is a strong buy?
Since we went in so much depth on REXR, I’ll be doing shorter sections on the other shares.
Terreno
Much like REXR, Terreno (TRNO) is focused on industrial real estate in the most desirable markets:
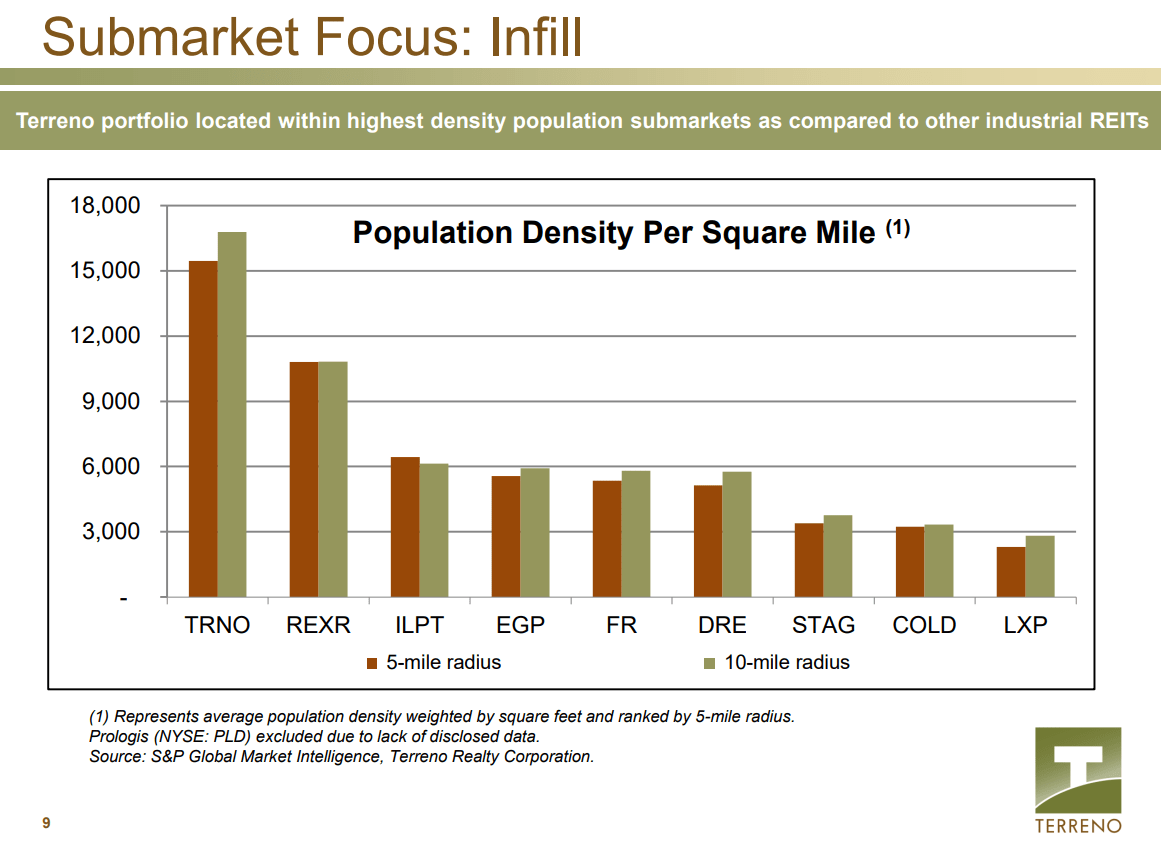
TRNO
These areas with high population density tend to have much higher real estate values and restrictions on constructing industrial real estate. Between the high cost of land and the barriers to constructing industrial real estate, there’s a perpetual imbalance in the supply/demand picture as e-commerce relies on quick delivery to these areas. This is precisely where the customers live, so it’s a necessity for companies that want to offer quick delivery.
The necessity of being in these areas drives dramatic increases in rental rates, which fuels growth in revenue per share and AFFO per share.
Terreno trades at a substantial discount to NAV, which is very rare. On average shares had a price-to-NAV ratio of 1.13x over the last five years. That compares to only .83x today:
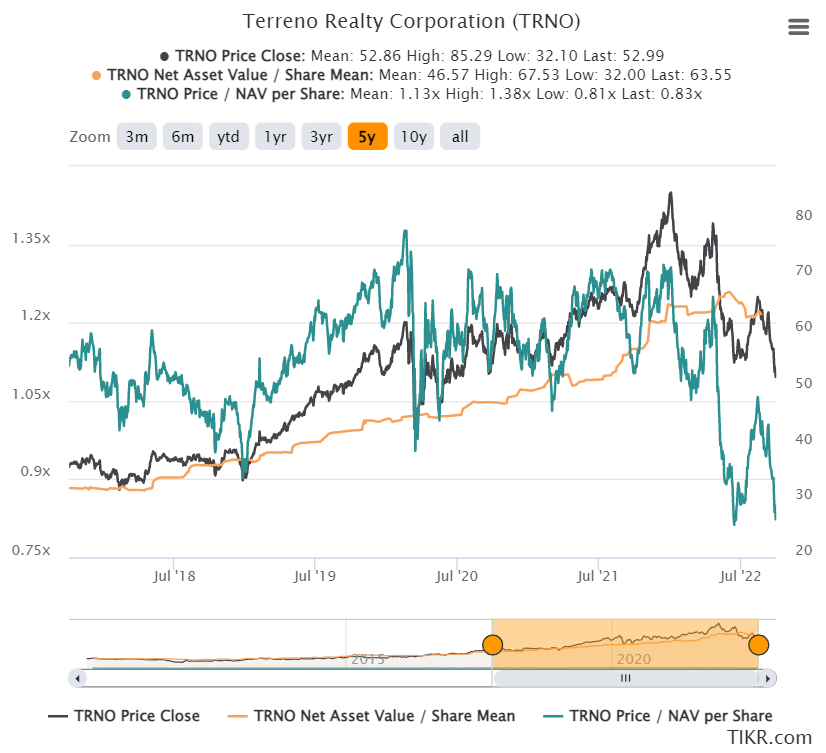
TIKR.com
Prologis
Prologis (PLD) is the largest of the industrial REITs and it offers a great value also.
Remember the story about how Amazon (AMZN) had too much industrial space and was going to sublease around 30 million square feet? Think that matters?
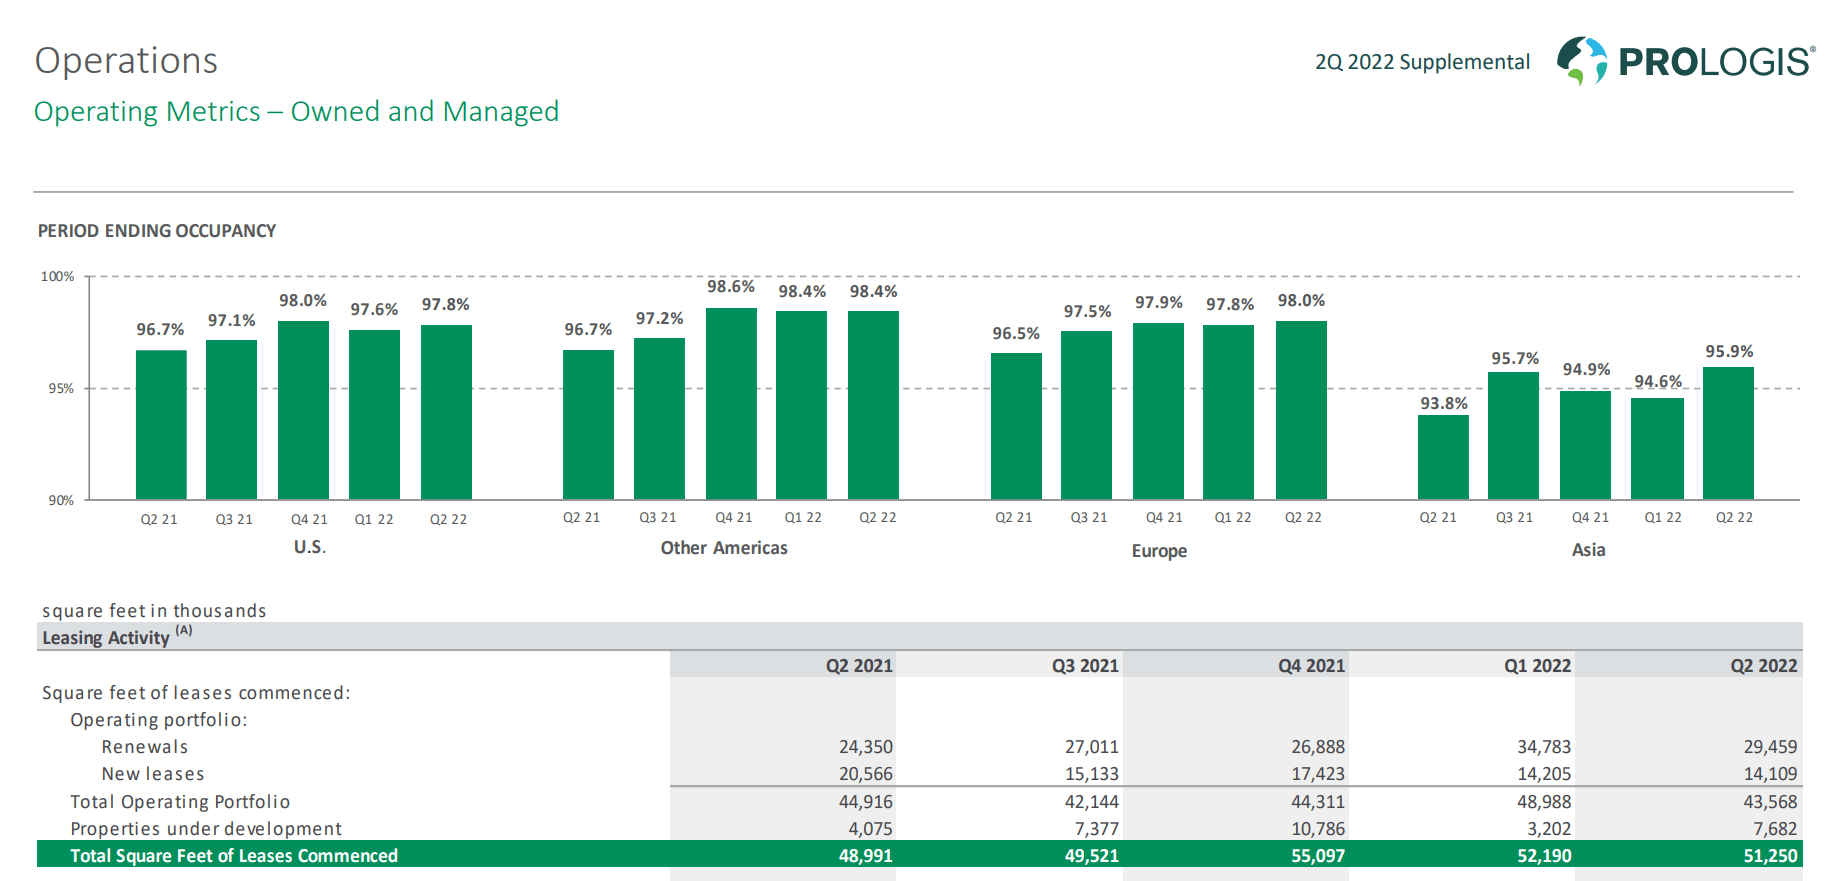
Prologis averaged over 50 million square feet of leasing activity across the last five quarters:
Prologis
Amazon’s big headline number for subleasing industrial space (if they actually sublease that amount) would have been equal to about 60% of what PLD leases in a single quarter. However, Amazon didn’t actually say they would sublease the entire 30 million. It was a minimum of 10 million with 30 million as the more sensational headline. Well, 10 million is only 20% of PLD leases in a single quarter.
But maybe you still think subleasing that space will ruin industrial real estate.
Prologis increased average occupancy in Q3 2022 while raising rents on new and renewal leases even faster than before:
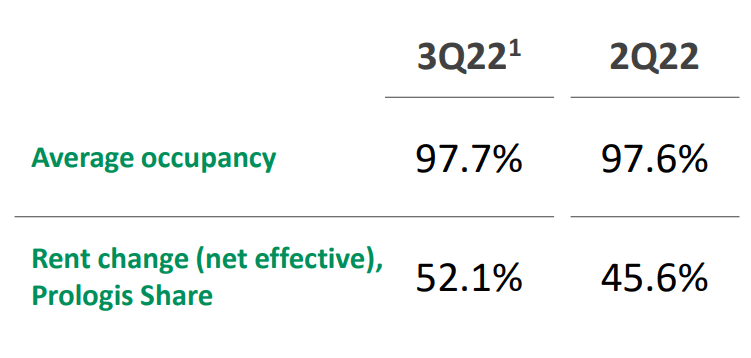
Prologis
Despite jacking up rents, PLD still grew occupancy. Industrial real estate remains in very high demand.
Dividends
The dividends are easily covered with AFFO per share. Coverage for TRNO looks weak, but that’s an issue with AFFO. AFFO is calculated using the current cash rents. When cash rents are dramatically below market rates, there is an enormous amount of growth coming to AFFO per share in the near future.
However, some investors argue that they would never buy a REIT when Treasury yields are higher. Would they make that decision about other stocks? Do they think they should just ignore the growth in cash flows? Probably. That’s why those investors kept losing money in mall REITs.
Neither dividends nor future share prices are guaranteed, but we can evaluate the expected future cash flows. These REITs have the kind of growth in cash flow that enables massive growth in dividends over time. As revenue and AFFO per share roars higher, prices trend higher also. Share prices are down in 2022, but revenue and AFFO growth continue.
Our goal here is to buy the REITs we think we will want to own a decade from now. If we can get a good price on those REITs, it’s a great time to build the position.
Building Positions
Here are all of our open equity REIT positions with color coding for the type of REIT:
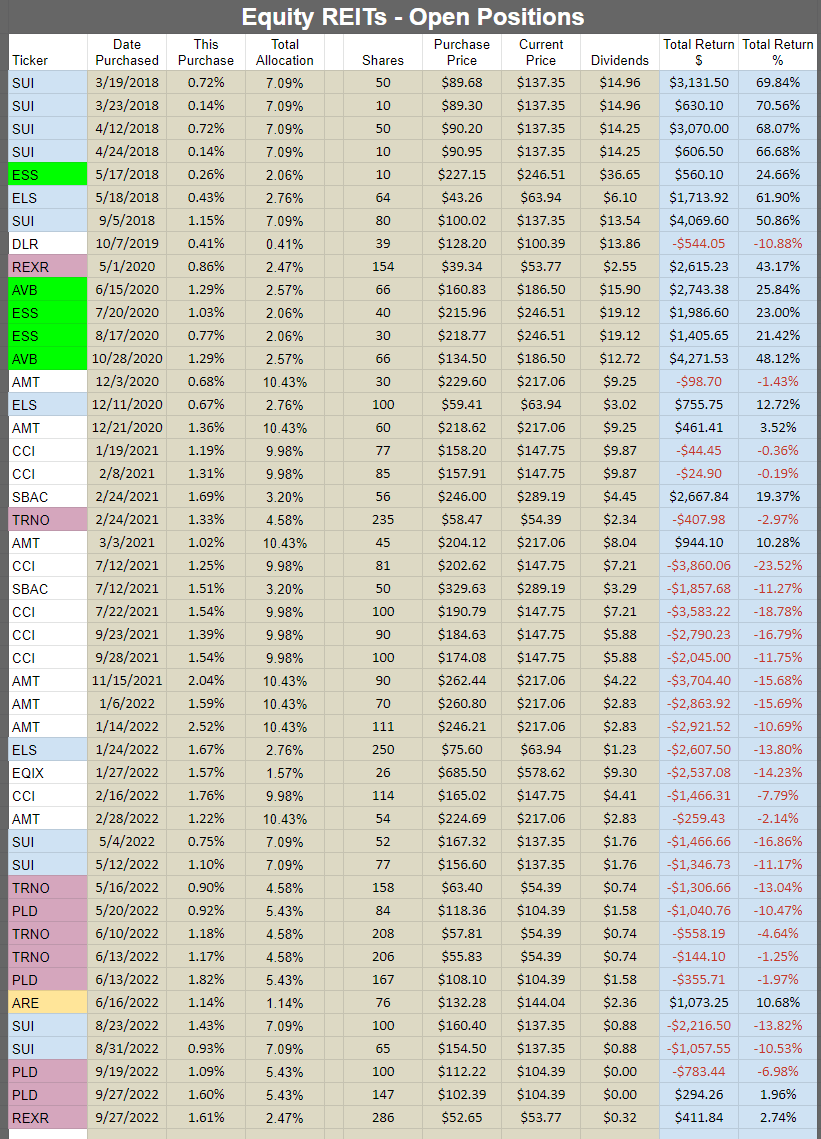
The REIT Forum
The types are as follows:
- Maroon: Industrial
- Blue: Manufactured Home Park
- Green: Apartment
- White: Towers & Data Centers
- Tan: Biotech
Try to beat that transparency. The chart doesn’t include mortgage REITs or preferred shares because it is explicitly equity REITs.
You can see that we bought industrial REITs several times. Since 5/15/2022, we spent over $102,000 buying industrial REITs.
Since some people just close losing positions, we also chart all of our closed positions.
Here are the closed positions through the start of 2019:

The REIT Forum
Here are the positions closed since then:

The REIT Forum
Only a few losses in there. Most came from speculating with mall REITs. Needless to say, I revised my strategy to include “don’t own mall REITs” and cut them from coverage. Brilliant! We’re focusing our equity REIT research on REITs that deliver solid growth in AFFO per share.
Conclusion
These industrial REITs are a great deal. Industrial real estate is wonderful due to rapidly rising rental rates. Most of the REITs (including all three we mentioned here) have excellent balance sheets. That strength makes it easier to withstand increasing interest rates and an economy falling into recession. These valuations are a gift from the market, and I won’t turn up my nose. If we’re lucky enough for them to remain cheap, we can load up on even more during this rare sale.
When we started buying again on 5/16/2022, it was the first industrial REIT purchase in our portfolio since 2/24/2021. We sat by for over a year just biding our time so we could get a great deal on shares.
Ratings: Strong Buy on REXR, TRNO, and PLD
Be the first to comment