

Bitcoin (BTC/USD), Ethereum (ETH/USD) Forecast:
Tesla drives Bitcoin to Fresh Highs
Bitcoin prices continue to soar ensuing a $1.5 billion investment by electric car manufacturer Tesla. Although the digital currency has managed to maintain the upward trajectory that has prevailed since late last year, Bitcoin bulls have Tesla CEO Elon Musk to thank for the recent boost in price action after the announcement resulted in a 13% price increase, driving BTC/USD to another fresh all-time high. Now that Tesla is a constituent of the S&P 500, the prospects of the digital currency being used as an acceptable payment method in the foreseeable future by other market participants may further catalyze short-term price action, increasing the demand for Bitcoin and other major cryptocurrencies.

Recommended by Tammy Da Costa
Download Your free Bitcoin Trading Guide
Bitcoin (BTC/USD) Price Action
After breaking above $48,000 earlier today, price action retraced off of the key psychological level, falling to the 14.4% Fibonacci retracement level of the Jan – Feb move, currently providing support around $45,277. For now, bulls and bears may continue to battle it out, with $48,000 remaining as resistance. If bulls are able to push through resistance, a test of $50,000 may be in the cards, however, if bears break below current support, which may happen due to profit taking following a really strong move; then they may be able to drive prices back towards the 38.2% retracement level of $40,435.
Bitcoin (BTC/USD) 4 Hour Chart
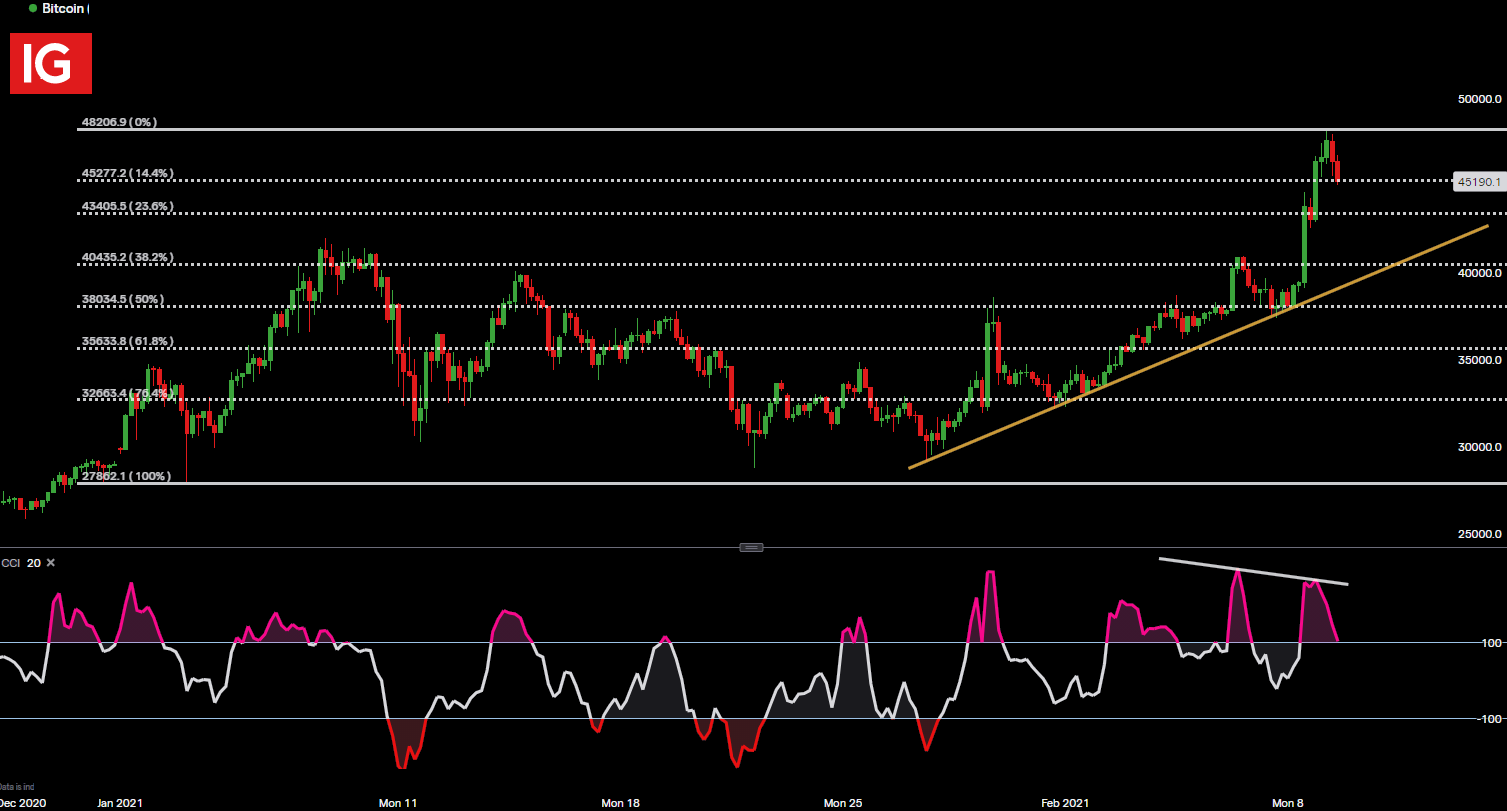
Chart prepared by Tammy Da Costa, IG
Ethereum(ETH/USD) Price Action
Much like the relationship between Silver and Gold, Ethereum continues to walk in Bitcoin’s shadow, despite advancing approximately 123% (YTD). Following the listing of Ethereum futures on the Chicago Mercantile Exchange (CME) over the weekend, bulls were able to drive price action to the key psychological level of $1,800 before the formation of a Doji candle indicated that the bullish momentum had come to halt, allowing for sellers to push prices back into a zone of confluency, existing between the upper and lower bounds of the rising channel.
| Change in | Longs | Shorts | OI |
| Daily | 2% | -5% | 2% |
| Weekly | 23% | -18% | 17% |
Meanwhile, the Commodity Channel Index (CCI) remains in oversold territory with divergence potentially suggesting that the uptrend may be losing steam.
Ether (ETH/USD) 4 Hour Chart
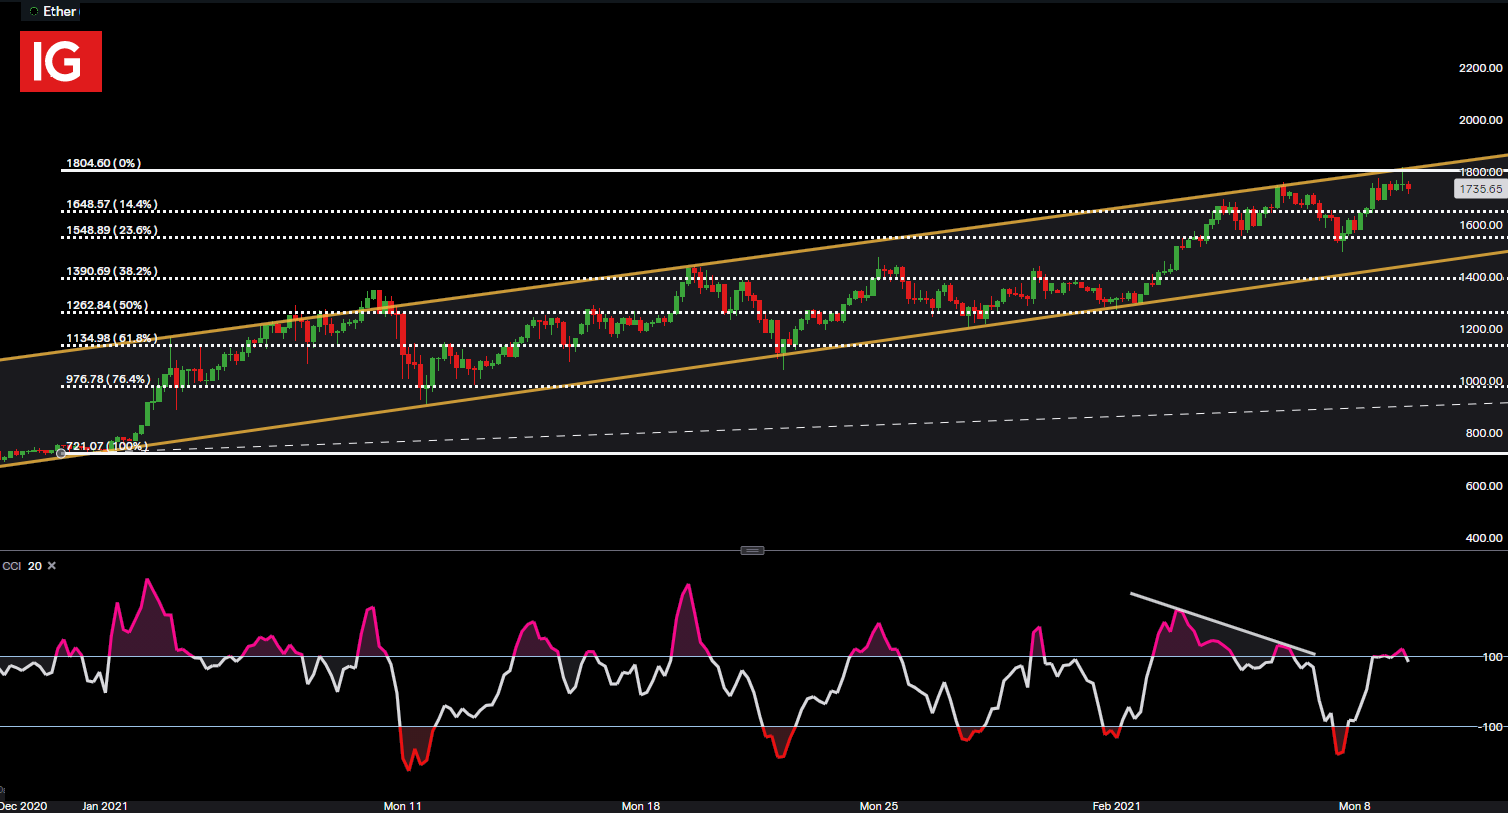
Chart prepared by Tammy Da Costa, IG
— Written by Tammy Da Costa, Market Writer for DailyFX.com
Contact and follow Tammy on Twitter: @Tams707
Be the first to comment