

Larry Busacca
Thesis
Our readers probably could easily tell that Ray Dalio has shaped our investment strategy to a large degree. As detailed in a series of blog articles:
In his mind (and ours too), the picking of specific stocks and the diversification across different stocks (or even sectors) is the LAST step of investing. The grand investing scheme starts with risk isolation, asset class allocation, geographical diversification, and consideration of macroscopic cycles. That is why both in our own accounts and in our marketplace service, our first step is always risk isolation using a barbell model. Then the second step is asset allocation across classes that respond differently to fundamental economic forces as shown in the chart below. Only after these steps, do other more detailed steps follow.
Source: macro-ops.com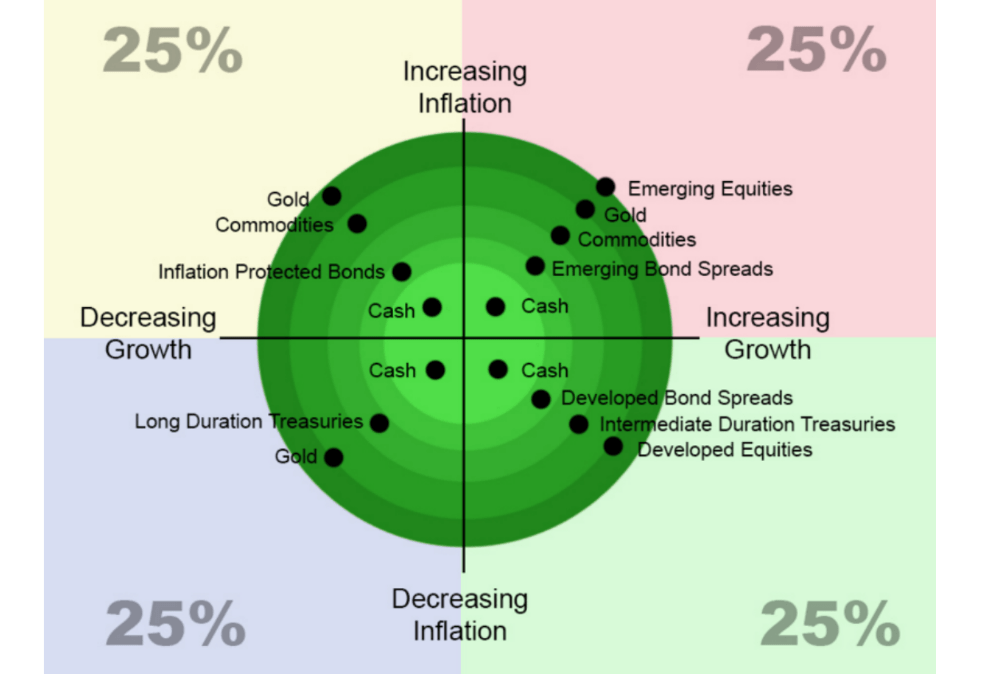
After risk isolation and asset allocation, today’s discussion will concentrate on the next two steps in Dalio’s grand investing scheme: the need for geographical diversity and the crucial importance of thinking in terms of macrocycles. And in particular, my thesis would focus on two overseas commodity stocks, BHP Group Limited (NYSE:BHP) and Rio Tinto Group (NYSE:RIO). And the reminder of the article will argue for a bull thesis for both of them based on the following key considerations:
- Both of them are well poised for healthy long-term gains driven by the new commodity cycle and their stable profitability
- Both are blessed with strong organic cash generation and both companies are at their strongest financial strengths in a decade and enjoy capital allocation flexibility. With the recovery in both ROIC (return on capital invested) and reinvestment rates, healthy long-term growth can be expected now.
BHP and RIO: Strong and Stable Profitability
The following graph provides a snapshot of their current profitability metrics. it always involves an element of subjectivity to compare profitability between these two similar stocks.
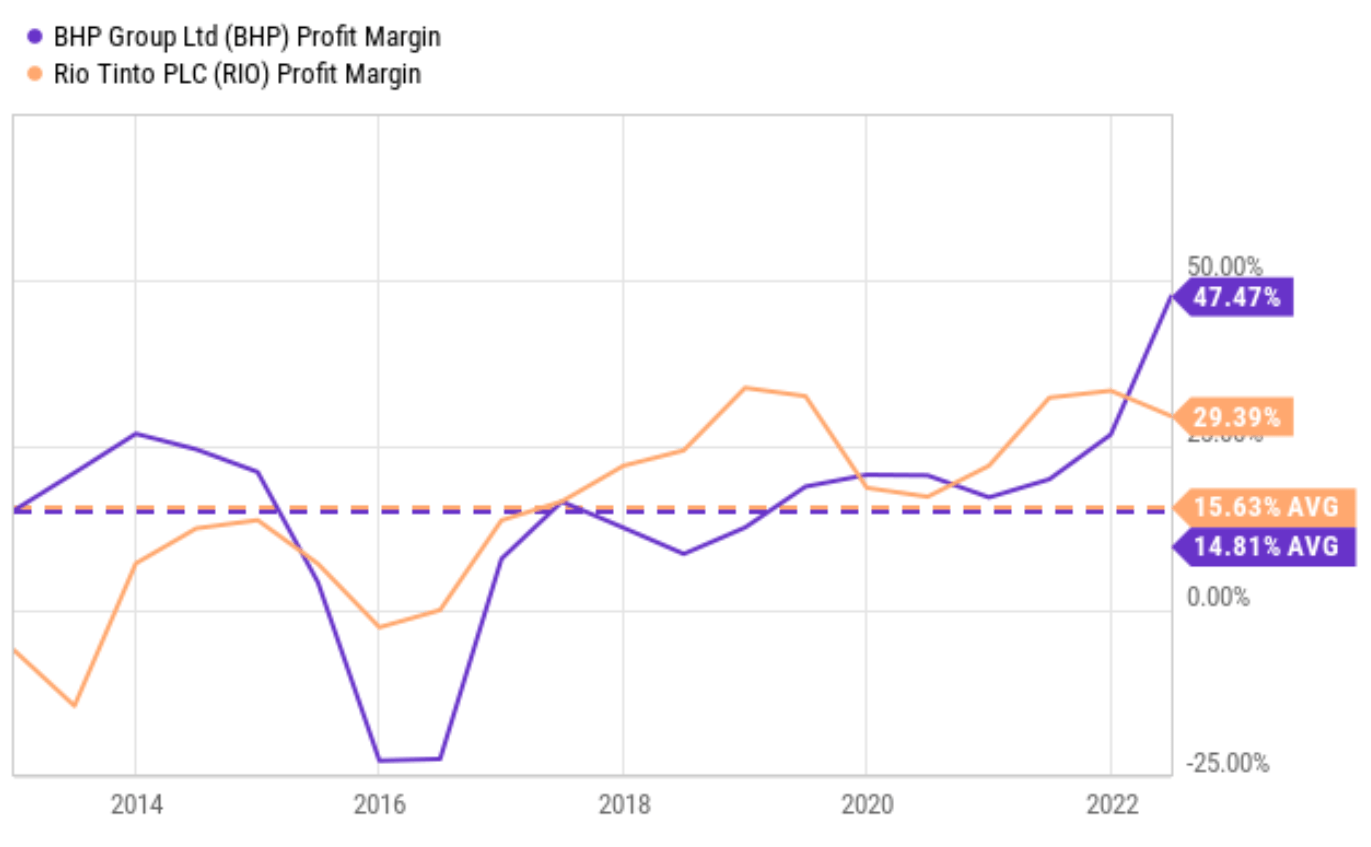
And my overall conclusion here is that their profitability is about equally strong. If there is an area one stock lags the other, it makes it up in another area. For instance, BHP has a higher gross margin of 85.7% than RIO’s 43.4% (almost double RIO’s, as a matter of fact). However, RIO more than made up for it with a net income margin that is essentially identical to BHP, as you can see from the second chart below. Admittedly, RIO’s current net margin of 29.4% is also substantially lower than BHP’s 47.2. But as the second chart shows, across the long term (say, across a business cycle), their net margins are approximately the same (15.6% for RIO vs 14.8% for BHP). Furthermore, despite the differences between them, their margins are both far superior to the overall economy. The profit margin for the entire economy varies between 8% and 10% historically. Hence, the current net profit margins of RIO and BHP are about 3x to 5x above the overall economy, and their long-term averages are about 1.5x to 2.0x about the overall economy.
Source: Seeking Alpha data Source: Seeking Alpha data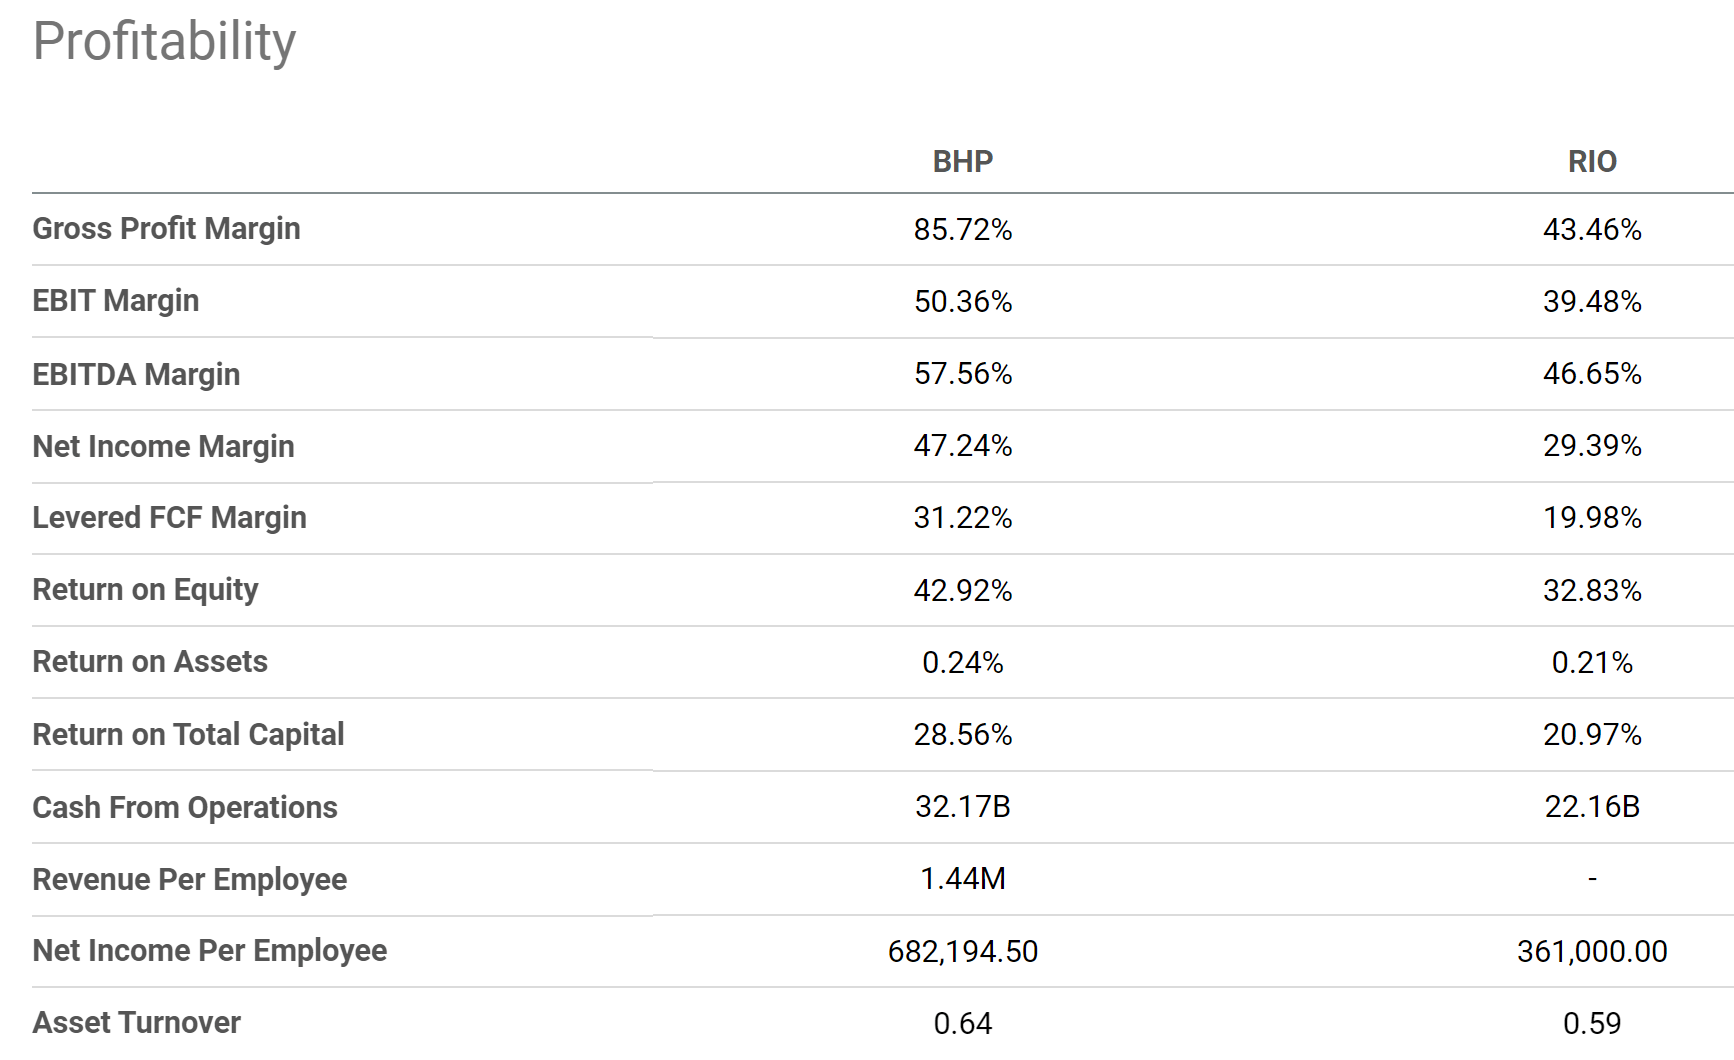
In addition to the above snapshot, The next chart also shows their ROCE (return on capital employed) over the past decade to provide a broader point of view. As explained in our earlier writings:
To us, ROCE is the most important profitability measure is ROCE because it considers the return of capital ACTUALLY employed. And the ROCE of BHP and RIO have tracked each other in lock-steps over the years because both correlate to commodities prices closely. In recent years, their average ROCE has been almost identical: around 27% for RIO and around 28% for BHP. Also, note that their average levels of ROCE are quite similar to their return on total capital shown above (21% for RIO and 28% for BHP), indicating that all their capital is currently efficiently employed, i.e., there is no idle capital.
Source: Author based on Seeking Alpha data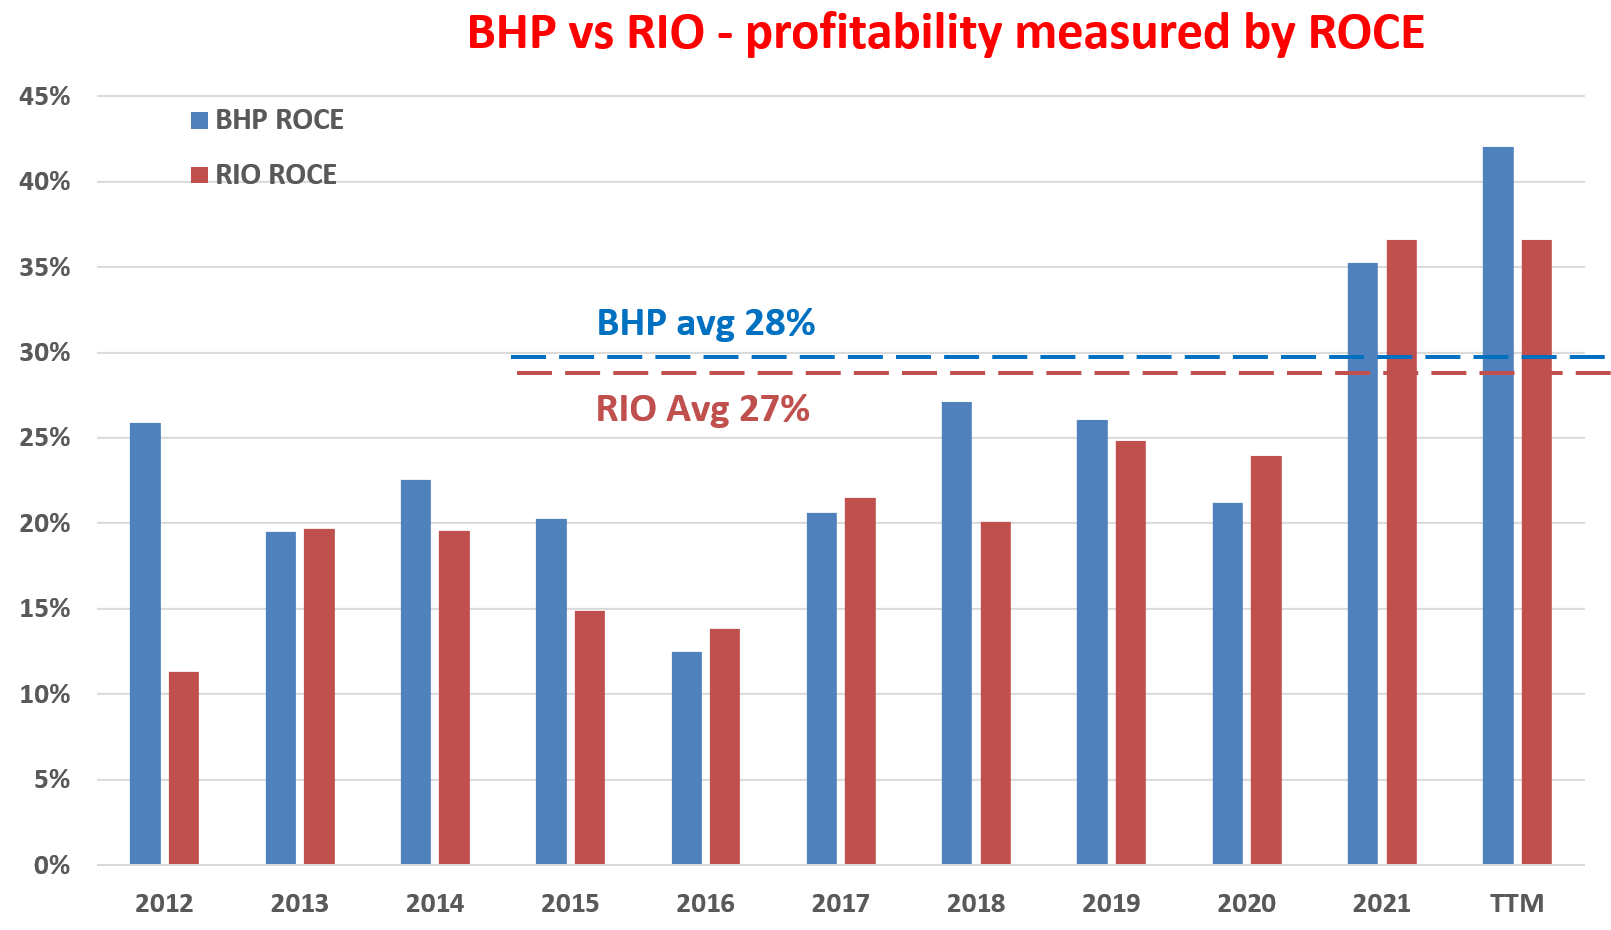
BHP and RIO: Strong balance sheet and capital allocation flexibility
The following comments from RIO’s CEO Jakob Stausholm in the recent earnings report (“ER”) are consistent with my above profitability analysis. These comments were abridged and the emphases were added by me. Note that he highlighted the 20%+ ROCE and also the observation that this current round of the commodity cycle is even strong than the last round. These comments apply to BHP equally well (if not better) and I anticipate these profitability headwinds to keep providing them with plenty of organic cash flow and capital allocation flexibility as to be elaborated next (emphasis added):
… Each of our 4 product groups were highly profitable, achieved significant EBITDA growth and double-digit return on capital employed and delivered strong free cash flow…. But we also benefited from an increased contribution from the other 3 product groups, not least aluminum that recorded 20% return on capital employed in the second half of 2021…. A highlight for me comes when you compare to base results with our performance during a similar period of strong demand and high commodity prices a decade ago.
Their balance sheets are near peak strength in a decade. As you can see from the following chart, Both have a large cash position on their ledger ($17.54 billion for BHP and $13.91 billion for RIO). These cash positions translate to $3.4 per share for BHP and $7.05 per share for RIO. And, as you will see in the next section, once their cash positions were considered, their valuations are even more attractive than on the surface.
In particular, RIO’s debt burden is also substantially lower than BHP’s ($12.86 total debt vs $18.24 billion for BHP). Also, RIO’s market cap is smaller than BHP’s ($86B market cap for RIO vs $125B for BHP as of this writing). As a result, RIO’s leverage becomes significantly lower than BHP’s across the board: its total debt-to-equity ratio of 22.5% is about 40% lower than BHP’s 37.4%. And its long-term debt to total capital ratio is about 16.3% only, again about 30% lower than BHP’s 22.79%.
Source: Seeking Alpha data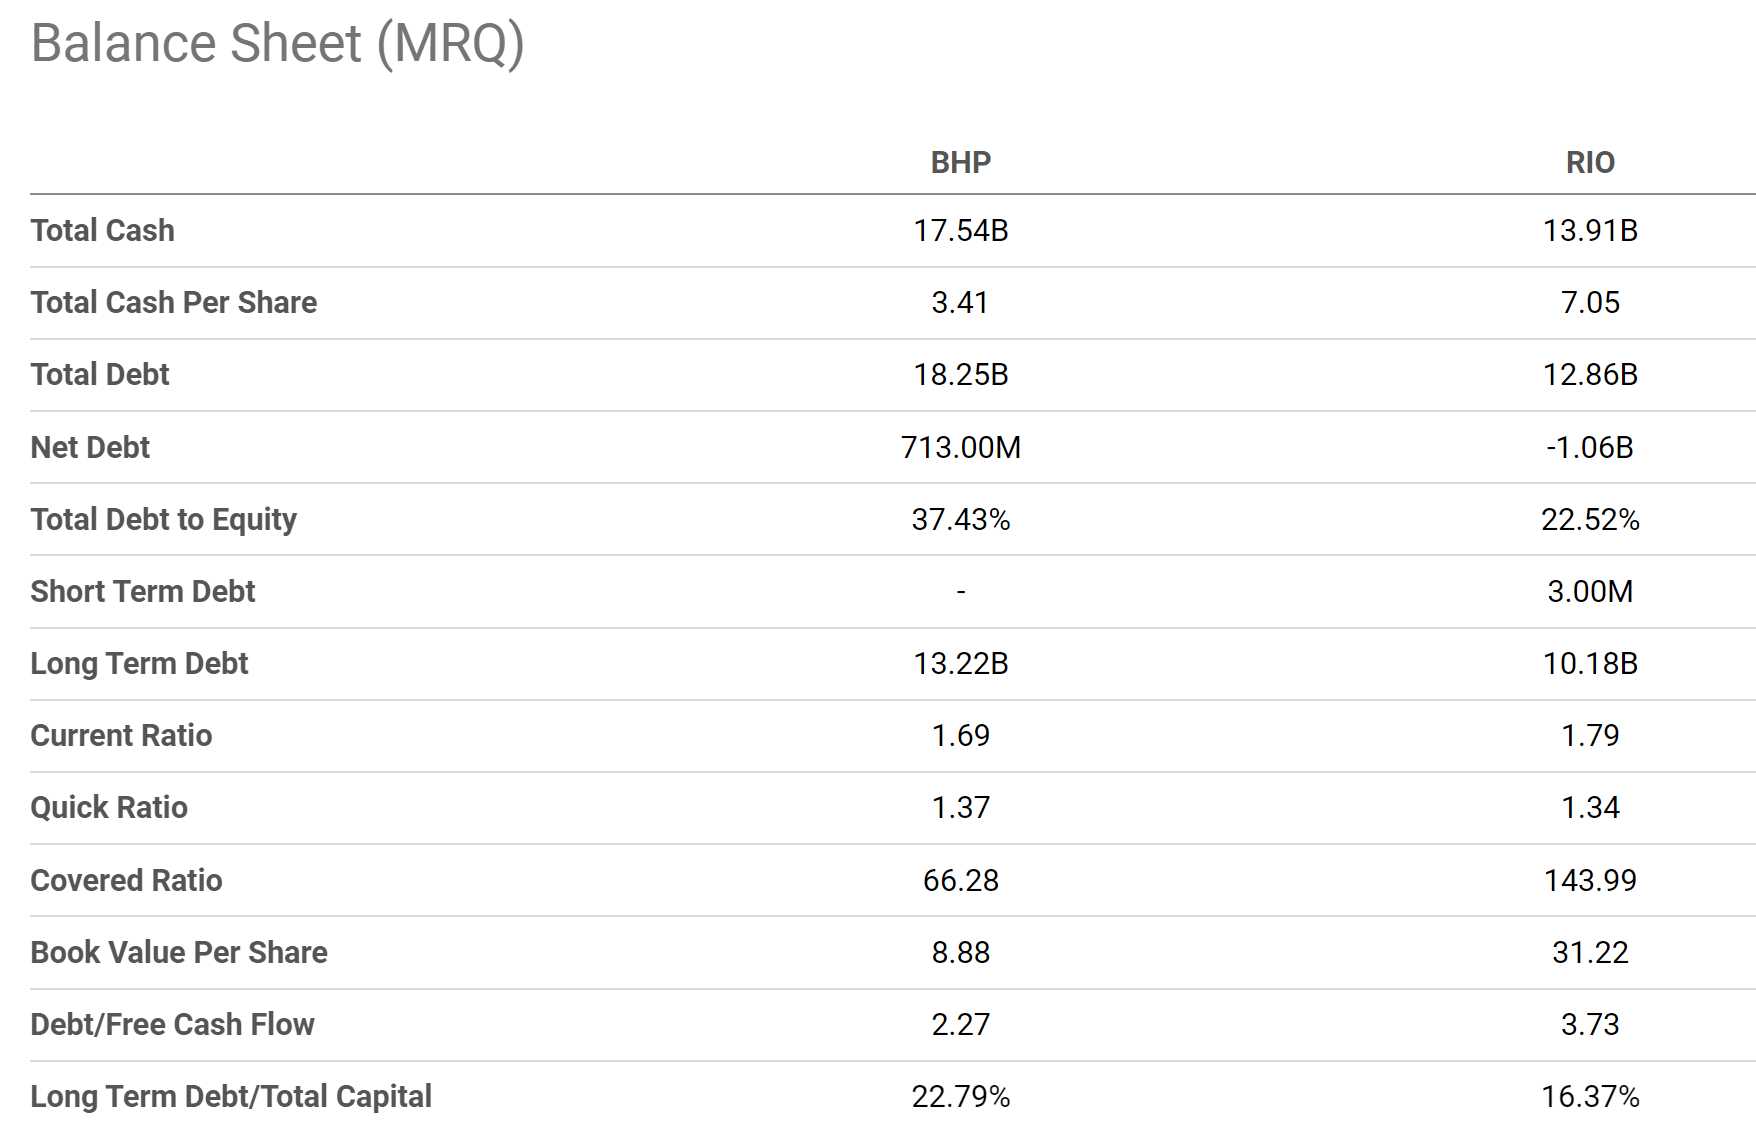
BHP and RIO’s valuations are both compressed
Despite almost identical profitability (measured both by long-term average margins and ROCE) and stronger financial strength as just analyzed, RIO is currently priced at a large discount compared to BHP as you can see from the following chart. RIO is trading at 5.76x FY1 P/E, compared to BHP’s 9.59x, a discount of 40%. In terms of topline metrics, RIO is trading at 1.68x EV/sales and BHP at 2.37x, a discount of 30%.
Source: Seeking Alpha data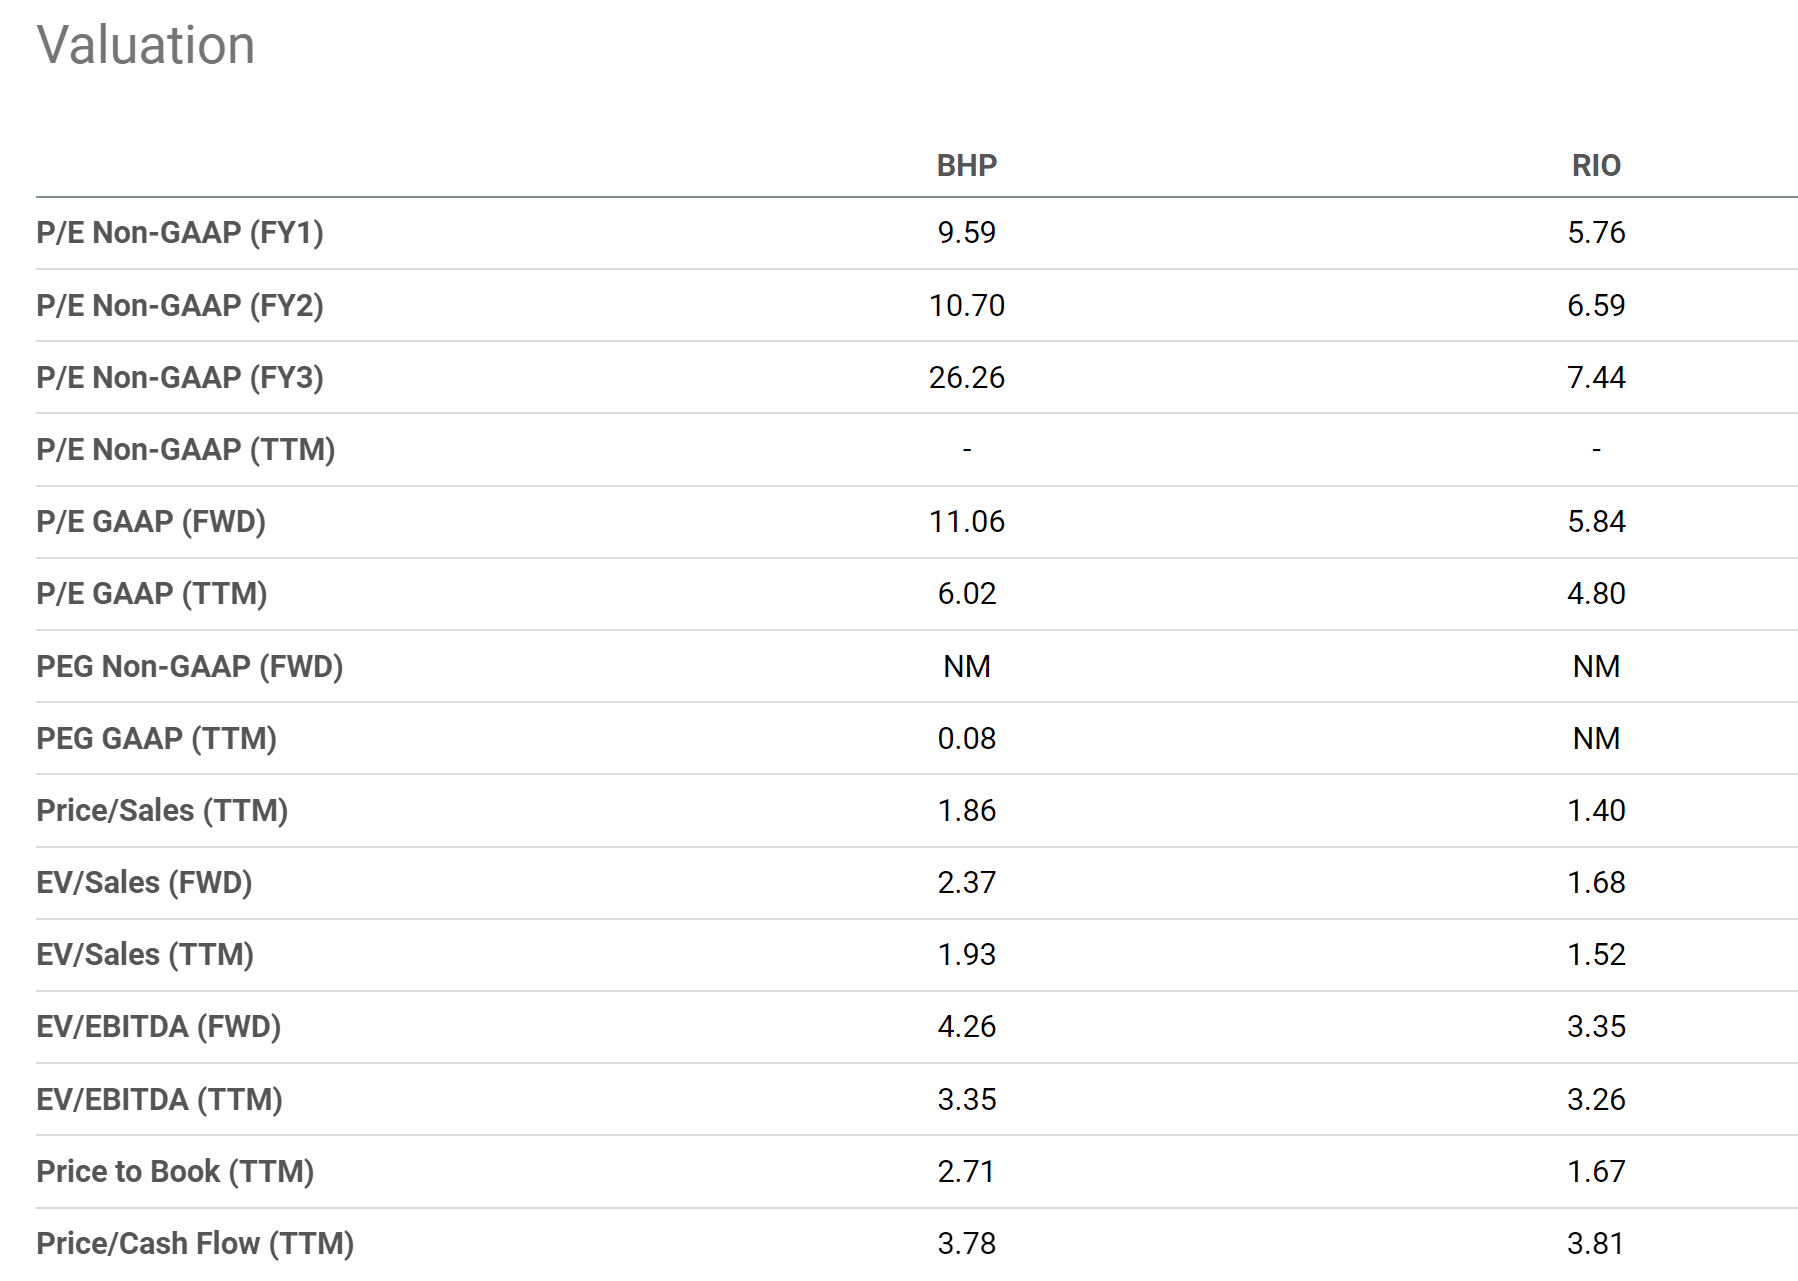
But let me clarify before I close this section: both stocks are attractively valued, it is just the valuation discount is large for RIO the way I see it. You can see the attractiveness of their evaluation simply by the dividend yields shown below. Currently, the dividend for BHP is 13.68%, near the peak level in a decade. To put things from a historical perspective, its dividend yield average is around 5.23% in the past decade. Therefore, its current dividend yield is more than 2x higher than its dividend yield. The picture for RIO is quite similar. RIO’s dividend yield average is 5.82% in the past decade. And its current 12.95% dividend yield is also more than 2x higher than its historical average.
Finally, recall that both of them sit on a sizeable cash position now. BHP’s cash position translates to $3.4 per share and RIO’s position translates to $7.05 per share. At their prices as of this writing ($47.5 for BHP and $52.8 for RIO), these cash positions represent 7.1% of the stocks for BHP and a whopping 13.3% for RIO. So when their cash positions are adjusted, their valuation would become even more attractive than on the surface.
Source: Seeking Alpha data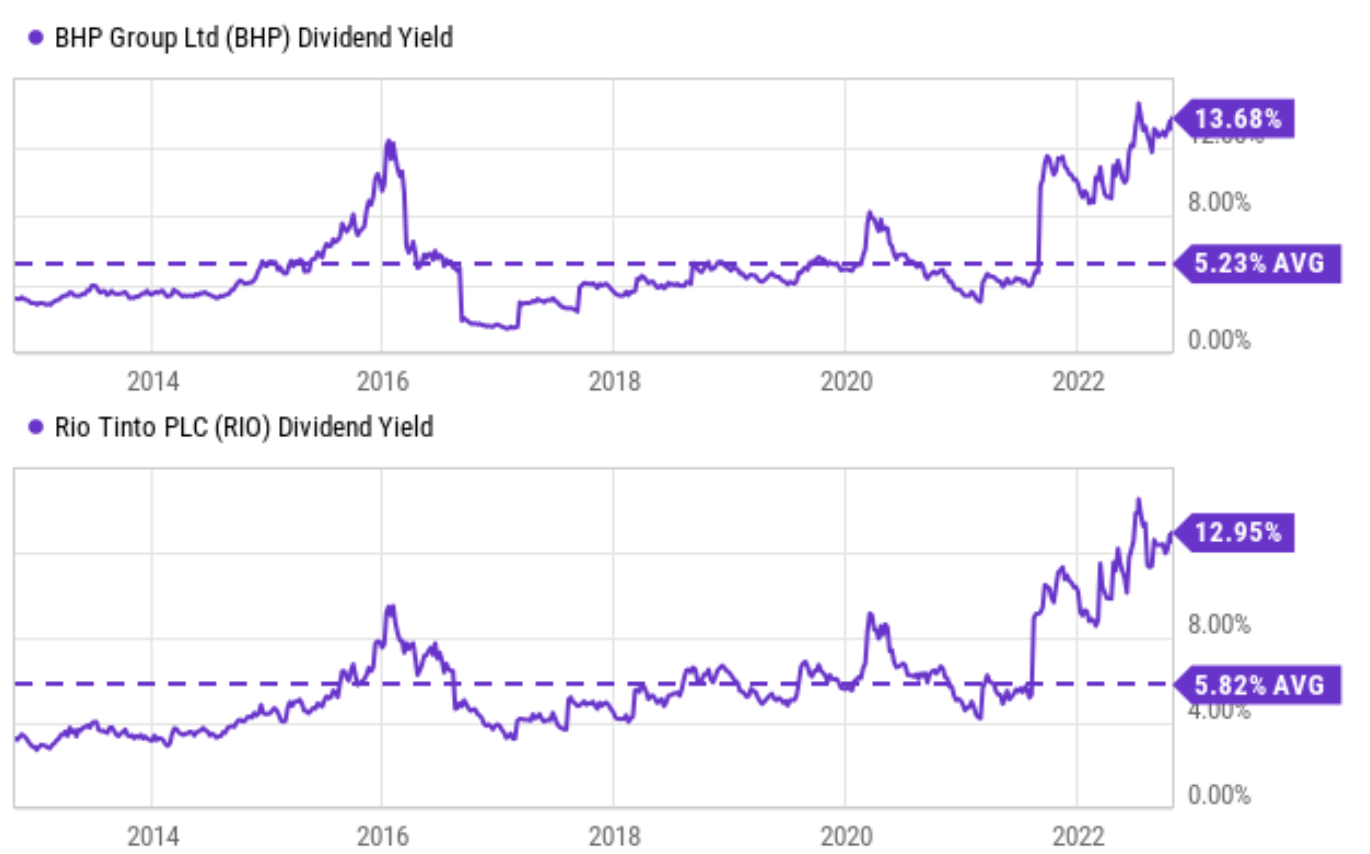
Risks and final thoughts
Both stock face largely the same risks. Both are under the pressure of inflation and rising costs due to higher fuel prices, labor shortages, and increasing borrowing costs. Furthermore, investing in commodities equities involves significant short-term price volatility. The price volatility of BHP and RIO has been considerably greater than that of commodities themselves, which is already quite high. You can see such extreme volatility just from their historical yields shown in the chart above. BHP’s dividend yields fluctuated from as low as about 2% to a peak of around 14%, by a whopping 7x fold. And RIO’s dividend yield fluctuated from about 3% to also a peak of around 14%, by a factor of more than 4x.
All told, commodity stocks such as BHP and RIO have been disfavored by the market in the past decade. Currently, I see both BHP and RIO’s valuations at a secular bottom judging by their record-high dividend yields and record-low PE multiples. Looking forward, I see double-digit annual return potentials as shown in the projections in the chart below. Their long-term returns would be supported by both the current high owners earning yield and healthy growth, thanks to a combination of valuation discount, stable profitability, and capital allocation flexibility as analyzed above.
Finally, going back to Ray Dalio’s thinking, as international companies, both BHP and RIO are less sensitive to (or could benefit from) the strengthening dollar. In contrast, a strong dollar acts as a headwind for U.S.-based multinational companies (like the FAAMG stocks).
Source: Author based on Seeking Alpha data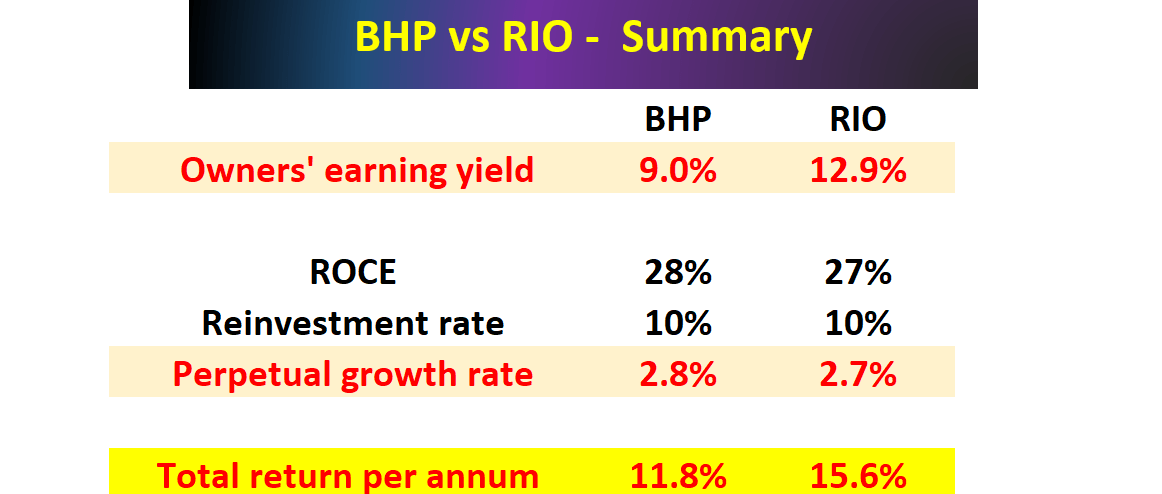
Be the first to comment