

Inna Dodor
Thesis
Many income investors are drawn to BHP Group (NYSE:BHP) and Rio Tinto (NYSE:RIO) for their generous dividends. Indeed, both have been paying mouthwatering dividends, on average above 5% in the past decade as you can see from the following chart. And particularly, during the past years, their dividend yields spiked close to 14% from a combination of record payout and stock price crashes.
Many investors (this one included) probably already know that such high yields cannot last. One of the following two things must happen to drive down the yield: either a dividend cut or a price rally. unfortunately, it was the former that has happened.
To wit, BHP announced a 25% dividend cut. Its semi-annual dividend is reduced from $4.00 per share a year ago to $3.00/share. And the cut is even more dramatic for RIO. It reduced its interim dividend to $2.67/share, less than half of its $5.61/share payout in the same period a year ago. The underlying reasons for such cuts at both firms include weakened ore prices, swings in energy prices, and also general inflation.
Looking forward, the top questions on many investors’ minds must be – should we expect another dividend cut? Indeed, their current payout ratios, even after the cuts, are higher than historical averages. After a holistic analysis beyond the normal payout ratio analysis, my answer hopefully will provide some relief. I see another cut extremely unlikely. The dividend cushions are at an extremely safe level after the cut.
Furthermore, you will see that their yields are at attractive levels even after the cut. Currently, RIO and BHP are yielding around 13% and 12.5%, respectively, on a TTM basis (i.e., without the cuts fully factored in). With the cuts fully factored in, RIO and BHP would be yielding around 8.65% and 10.9% on an FW basis, respectively. Such levels are still very attractive both in absolute and relative terms. They are about 2x higher than their historical averages of about 5%.
Author based on Seeking Alpha data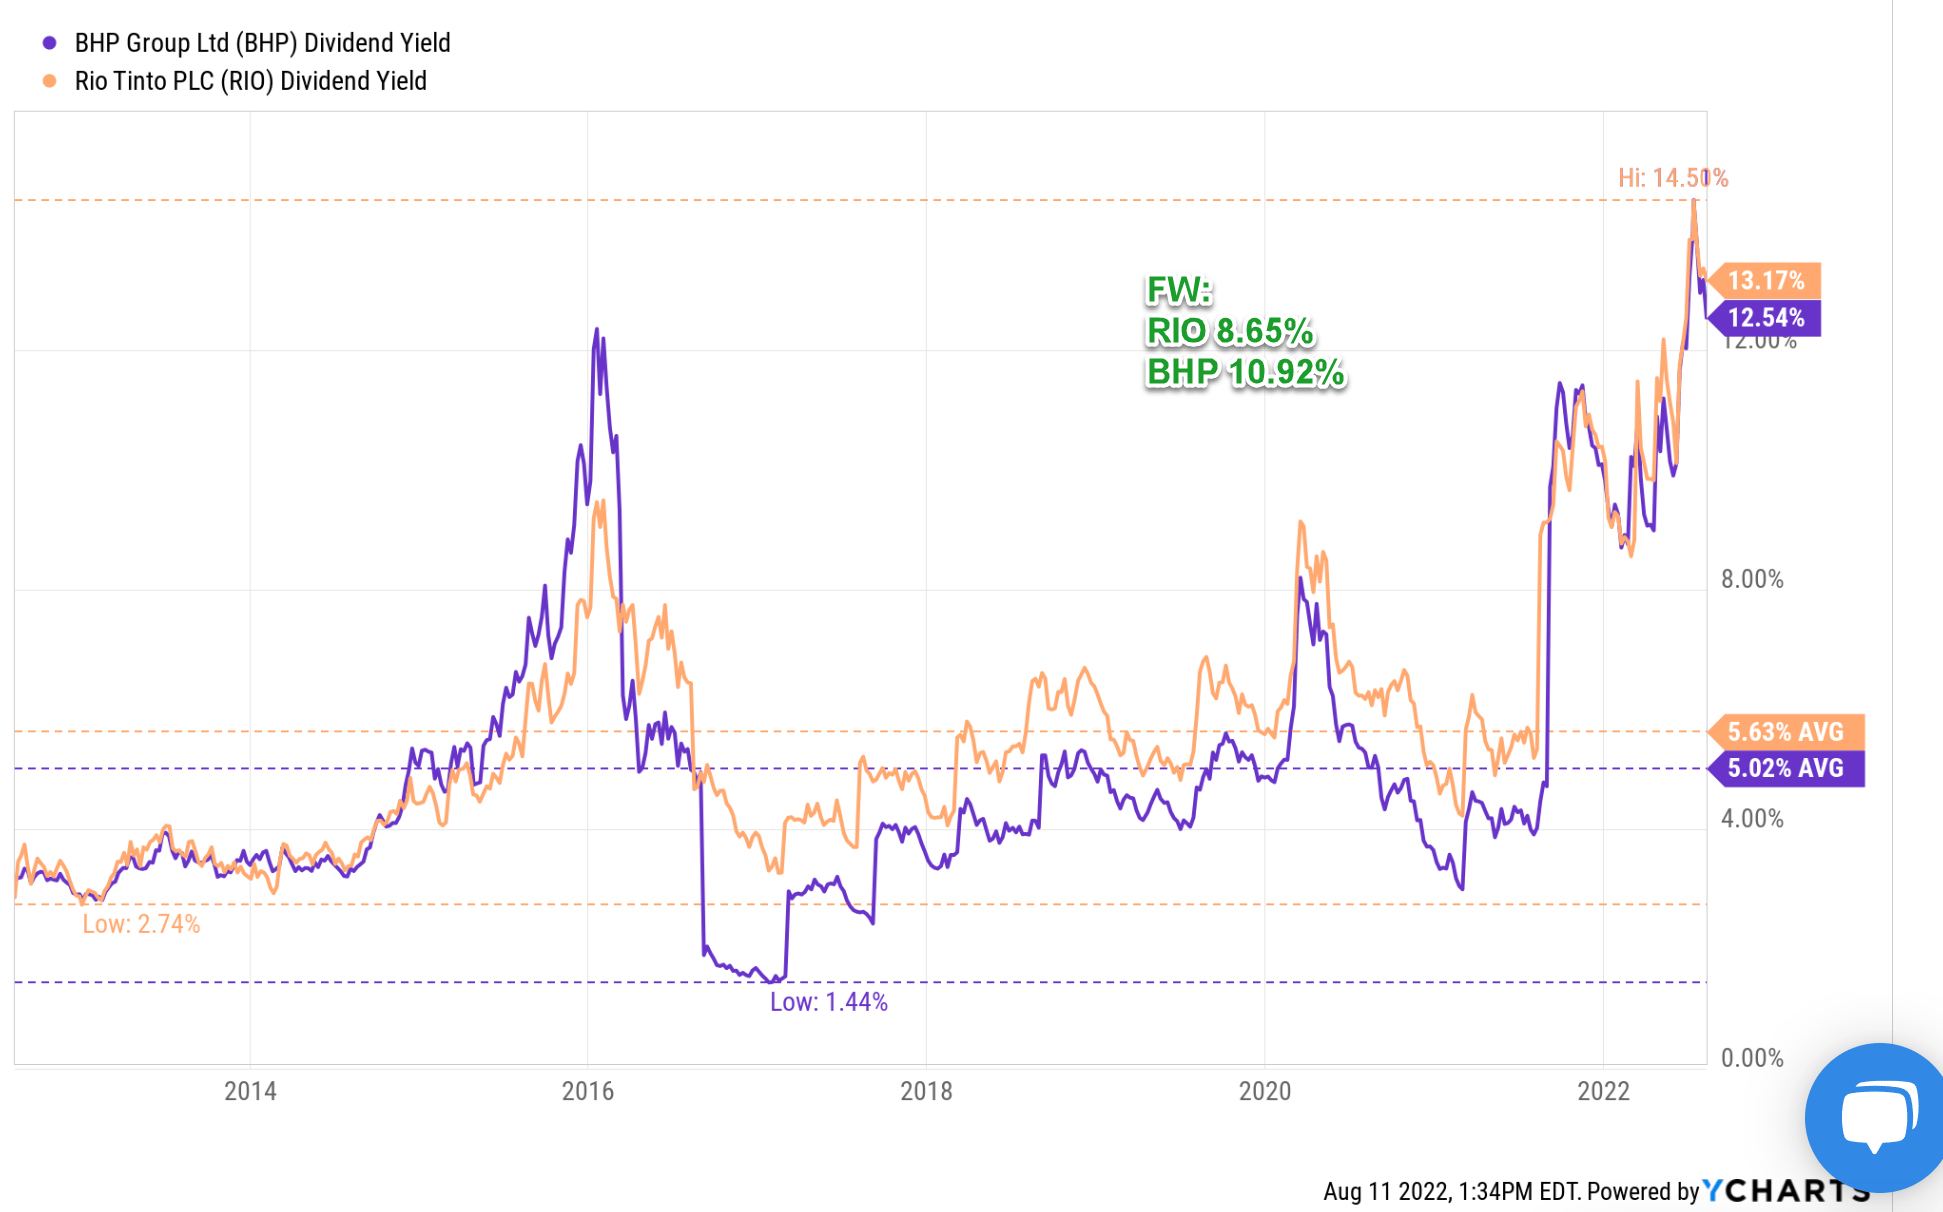
A reality check on profitability
Dividends, of course, are ultimately supported by profitability. So let’s first take a look at their return on invested capital (“ROIC”), which is a more comprehensive measure of profitability than margin as detailed in my free blog article here. As seen, their ROIC closely tracked each other because both are closely correlated with the same commodity prices. Their current ROICs are about the same here: 25% for RIO and 22.7% for BHP. And the difference is only about 2% or 8% in relative terms. And RIO’s long0-term average of 11.3% is also higher than BHP’s 7.7%. Although the key takeaway is that their current ROICs are both near the top level in a decade and I see no fundamental concern about their profitability.
Seeking Alpha data
Payout ratios are indeed above historical averages
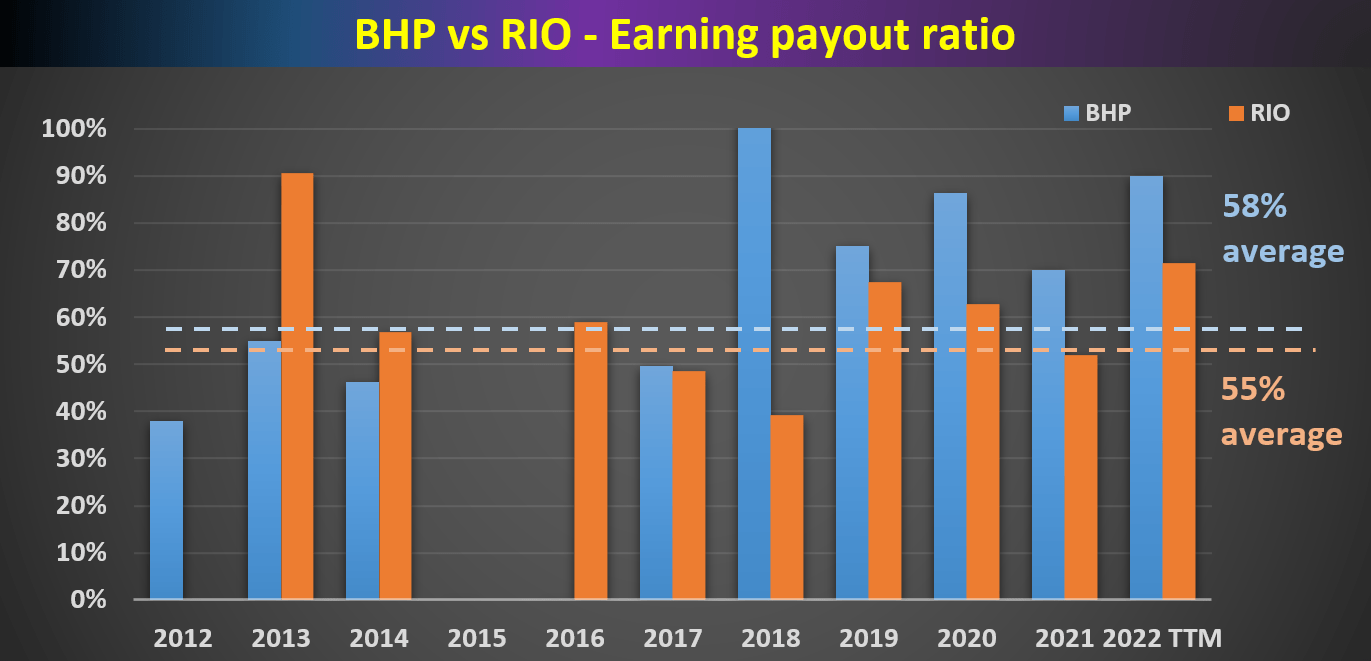
For dividend investors, I am sure all of us know all the typical metrics to gauge dividend safety such as payout ratio in terms of earnings, payout ratio in terms of cash flow, et al. The following chart shows BHP and RIO’s payout ratio in terms of cash flow and earnings. As seen, both BHP and RIO have been doing a quite consistent job of managing their dividend payout in the past despite the cyclicality of commodities prices.
Overall, the pictures here are very similar for RIO and BHP. In terms of cash payout ratios, they are both in the 30% to 40% range most of the time. BHP’s average has been 32%, slightly below RIO’s 37%. In terms of earnings payout ratio, their long terms averages are essentially identical with BHP at 58% and RIO at 55%.
And note that their current payout ratios are indeed higher than their historical averages by a good margin.
Author based on Seeking Alpha data Author based on Seeking Alpha data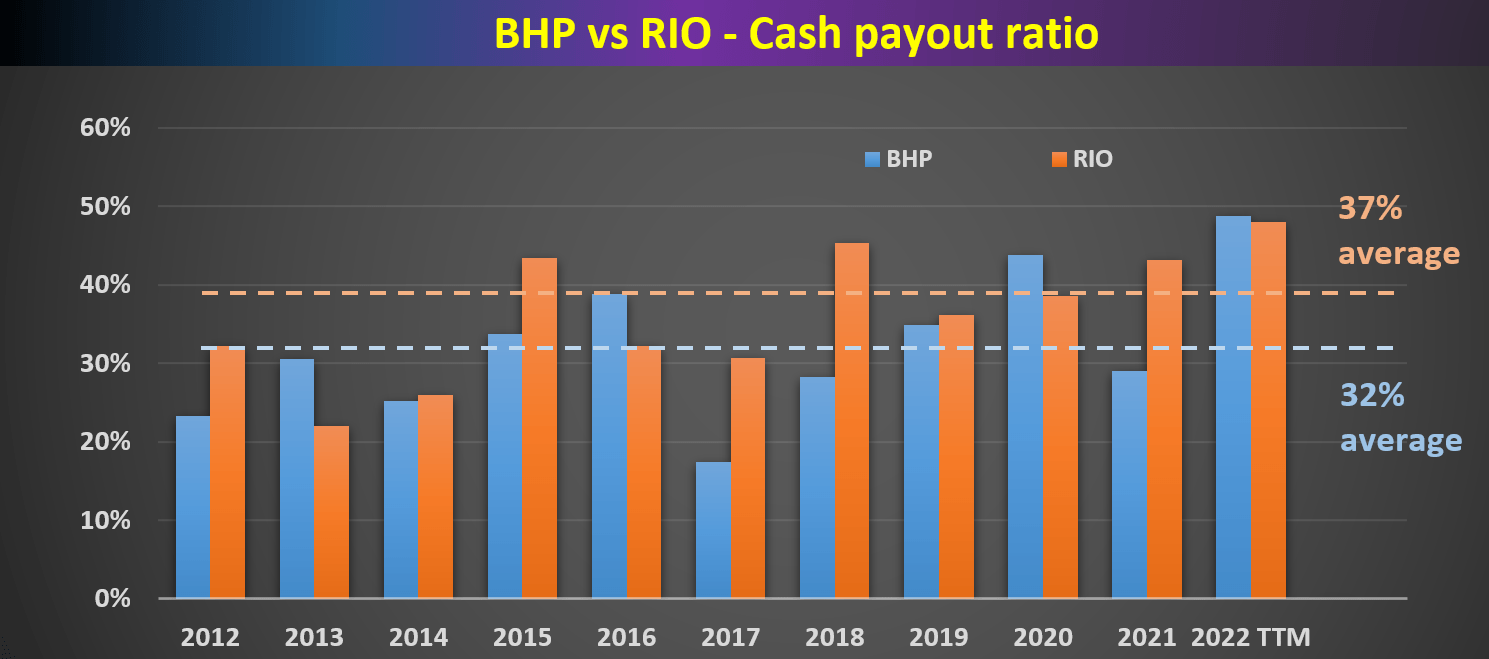
Dividend cushion ratios
As detailed in my earlier article here, the major limitations of the above simple payout ratios are twofold:
- The simple payout ratio ignores the current asset that a firm has on its balance sheet. Obviously, for two firms with the same earning power, the one with more cash sitting on its balance sheet should have a higher level of dividend safety.
- The simple payout ratio also ignores the upcoming financial obligations. Again, obviously, for two firms with the same earning power, the one with a lower level of obligations (pension, debt, CAPEX expenses, et al) should have a higher level of dividend safety.
The above simple payout ratios ignore all these important pieces. For a more advanced analysis of dividends stocks, we find the so-called dividend cushion ratio an effective tool. A detailed description of the concept can be found in Brian M Nelson’s book entitled Value Trap. And a brief summary is quoted below:
The Dividend Cushion measure is a ratio that sums the existing net cash (total cash less total long-term debt) a company has on hand (on its balance sheet) plus its expected future free cash flows (cash from operations less all capital expenditures) over the next five years and divides that sum by future expected cash dividends (including expected growth in them, where applicable) over the same time period. If the ratio is significantly above 1, the company generally has sufficient financial capacity to pay out its expected future dividends, by our estimates. The higher the ratio, the better, all else equal.
Note that our following analysis made one revision to the above method. Instead of subtracting the total long-term debt, we subtracted the total interest expenses over a past five-year period. The reason for this revision is to adjust the status of businesses such as RIO and BHP. Mature businesses like these probably will never have the need to repay all of their debt at once. But it does need to have enough earnings to service its debt (i.e., cover the interest expenses). With this background, the dividend cushion ratios for RIO and BHP are calculated and shown below.
As seen, both had very safe “cushions” in recent years, especially since 2017. As conservative investors, we ourselves use a cushion ratio of 1x as a threshold for “safe” dividends. A cushion ratio above 1 approximately means the business has 1 year of cushion time if its profits hit a major speed bump. Both RIO and BHP have had dividend cushion ratios above 1.5x since 2017. And their cushion ratios have been averaging about 2x in recent years, with BHP slightly higher at 2.05x and RIO at 1.93x. This approximately means that both businesses have enough cushion if their profits hit a major speed bump TWO years in a row.
You can also clearly see the negative impact in 2022 from the headwinds mentioned above (soften ore prices, energy costs, and general inflation). These headwinds have caused their cushion ratio to sharply decrease from 2021 to 2022. More specifically, the cushion ratio for BHP declined from a peak level of 2.68x in 2021 to 2.14x in 2022 on a TTM basis. And for RIO, the cushion ratio declined even more, from 2.11x in 2021 to 1.68 in 2022 on a TTM basis.
So, it is very understandable that management made the decision to cut dividends dramatically. It is the right move to manage the business cycles.
Looking forward, I see further cuts very unlikely based on the cushion ratio analyses too. As a hypothetical consideration, assume both of them maintain their H2 dividend at the same level as their H1 dividends. And remember, for RIO, the “reduced” H1 dividend that it paid ($4.3B) was still the company’s second highest interim payout ever. And for BHP, a $6/share annual payout already means a 10.9% yield as aforementioned. Anyway, under such a hypothetical scenario, BHP’s cushion ratio will return to 2.4x and RIO will return to 2.11x, back to being above their very safe historical averages.
Author based on Seeking Alpha data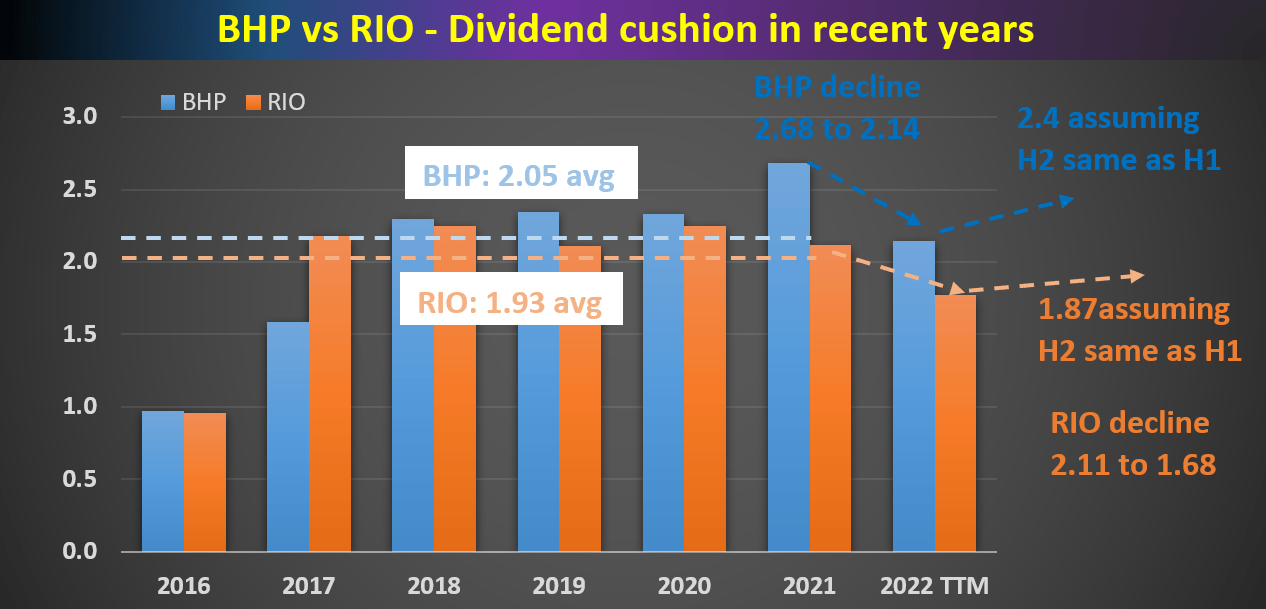
Final thoughts and risks
Both RIO and BHP have disappointing investors with dividend cuts. Although I see the cuts as the right move to manage the cyclical nature of their business in the long term. Furthermore, I see their dividend safety returns to their very safe historically averages after cuts, and I see further cuts as extremely unlikely. And finally, remember that their dividends are still at a very attractive level even after the cuts.
As one last thought, investors are always forward-looking (like what we are doing here). And the current valuation always tries to price in future developments. As a result, valuation always leads business fundamentals, especially in cyclical businesses such as RIO and BHP. As you can clearly see from the following chart, even though fundamentals are not that bad, their valuations already reached a multi-year bottom.
To be more specific, the price to cash flow ratios for both of them have fluctuated between about 3.8x and 11x in the past an average of around 6.8x to 7.1x. And you see can that their current multiples are only 4.4x for RIO and 4.5x for BHP, already close to the bottom in a decade.
Author based on Seeking Alpha data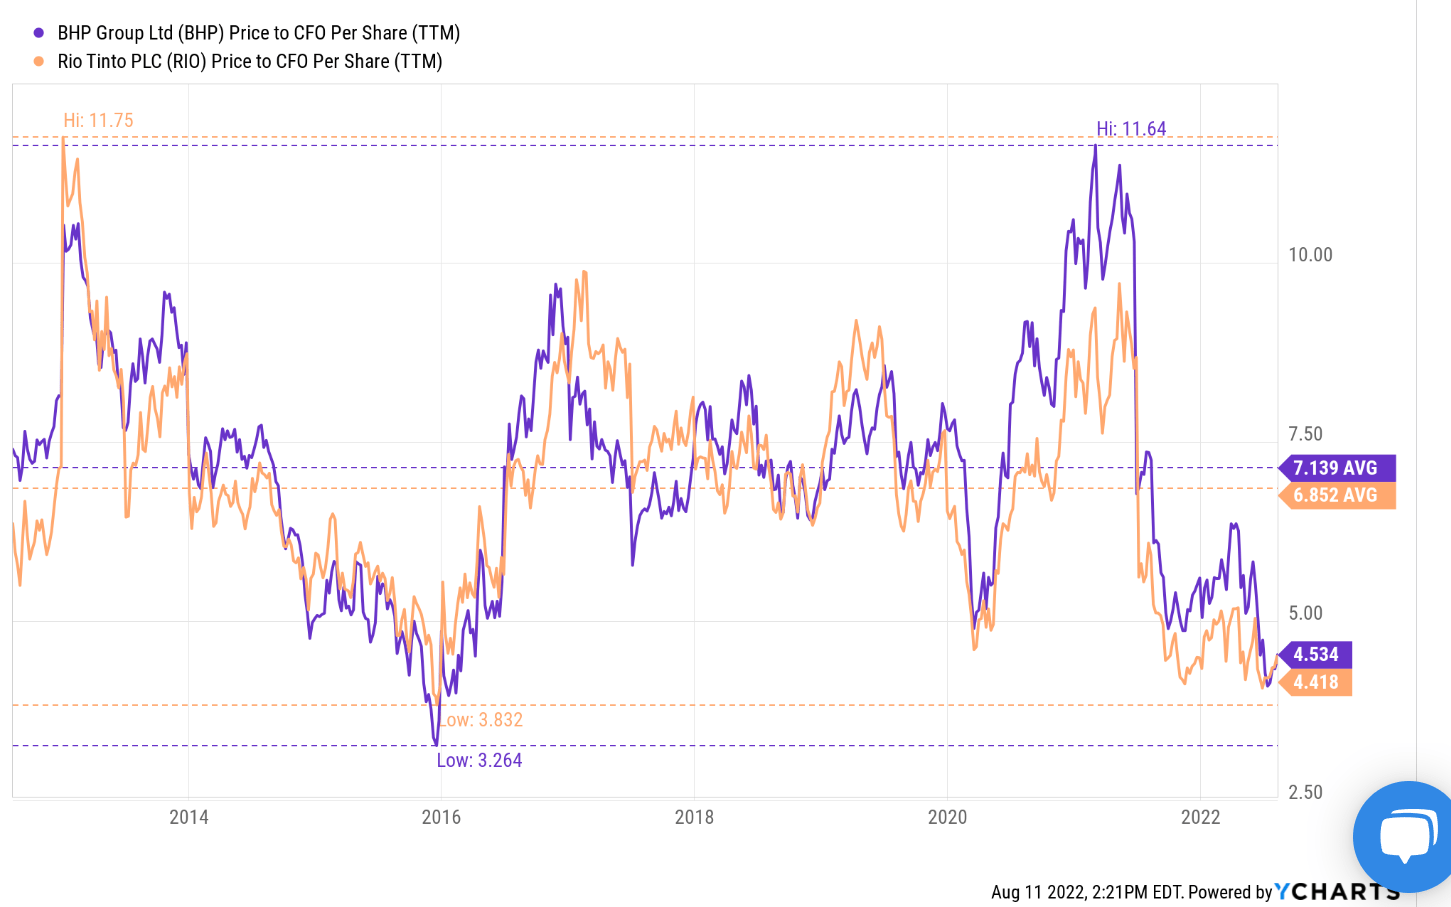
Finally, risks. With commodity stocks, investors do need a stronger nerve to tolerate short-term volatility risks. As seen in the chart above, their valuation multiple fluctuated by almost 4x in the past decade in terms of price/cash flow ratios. Especially for RIO, its beta in the past 24 months has been about 2x higher than BHP. Also note that comparatively speaking, RIO is also in a weaker financial position than BHP as reflected in its lower Altman Z-score (3.54 vs 4.42). Although both are financially strong under the overall scheme of things. As a general rule of thumb, for manufacturing businesses, an Altman Z-score above 3 indicates solid financial positioning (and close to zero signals nonnegligible bankruptcy risks).
Author based on Seeking Alpha data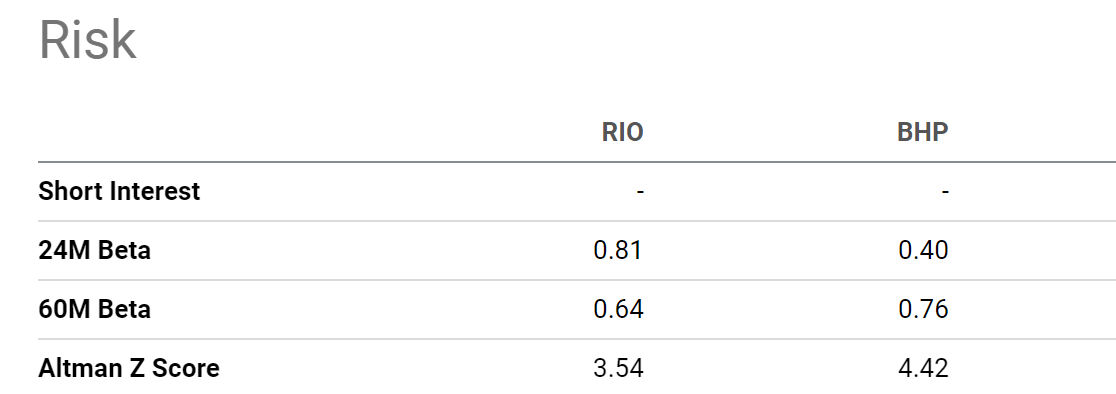
Be the first to comment