

adaask
Both Brookfield Infrastructure (NYSE:BIP) and Kinder Morgan (NYSE:KMI) are investment grade infrastructure businesses with attractive yields and dividend growth momentum. KMI offers a higher dividend yield, but BIP has a higher credit rating and is better diversified. In this article, we will compare them side by side and offer our take on which one is a better buy.
Brookfield Infrastructure Vs. Kinder Morgan – Balance Sheet
Both BIP (BBB+ with a stable outlook) and KMI (BBB with a stable outlook) have investment grade credit ratings which implies they both have solid balance sheets.
KMI has made progress recently towards deleveraging its balance sheet and is now poised to sport a leverage ratio below 4.3x at year-end. On top of that, it has $1.1 billion in cash on hand alongside a debt maturity schedule that is well-laddered. As a result, it enjoys its strong credit rating, which in turn gives it access to debt at attractive interest rates, keeping its cost of capital relatively low.
Meanwhile, BIP has significant liquidity of $2.8 billion at the corporate level along with a well-laddered debt profile and an average term to maturity of 8 years. 90% of its debt has fixed interest rates and no significant near-term maturities, putting it in strong position to weather the rising rate environment. That said, while BIP has very little debt (only 15.7% of its total net debt) at the corporate level, it is pretty heavily leveraged overall, with ~$19.4 billion in total debt. Given that analysts are forecasting ~$3 billion in EBITDA for the company this year, that puts the net debt to EBITDA ratio at a rather high ~6.5x. However, this leverage ratio is not as risky as it first appears since the vast majority of the debt is at the asset level with no recourse to the corporate level, the corporate level leverage ratio is a mere ~1x, and BIP also has A- rated parent Brookfield Asset Management (BAM) with its tens of billions of dollars in liquidity as a financial backstop should it somehow run into serious trouble.
Overall, we rate this comparison as a draw given that BIP has a superior credit rating, makes extensive use of lower risk non-recourse debt, and has BAM’s backing, but KMI has a much lower leverage ratio.
Brookfield Infrastructure Vs. Kinder Morgan – Business Model
KMI benefits from significant economies of scale and diversification within the midstream industry. It owns some of the very best natural gas infrastructure in North America, including the continent’s largest transmission network, CO2 transportation business, independent refined products transportation network, and independent terminal business. In fact, its scale is so large that the company is responsible for transporting roughly 40% of all U.S. consumed and exported natural gas.
KMI also generates very stable cash flows thanks to the fact that 97% of its cash flows stem from commodity price and/or volume resistant fixed-fee take-or-pay contracts. It also benefits from inflation-linked escalators on many its contracts.
That said, BIP benefits from significant diversification beyond the midstream industry. In recent years, BIP has invested increasingly aggressively in midstream assets in an effort to take advantage of the value in the sector, but it still generates the majority of its adjusted EBITDA elsewhere. Note in the table below, that the first two columns are a comparison of its three months ended June 30 in 2022 and 2021, respectively, while its latter two columns are a comparison of its six months ended June 30 in 2022 and 2021, respectively:
BIP Adj. EBITDA (Q2 Investor Presentation)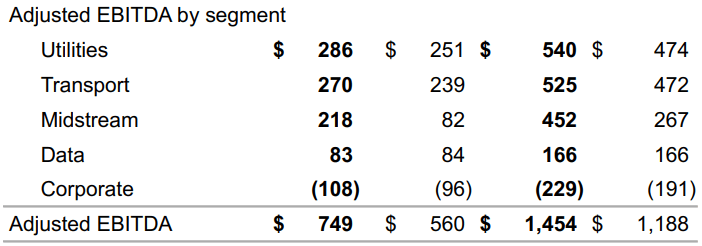
Its assets are also very well diversified by geography with a presence in North America, South America, Europe, Asia, and Australia. Its utilities assets are regulated or contracted and generate very stable, recession and inflation resistant cash flows for the business. Its transportation business owns and operates railroads, toll roads, and terminals and export facilities. Its midstream business is primarily natural gas and NGL focused with transmission, gathering, storage, processing, and conventional and long-haul pipelines. It also owns a petrochemical complex. Finally, its data business consists of 164,700 operational telecom towers and active rooftop sites, 22,000 kilometers of fiber optic cable, and 52 data centers. BIP also appears to be entering the technology sector, recently signing an agreement to invest up to $15 billion in part ownership of one of Intel’s (INTC) semiconductor fabrication facilities.
Another big positive for BIP is that it aggressively implements opportunistic capital recycling, taking advantage of its impressive deal flow as a subsidiary of BAM, one of the world’s largest alternative asset managers. It typically buys quality, but underperforming or distressed assets on a value basis, improves the balance sheet and/or operational efficiencies, and then sells the asset at an impressive IRR, only to restart the process over again. This is a unique, alpha-generating approach that delivers considerable long-term outperformance for the equity investors and more than compensates for the hefty management fees paid to BAM.
While KMI certainly has a solid business model, BIP’s superior geographic and industry diversification, superior deal flow from its relationship with BAM, and alpha-generating capital recycling strategy prompt us to give it the advantage in this comparison.
Brookfield Infrastructure Vs. Kinder Morgan – Dividend Safety
Both businesses have solid dividend/distribution coverage. BIP measures its distribution coverage ratio with FFO and AFFO. Its FFO payout ratio in 2021 was 73%, while its AFFO payout ratio was 89%. While this is pretty safe, it is slightly above management’s target payout ratio range of 60%-70%, so BIP may have to grow its distribution at a reduced rate moving forward in order to get its payout ratio back within its target range, especially if growth slows in the face of a recession.
KMI’s dividend safety is extremely strong, as its 2021 distributable cash flow coverage ratio was 2.22x, good for a mere 45% payout ratio. As a result, we give the payout safety advantage to KMI, though neither payout is in particular danger of being cut.
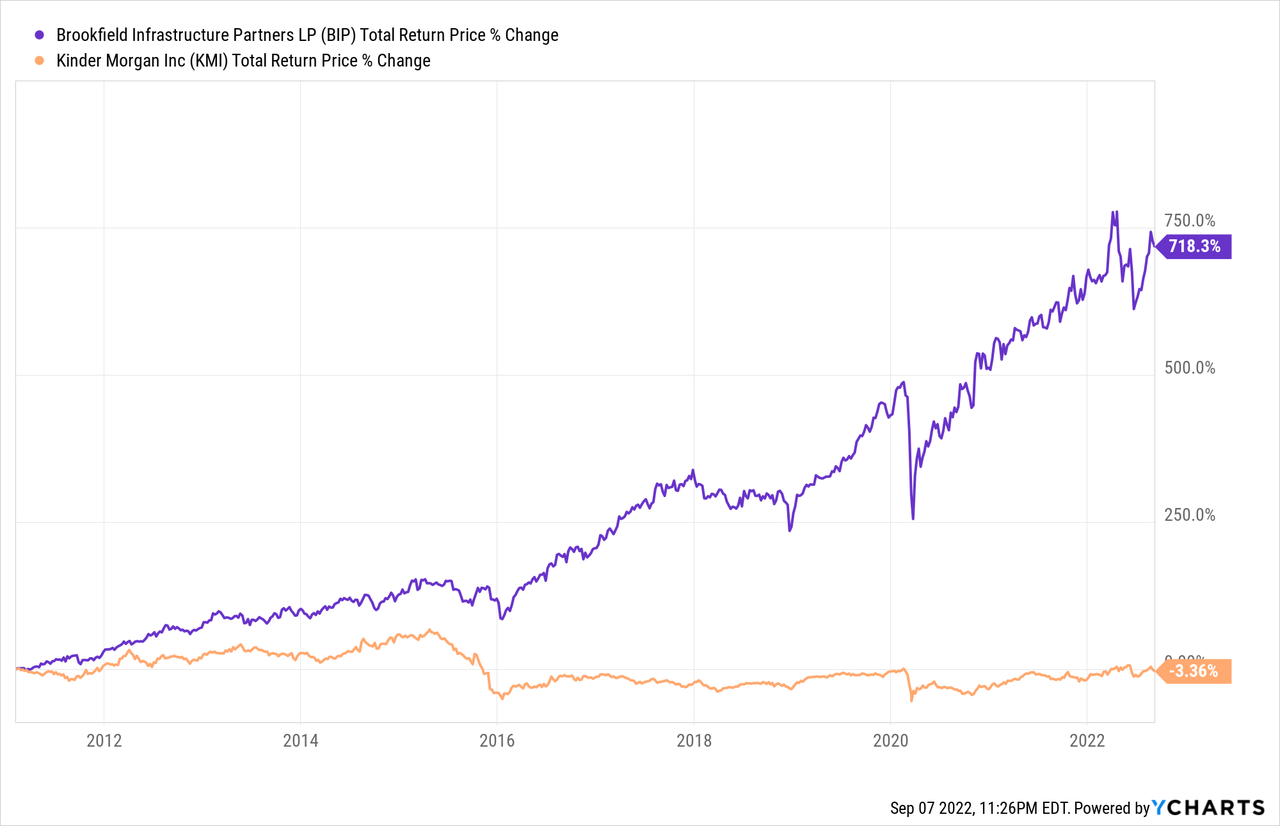
Brookfield Infrastructure Vs. Kinder Morgan – Track Record
When it comes to track record, BIP crushes KMI. It isn’t even close:
Brookfield Infrastructure Vs. Kinder Morgan – Risks And Catalysts
KMI is largely sensitive to the future prospects of the North American natural gas industry as it is largely focused on providing midstream infrastructure for North American natural gas. At the same time, the conservative structure of its contracts means that it is insulated in the short to medium term against the dramatic volatility that is prevalent in the industry. Furthermore, the inflation related escalators on many of its contracts puts it in position to benefit from the current inflationary environment.
BIP is much more diversified than KMI and is instead more of a play on global infrastructure in general. While this mitigates some of the risks, it also means that BIP is at least somewhat exposed to foreign exchange rate volatility (though it hedges this to some extent). It also means that BIP is more impacted by macroeconomic directions rather than purely the state of the natural gas industry, as is the case with KMI. BIP also has a significant portion of its cash flow coming from contracts with inflation linked escalators attached, so it is also a beneficiary of inflation.
Brookfield Infrastructure Vs. Kinder Morgan – Valuation
When it comes to their relative valuations, KMI looks clearly cheaper across each of the following valuation metrics. Its dividend yield is significantly higher, and its EV/EBITDA multiple is far cheaper than BIP’s. As a result, we give a decisive win to KMI here.
|
Valuation Metric |
BIP |
KMI |
|
Dividend Yield |
3.63% |
6.36% |
|
Dividend Yield (5-Yr Avg) |
4.32% |
5.99% |
|
EV/EBITDA |
22.33x |
9.64x |
|
EV/EBITDA (5-Yr Avg) |
20.82x |
10.29x |
Investor Takeaway
Both businesses have rock solid investment grade balance sheets with plenty of liquidity, their payouts are safe, and their business models churn out stable cash flows. The main differences here are that BIP is a diversified play on global infrastructure, whereas KMI is a concentrated bet on North American natural gas infrastructure, BIP’s track record totally crushes KMI’s, and KMI’s valuation is vastly cheaper than BIP’s.
While BIP’s vastly superior track record and backing from BAM should not be discounted, its valuation is extremely steep at 22.33x EBITDA. By investing in more focused and specialized operators within each of its individual sectors, investors can get exposure to similar infrastructure assets but at significantly cheaper valuations. Yes, you will not get the same deal flow nor capital recycling that BAM provides BIP access to, but investors will still get better risk-adjusted exposure to global infrastructure in our view.
Meanwhile, KMI appears to be attractively priced at the moment. Therefore, we rate KMI a Buy and BIP a Hold.
As a final note: KMI issues a 1099 tax form, whereas BIP issues a K1 tax form. For investors who wish to invest in BIP but avoid the K1 tax form, there is an economic equivalent C-Corp (BIPC) that issues a 1099 instead, though it currently trades at a massive premium to BIP.
Be the first to comment