

adaask
Both ONEOK (NYSE:OKE) and Kinder Morgan (NYSE:KMI) are investment grade high yield midstream businesses that pay out the same 6.3% dividend yield at present. In this article, we will compare them side by side and offer our take on which one is a better buy.
ONEOK Vs. Kinder Morgan – Balance Sheet
Both OKE and KMI enjoy the same investment grade credit rating (BBB) from S&P which is evidence that their balance sheets are quite strong right now.
KMI is set to end the year with a leverage ratio below 4.3x and already has a leverage ratio that is slightly below 4.5x (which is its target level). On top of that, they have $4 billion in revolver capacity along with a considerable amount of cash on hand along with a well-laddered debt maturity schedule. An interesting thing to note about KMI, however, is that they have $7.5 billion in floating rate debt, which amounts to over 10% of their total enterprise value and about 23% of their total net debt. Management explained their reasoning for having so much floating rate debt heading into 2023 on the latest earnings call:
we will have $7.5 billion of floating in ’23 and we have not hedged any going into next year. And right now, we don’t think that’s a good opportunity to be able to hedge that. In terms of our policy on floating, the reason that we have the policy on floating is because we have looked over long periods of time, and it looks like that the forward curve over-predicts where floating rate debt is going to trade. And so, we want to take advantage of that. And so that means that some years, we are going to pay more. In some years, we are going to pay less, and we are going to pay less for more dollars, right. So, it ends up being a net present value positive trade for us. And so, our policy is not going to change because in 1 year, we have to pay higher interest rates.
Management said they are comfortable operating at 4.5x leverage, though they would like to bring it a bit lower in order to provide greater flexibility for opportunistic share repurchases and acquisitions.
OKE, meanwhile, is also working to reduce its leverage ratio from its current 3.8x level to its long-term target range of 3.5x or lower. That said, given the high quality of its assets and its focus on natural gas, its leverage ratio is already pretty good, so there is little to no concern for financial distress at OKE.
Overall, we rate this category comparison a draw as both have BBB credit ratings, and both are in very solid financial shape.
ONEOK Vs. Kinder Morgan – Business Model
KMI benefits from significant scale and diversification as it owns:
- the largest natural gas transmission network in North America
- the largest CO2 transportation business in North America
- the largest independent refined products transportation network in North America
- the largest independent terminal operation in North America
As a result of these leading positions, it perhaps should not come as a surprise that it transports nearly two-fifths of all U.S.-consumed and exported natural gas.
OKE, meanwhile, also focuses on natural gas as well as NGL assets as it generates 100% of its EBITDA from servicing these energy commodities, though it lacks the impressive scale that KMI has.
As a result of their focus on cleaner hydrocarbon energy commodities, both businesses are well positioned to benefit from what should be an extended boom period as the world’s economy transitions towards cleaner energy sources.
Both businesses also have very stable cash flow profiles. KMI generates 97% of its cash flow comes from commodity price and/or volume resistant fixed-fee take-or-pay contracts and most its counterparties are investment grade. OKE, meanwhile, has seen its distributable cash flow per share grow consistently year after year with the lone exception being a 10.1% decline during the COVID-19 energy market crash of 2020. This is because about 90% of its cash flows stem from commodity price and/or volume resistant fixed-fee take-or-pay contracts while 85% of its counterparties are investment grade. It also has no unhedged commodity price exposure, making its cash flow generation essentially utility-like in many ways.
As a result, we once again rate this match-up to be a draw.
ONEOK Vs. Kinder Morgan – Dividend Outlook
Meanwhile, KMI’s dividend coverage ratio is also expected to be conservative, at 2.0x for 2022 and 2.0x in 2023 based on its expected DCF per share generation and current dividend payout. OKE has a 1.6x coverage ratio for 2022 and a 1.8x coverage ratio for 2023 based on its expected DCF per share generation and current dividend payout.
Meanwhile, KMI is expected to grow its dividend per share at a 2.8% CAGR through 2026 while OKE is expected to grow its dividend per share at a 2.3% CAGR through 2026. As a result, we give the slight edge to KMI here due to its slightly superior dividend coverage ratio and slightly higher expected dividend growth rate.
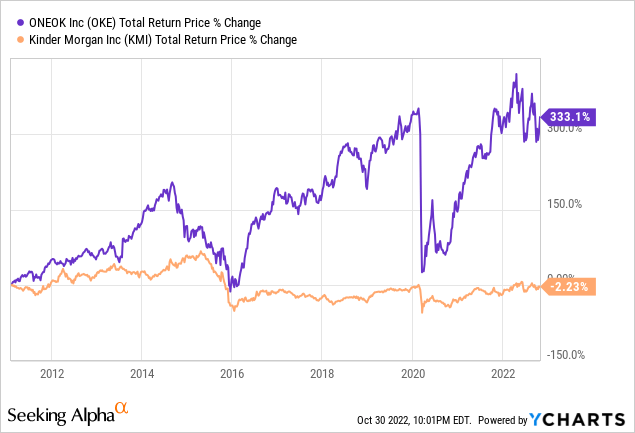
ONEOK Vs. Kinder Morgan – Track Record
When it comes to track record, OKE absolutely crushes KMI, giving them the very clear edge in this category:
ONEOK Vs. Kinder Morgan – Risks And Catalysts
As midstream businesses, the risks and catalysts facing KMI and OKE are very similar. Both are heavily focused on natural gas related businesses, so their fates largely rise and fall with the long-term outlook for natural gas and NGLs. That said, KMI also does have some exposure to other commodities, so it is a bit more diversified. As a result, if natural gas midstream and NGLs generally outperform the rest of the midstream space moving forward, OKE will likely benefit slightly more from this trend than KMI will.
ONEOK Vs. Kinder Morgan – Valuation
A quick look at the valuation metrics appears to give KMI the slight edge, as it is cheaper on an EV/EBITDA and P/DCF basis. However, it is worth noting that OKE is cheaper relative to its historical average EV/EBITDA multiple than KMI is. This is likely due to OKE’s superior track record which has commanded a superior multiple in times past. However, now with growth slowing down considerably for OKE, its multiple has contracted sharply. Overall, however, we give the edge to KMI here.
|
Valuation Metric |
OKE |
KMI |
|
Dividend Yield |
6.3% |
6.3% |
|
Dividend Yield (5-Yr Avg) |
6.9% |
6.1% |
|
EV/EBITDA |
10.6x |
9.7x |
|
EV/EBITDA (5-Yr Avg) |
12.4x |
10.2x |
|
P/22E DCF |
9.8x |
8.0x |
|
P/23E DCF |
9.0x |
8.0x |
Investor Takeaway
Both KMI and OKE have similarly strong balance sheets and attractive business models, making them pretty safe income investments that should enable income investors to sleep well at night. Both also trade at attractive valuations at the moment. However, KMI is slightly cheaper and also has slightly more attractive growth prospects. Meanwhile, OKE is a slightly more concentrated bet on natural gas and NGLs and also has a vastly superior track record.
As a result, investors who put a lot of stock in track record and still do not trust Richard Kinder after the company slashed its dividend several years ago and has yet to fully recover from that event, may prefer OKE. On the other hand, investors looking for the best current value relative to the current fundamentals will likely prefer KMI. We like both stocks here and rate them both as Buys, though there are other opportunities that we like even more in the midstream space at present.
Note on taxes: both of these midstream businesses are structured as C-Corps for tax purposes, so they issue a 1099 tax form instead of a K1. This makes them suitable for inclusion in retirement accounts as well as taxable accounts and also may make them more attractive for non-U.S. investors who otherwise face stiff withholding taxes for investing in K1 issuing securities. To be clear, this is not tax advice, just my personal opinion based on my own research and experience. Be sure to do your own due diligence.
Be the first to comment