

David Silverman
In Berkshire Hathaway’s (NYSE:NYSE:BRK.B) most recent quarterly report, the company’s revenues increased 10% from a year ago and its earnings grew 16% from its operating businesses (excluding investment losses). Yet, if you include fluctuations in the value of its investment portfolio (as dictated by accounting rules), the company actually showed a net income loss of $43.7 billion as a result of a $67 billion (unrealized) investment loss. This is where investors need to focus on the company’s operating businesses to get a better understanding of how the company itself is doing.
Google Finance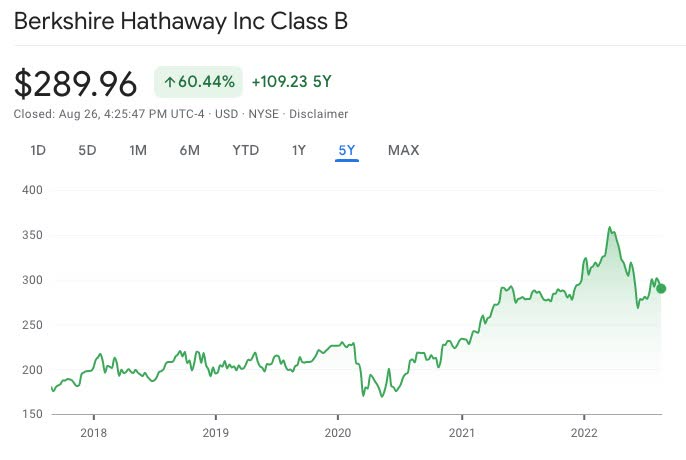
Real Earnings
As Warren Buffett outlined in this year’s annual report, he breaks down Berkshire Hathaway by the four main businesses that drive its revenues and earnings: insurance, Apple, Burlington Northern Santa Fe (BNSF), and Berkshire Hathaway Energy (BHE). In 2021, insurance, BNSF and BHE accounted for over $15 billion or 57% of total earnings, excluding investment gains.
BNSF
Since Berkshire’s investment portfolio is massive at $350 billion as of the end of 2021, the $62 billion in investment gains in one year reflected in the annual report dwarfs the $15 billion in actual earnings that the company generated from its operating businesses. Thus, it can be misleading to think that the company’s realized earnings more than doubled in 2021 as a result of its investment portfolio growing over 21% in one year. This is further illustrated this year (2022) from the fact that Berkshire’s investment portfolio is down $69 billion since the start of the year, and translated to the company showing an earnings loss of $38 billion for the first six months.
BHE
Obviously, the performance of Berkshire’s investment portfolio adds (massively) to the overall value of the company, but this has to be taken into account over a longer period of time than just one year. In fact, I would argue that investors should own Berkshire shares more for its operating businesses than its investment portfolio, since any investor can easily follow and copy Buffett’s investment moves on their own without having to buy Berkshire Hathaway stock.
Analysis
Buy Rating: I have a Buy rating for Berkshire Hathaway’s Class B stock, with a five-year target price of $590 per share.
Based on the company’s operating businesses’ performance the last five years, I believe Berkshire can grow its annual revenues at 10% per year over the next five years as its energy, manufacturing and railroad businesses continue to grow in the low double digits.
I am also estimating that the company’s net margin can hold steady at 25%, excluding fluctuation in its investment portfolio. With the stock currently trading at 7 times earnings (based on year-end fiscal 2021 earnings), it is trading at a discount considering its growth. I am estimating that the stock’s P/E ratio can expand to 10 times earnings over this time frame.
Below is a table contrasting the company’s current metrics and stock price to the 5-year estimate:
| Berkshire Hathaway |
Current (as of 8/26/22) |
5-Year Estimate |
|
Revenue (from business operations) |
$354,636 |
$519,223 |
|
Net Margin (%) |
25.32% |
25% |
|
Net Income (in millions) |
$89,795 |
$129,806 |
|
# Outstanding Shares |
2,265,269,867 |
2,201,000,000 |
|
Net Income per Share |
$39.64 |
$58.98 |
|
Price/Earnings (P/E) Ratio |
7.31 |
10 |
|
Stock Price |
$289.96 |
$590 |
Source of company metrics: Morningstar & Berkshire Hathaway
*Current metrics based on fiscal year-end 2021
*To better understand how to read the table above, read my previous article Meta: Attractive Valuation.
One aspect worth noting that is factored into the estimates is the performance of Berkshire’s investment portfolio. The assumption in the estimates is that investment gains would amount to $115 billion in year five, which is a 46% increase from 2021 or an annualized 9.3%.
Be the first to comment