

William_Potter
In a SA article in June 2017, I argued that the strategic 60/40 portfolio is a risky investment, especially when long-duration bond ETFs are used to take advantage of convexity.
In a recent SA article, I wrote about a few alternatives to a 60/40 portfolio based on timing strategies.
It is a fact, however, that most investors do not like tactical allocation and timing strategies. A strategic allocation that fulfills the goal of capital appreciation at minimum risks with annual rebalancing is preferable.
By Mid-June of this year, investors in the 60/40 portfolio got uneasy with the drawdown of the more conservative allocation based on the S&P 500 Total Return (SPX) and the US Aggregate Bond Total Return (AGG) reaching 18%. This brought back memories of the 2020 pandemic crash, and before that the Financial Crisis bear market.
60/40 Portfolio Drawdown Profile 01/02/2003 – 08/24/2022 (Price Action lab Blog – Norgate Data)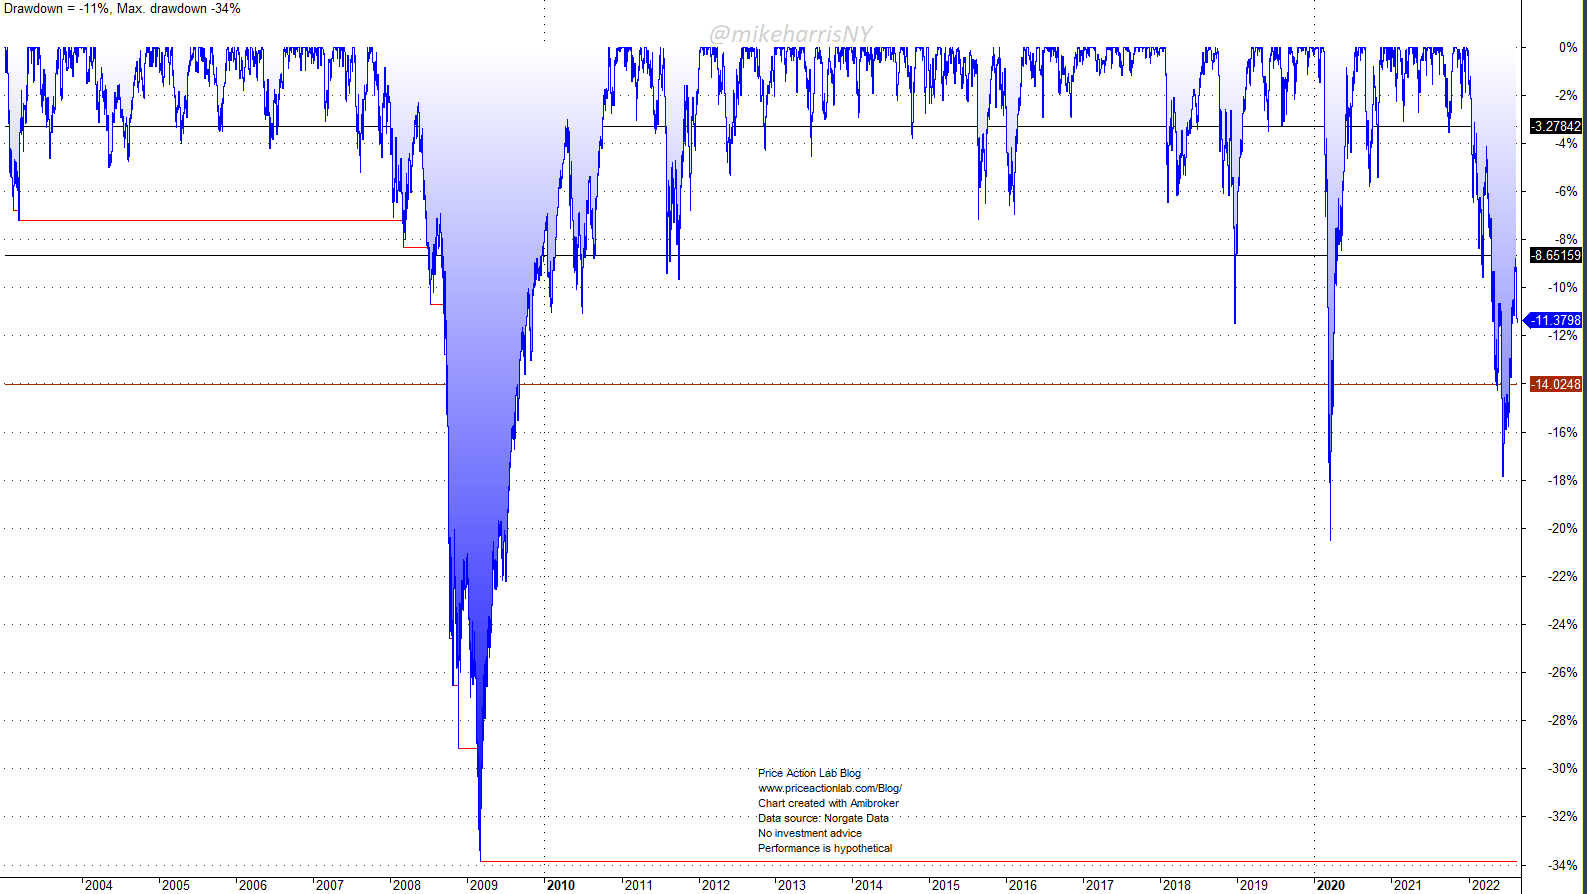
The drawdown profile of this 60/40 strategic allocation reflects elevated risks. Although in 2020 the portfolio recovered and closed the year with a gain, the swings have made investors uncomfortable. One rule in financial markets is that the drawdown may double in the future. Uncle point, or a point beyond which an investor cannot sustain any losses and exits the market, is a frightening possibility.
Yearly returns of the 60/40 portfolio 01/02/2003 – 08/24/2022 (Price Action Lab Blog – Norgate Data)
After 13 years with only a small loss, high volatility returned to the 60/40 portfolio, as the chart above shows. The macroeconomic environment points to more pain in both equity and fix-income markets. The worst-case scenario is a bear market in both stocks and bonds. In this case, 60/40 losses will mount. Naturally, investors are looking for alternatives.
All alternatives also come with risks. In this article, we present a 60/40 portfolio in stocks and managed futures. We believe this may serve as an alternative under the scenario of persisting inflation and prolonged bear markets.
Below is the yearly performance of a portfolio that invests 60% in S&P 500 Total return and 40% in the SG CTA Trend Index developed by Société Générale (OTCPK:SCGLF).
Yearly returns of the 60/40 portfolio IN Stocks and Managed Futures 01/02/2003 – 08/24/2022 (Price Action lab Blog – Norgate Data, BarclayHedge)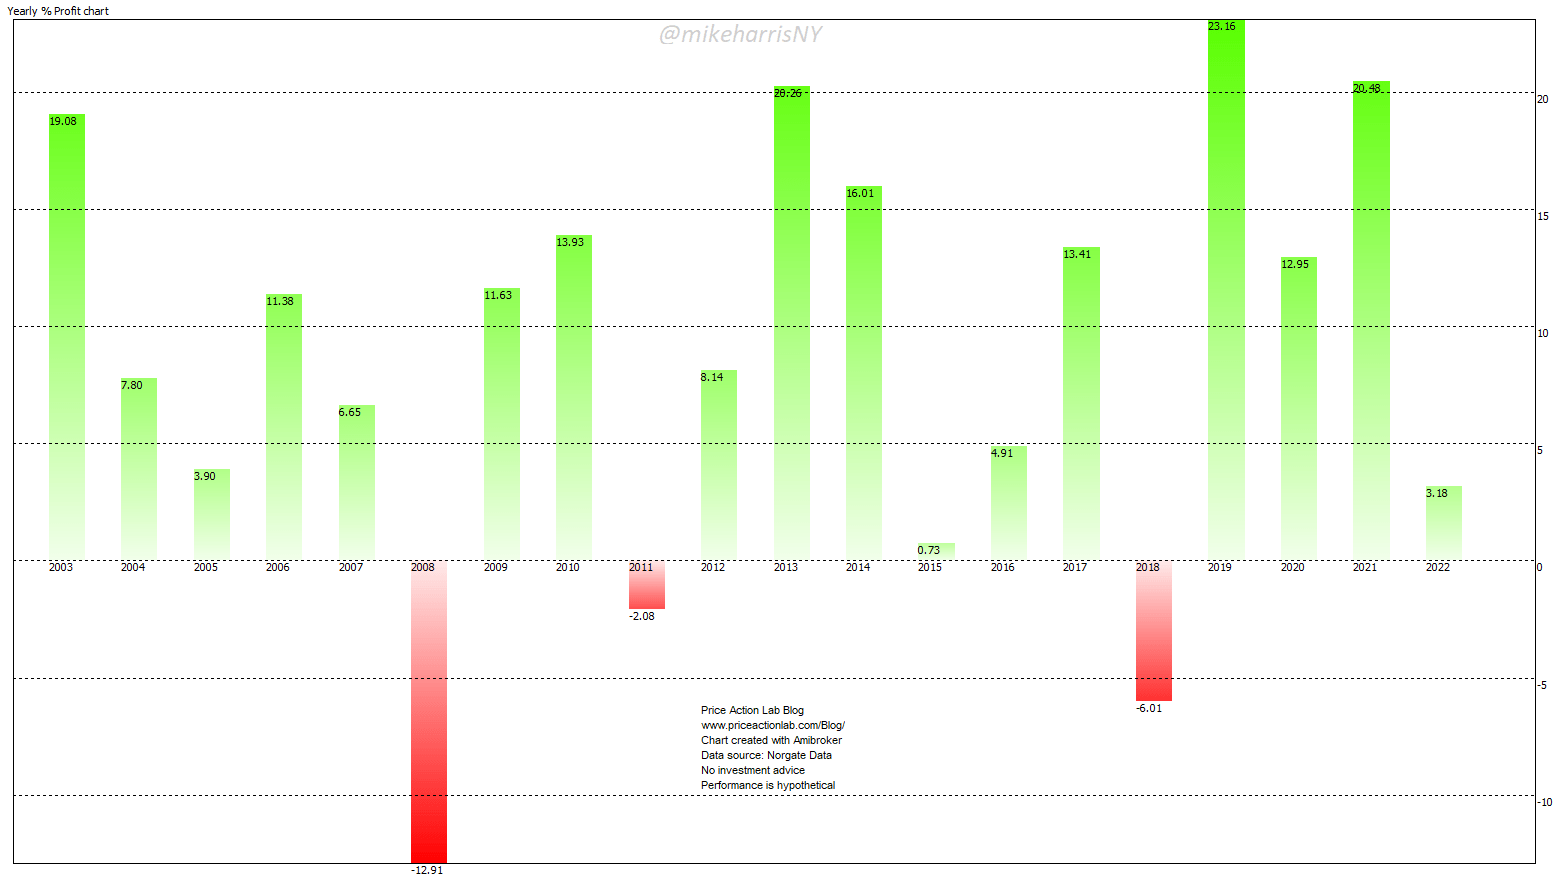
The performance of the traditional 60/40 allocation in S&P 500 Total Return and US Aggregate Bond Total return (60/40 T), and 60/40 allocation in S&P 500 Total Return and SG CTA Trend (60/40 C), is summarized in the table below.
| 60/40 T | 60/40 C | |
| Annualized Return | 7.6% | 8.6% |
| Maximum Drawdown | -33.8% | -29.4% |
| Sharpe Ratio | 0.73 | 0.74 |
| Volatility | 10.4% | 11.5% |
| Worst Year | -19.4% (2008) | -12.9% (2008) |
| YTD Return | -11.1% | 3.2% |
Although the Sharpe ratio is about the same, the 60/40 C has provided 100 basis points of higher annualized return at a lower maximum drawdown. The relative equity performance is shown below.
Relative Equity Performance of 60/40 T and 60/40 C Portfolios (Price Action Lab Blog – Norgate Data, BarclayHedge)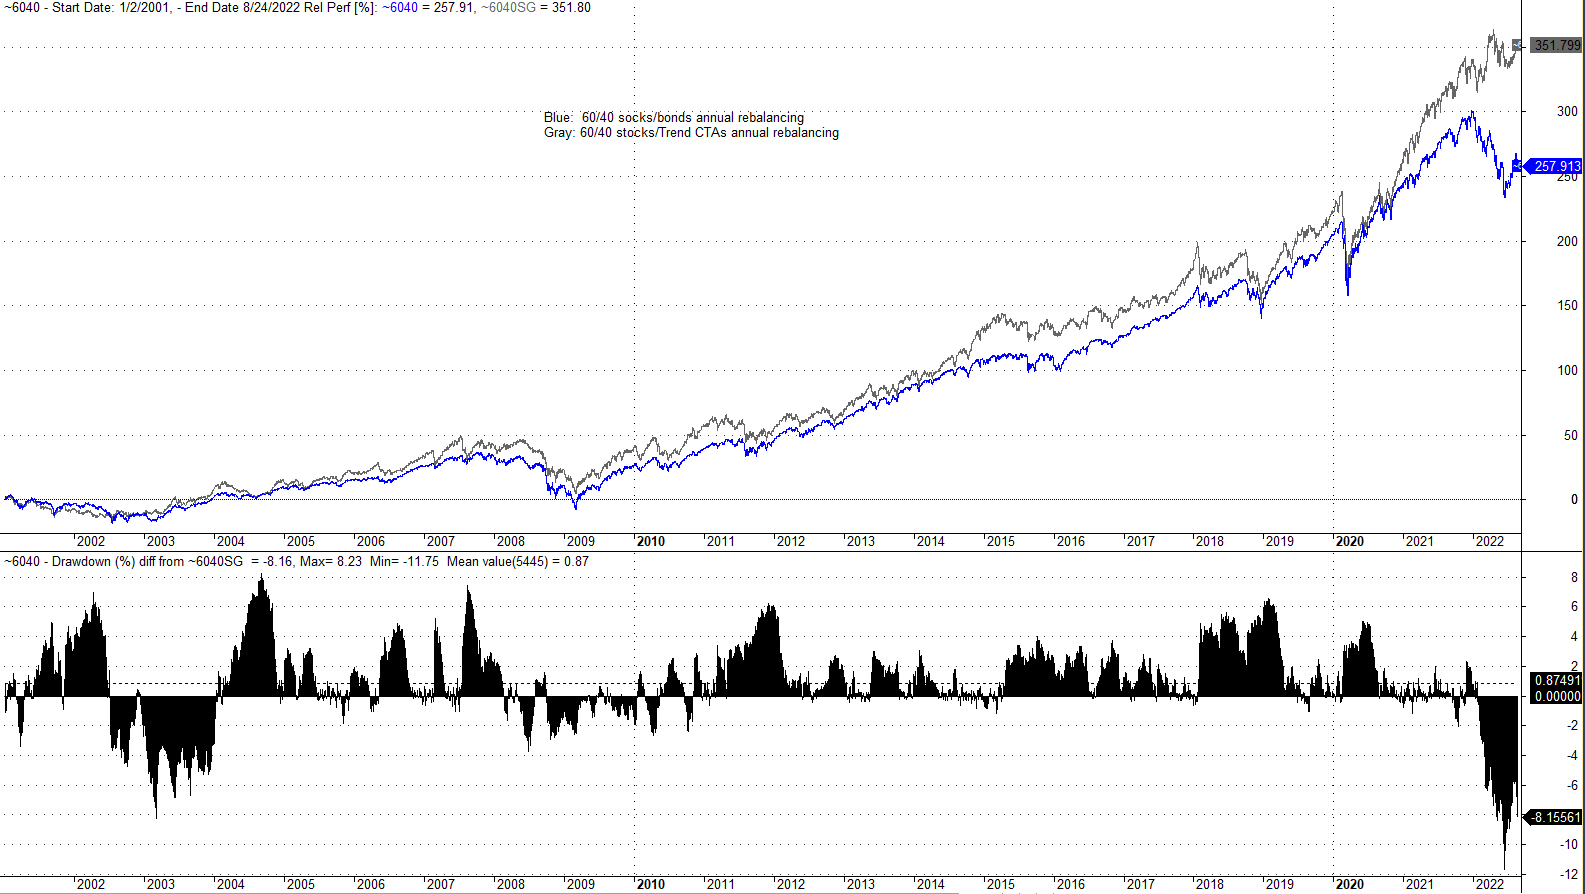
The average difference between the drawdown levels of the two portfolios is less than 1%. The divergence in performance after mid-2021, and especially this year, could be an indication of a regime change favoring managed futures over bonds.
There is an issue with the above backtests: the SG CTA Index is not tradable. However, there is an ETF, iMGP DBi Managed Futures Strategy (DBMF), that tracks closely this index, as shown below.
Relative Performance of SG CTA Trend Index and DBMF ETF (Price Action Lab Blog – Norgate Data, BarclayHedge)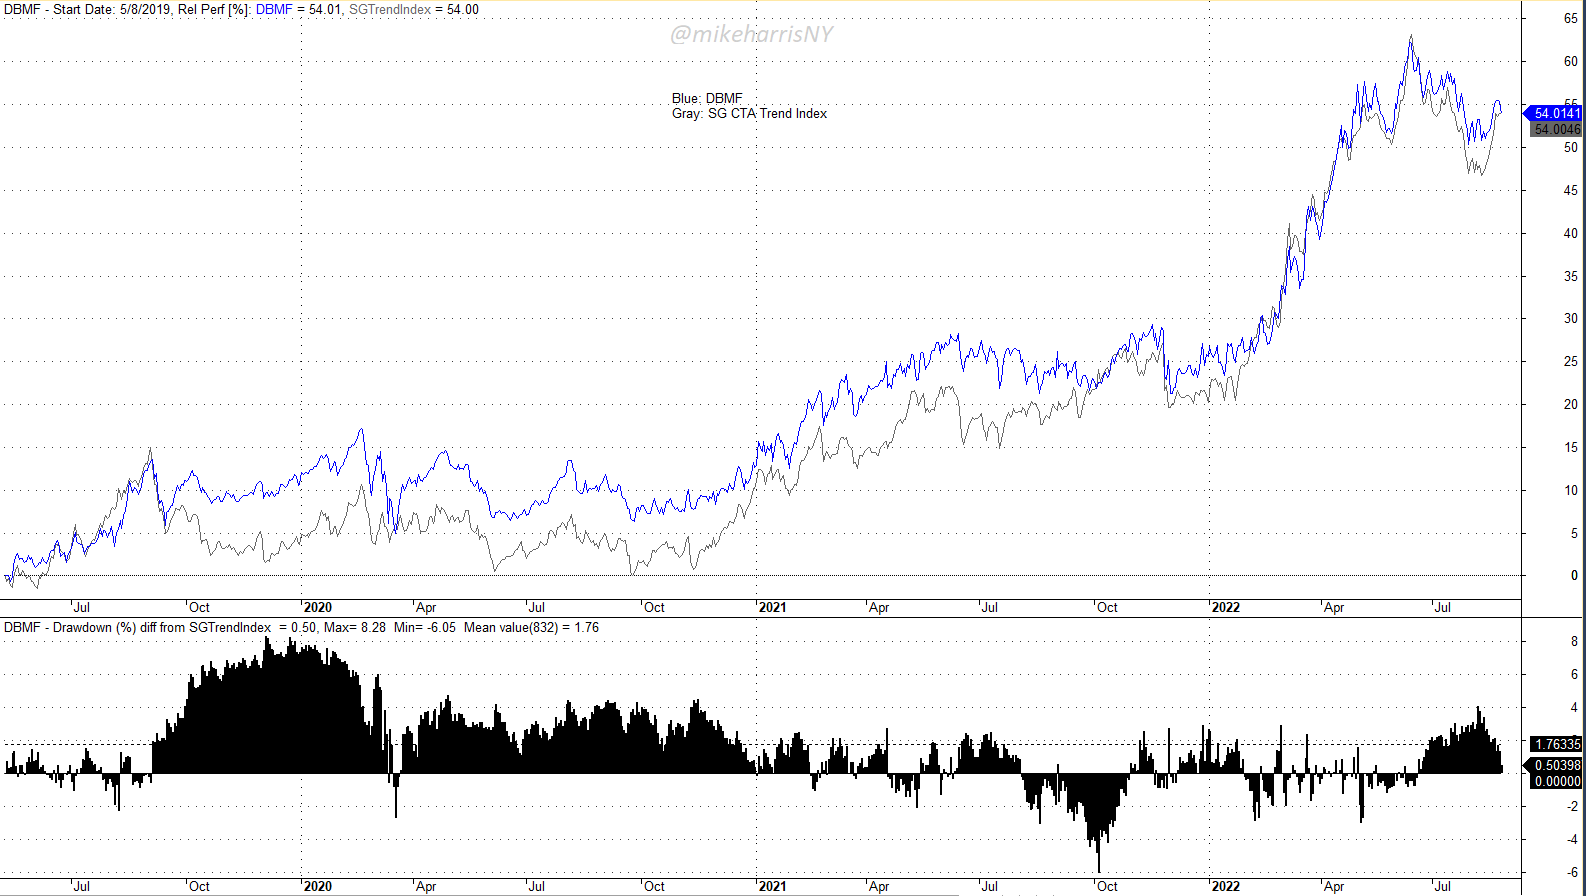
Since its inception on May 8, 2019, the DBMF ETF has tracked the SG CTA Trend Index closely: both the ETF and Index are up 54% as of August 24, 2022, and the average difference between the drawdown levels is only 1.8%.
Caveat emptor: The sample for DBMF ETF is small. There is a possibility the ETF will stop tracking closely the SG CTA Trend Index in the future. Therefore, the tracking error should be monitored and used to determine whether the 60/40 allocation is still viable.
Conclusion
We presented a 60/40 portfolio on stocks and managed futures as an alternative to the traditional 60/40 portfolio in stocks and bonds. Other variations of this portfolio are possible. The general idea is to get away from the traditional 60/40 portfolio that is problematic in the current macroeconomic environment, and possibly for a few years in the future.
One problem with the proposed alternative portfolio is the short life of the tradable ETF for the managed futures part. But it appears this ETF is gaining popularity among quants and hedge funds for use in portfolio construction.
Be the first to comment