

Drew Angerer/Getty Images News
Investment Thesis
There are various metrics indicating that a global economic recession may be on the horizon. Not only have the Nasdaq 100 and S&P 500 indexes fallen and recently run into significant resistance, but options data may reinforce the negative stance prevalent throughout the stock market. Most importantly, Tesla CEO Elon Musk has continually sold off his shares while Tesla stock (NASDAQ:TSLA) has broken the parabolic pattern and apparently entailed higher downside risk.
Macroeconomic Models Look Pessimistic
The Buffett indicator is the ratio of Wilshire 5000 total market index (FTW5000) to Gross Domestic Product (GDP) in the United States. Simply put, it is calculated as the aggregate value of all public investable stocks (featured by FTW5000) divided by the market value of the goods and services produced by American workers and property (as measured by GDP). This metric aims to gauge the relativity between the country’s performance output and the valuation of stock markets at an aggregate level. If its value is too high, the aggregated value across stock markets is relatively overestimated in comparison to the economic performance. Unfortunately, the Buffett indicator has exceeded 200% since 2021 while the American GDP has also remained high. It implies that the rate of change in the over-valuation of stock markets has increased dramatically relative to the economic output due primarily to speculation caused by market euphoria, which may result in the stock market crash.
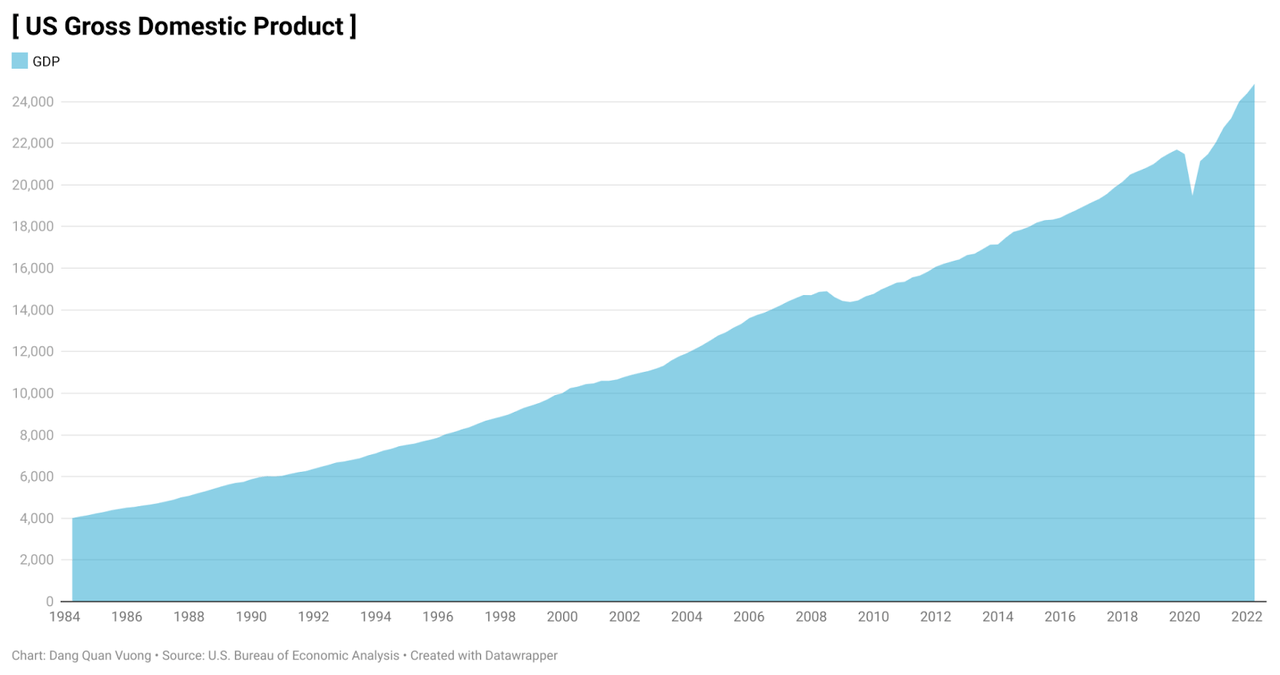
The Buffett indicator suggests that the valuation of stock markets is relatively overvalued. (Created by Author using data from U.S. Bureau of Economic Analysis, Wilshire Associates) Gross domestic product (GDP) has remained strong. (Created by Author using data from U.S. Bureau of Economic Analysis)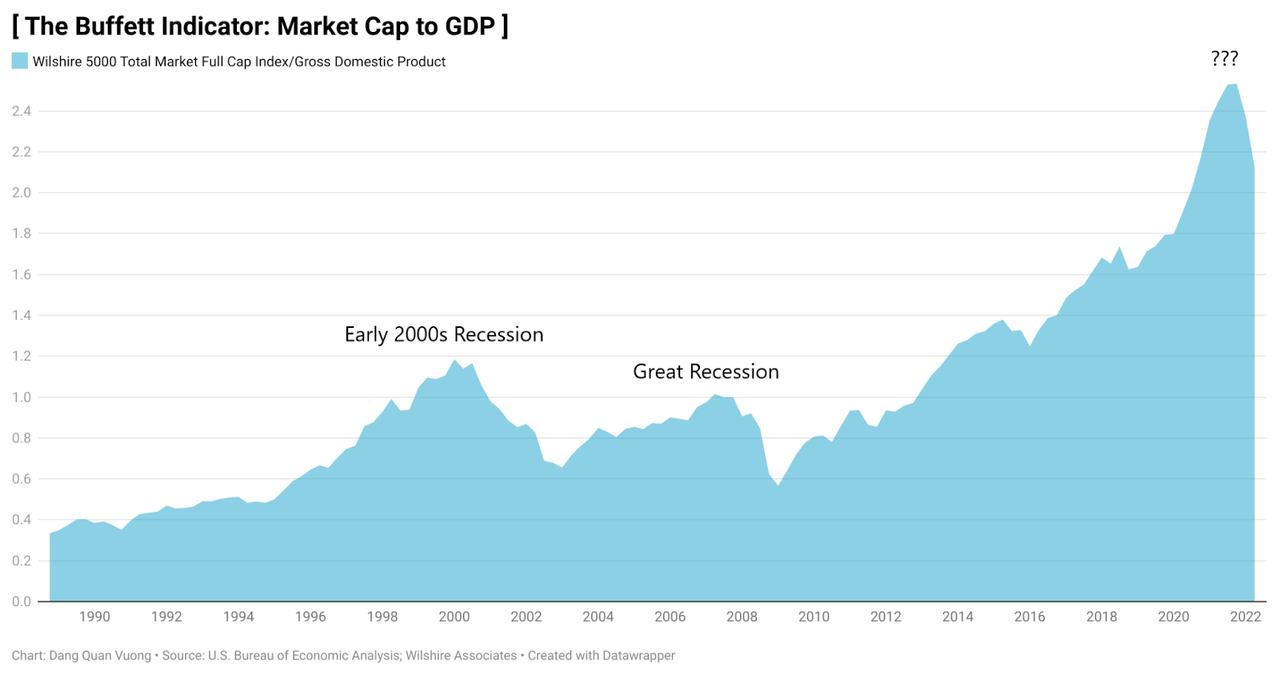
Besides, Shiller PE Ratio is a valuation measure generally applied to the US S&P 500 index using real earnings per share over 10 years. It helps investors evaluate the quality of equity market performance and whether stock markets are over or undervalued. This metric became famous after Robert Shiller foresaw that the bubble of the US stock market in late 1990s would eventually burst. Now, its value is relatively high and has the same pattern as the Black Tuesday and Dotcom bubble.
The Shiller PE ratio has reached the level as seen in the Black Tuesday and Dotcom bubble. (Created by Author using data from Nasdaq)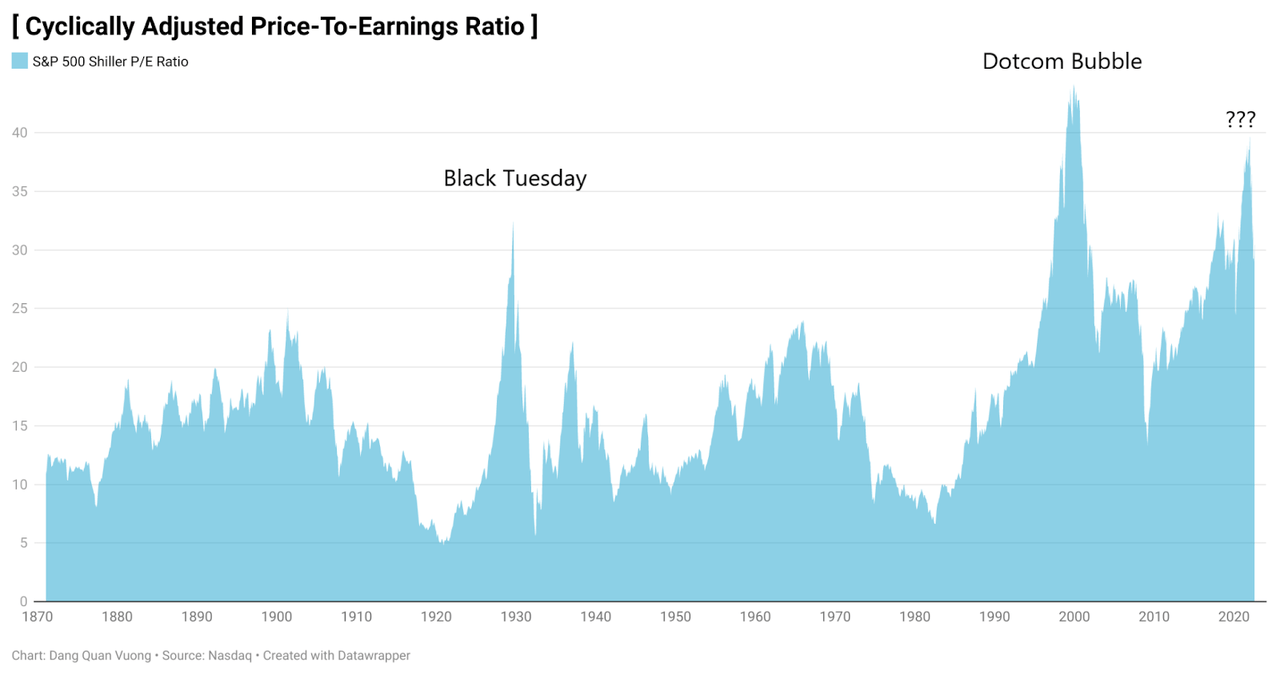
The CBOE volatility index (VIX) is a real-time index built on the prices of the S&P 500 index (SPX) options with short-term expiration. It represents the 30-day forecast of the magnitude of price change in the SPX index, where it’s called implied. This forward-looking implied volatility is commonly considered as a quantifiable methodology to measure market risk and investor’s sentiment as fear and greed across stock markets. When the value of VIX goes up above 30 along with the rapid escalation of the market value, market participants are in a state of euphoria. There is a likelihood of a bubble because investors are greedy and generally investing based on speculation instead of fundamental aspects. Once again, this index has entered the red zone of euphoria as seen in the rubble crisis, early 2000s recession, great recession, and Covid crisis.
CBOE volatility index has surged to the red zone above 30, increasing a downside risk. (Created by Author using data from Chicago Board Options Exchange)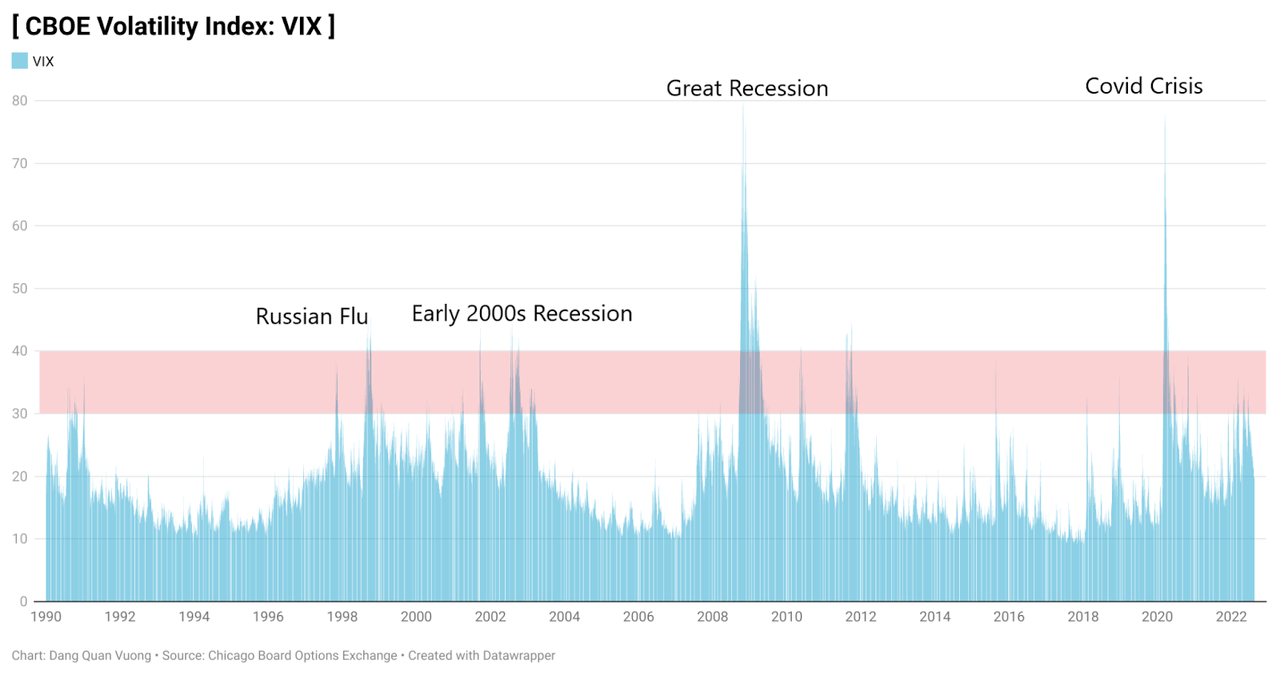
A yield curve inversion is when long-term maturities interest rates drop below short-term maturities interest rates, as smart money is shifting from short-term bonds to long-term ones. This is because investors have pessimistic views about the prevailing market conditions and the near-term economic prospects. One of the most important US Treasury bond yield spreads is the 10-year treasury constant maturity minus 2-year treasury constant maturity. A yield curve inverted has proven to be a reliable recession indicator since world war II. This can be exemplified by the Black Monday, 1990-1991 crisis, 1998 Russian financial crisis, the early 2000s recession, great recession, and Covid crisis. Following a rebound from the Covid crisis, this bond yield spread has recently been negative once more. There is the same pattern here if we combine the ruble crisis and dotcom bubble. This is one of the arguments put up by some to support the theory that the current stock market would turn out to be a bubble.
The spread of 10-year bond and 2-year bond has inverted, indicating the possibility of the coming recession. (Created by Author using data from Federal Reserve Bank of St. Louis)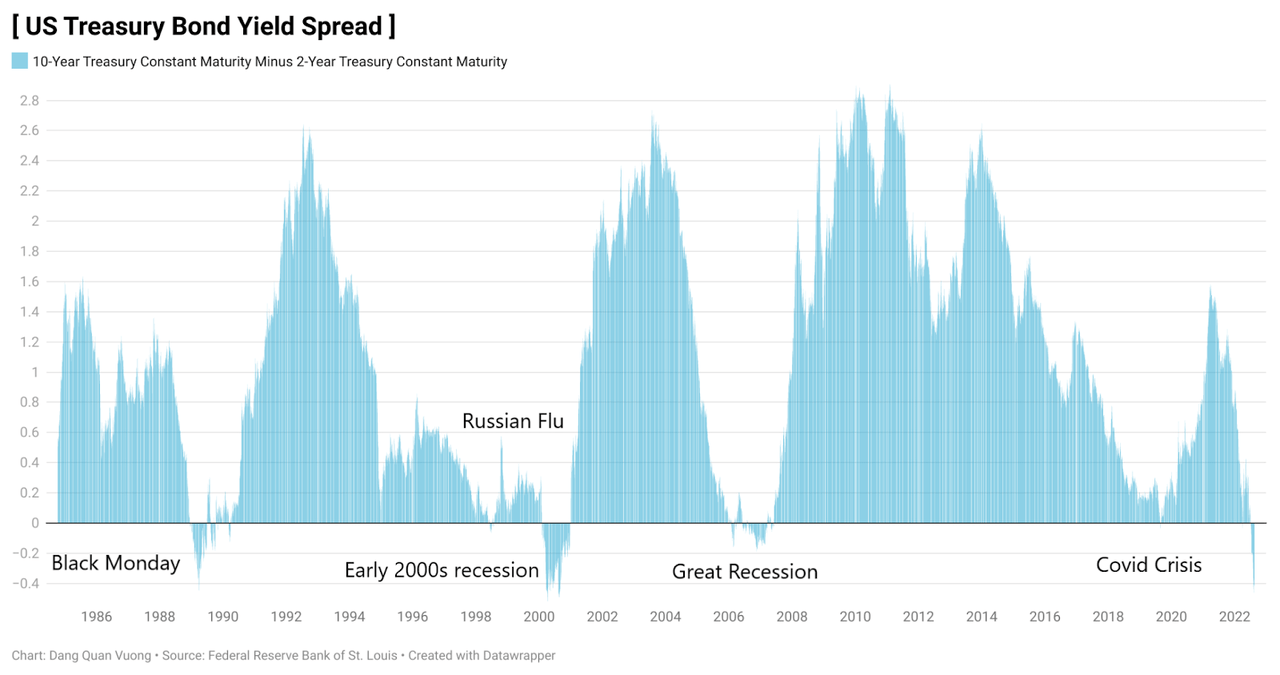
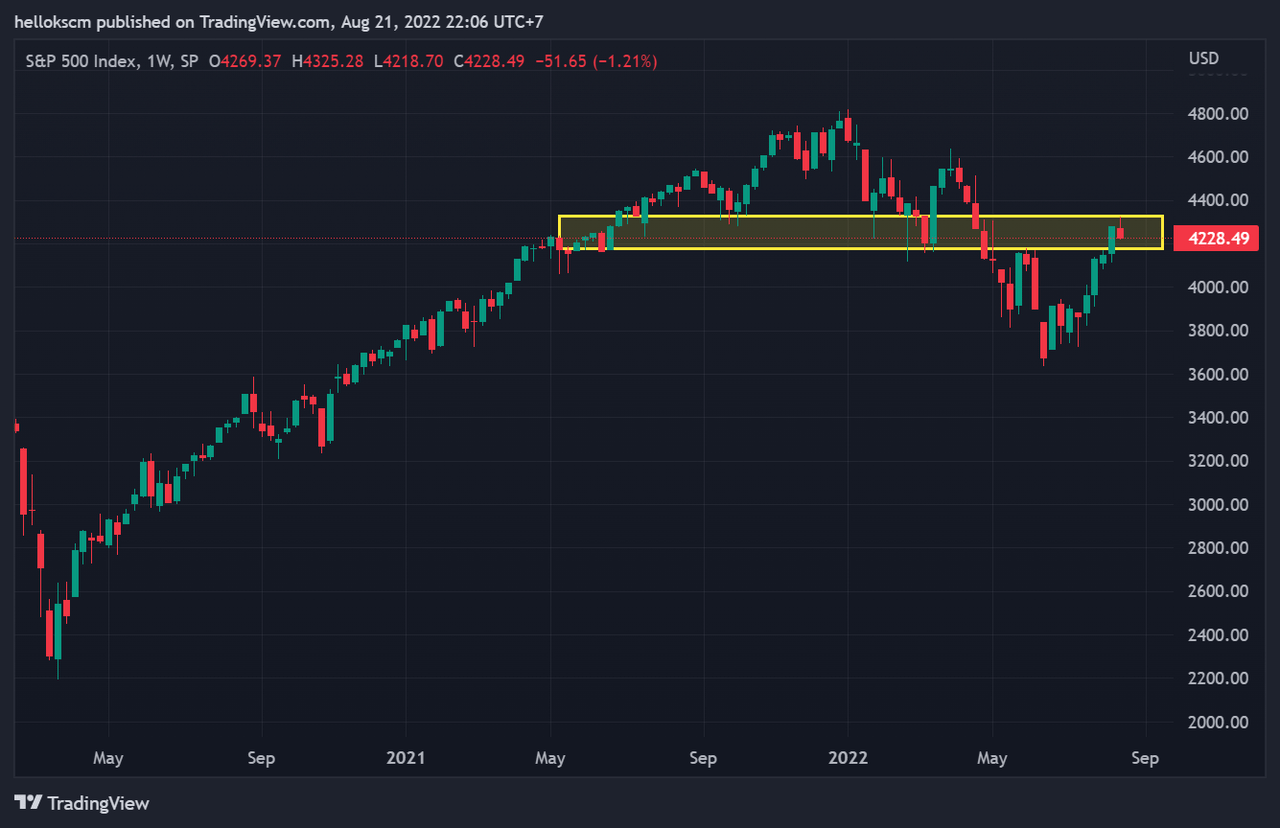
Regarding technical analysis, the Nasdaq 100 index has plummeted to 11000 then rebounded to the resistance range of 13200-14000. In the meantime, the S&P 500 index has since declined from its peak and has lately encountered resistance at the level of 4200 – 4400. Both the largest indexes hitting a barrier in a weak market suggests that this rally may be perilous.
Nasdaq index has recently retested the resistance area of 13200 – 14000. (TradingView) S&P 500 Index has recently retested the resistance around 4200 – 4400. (TradingView)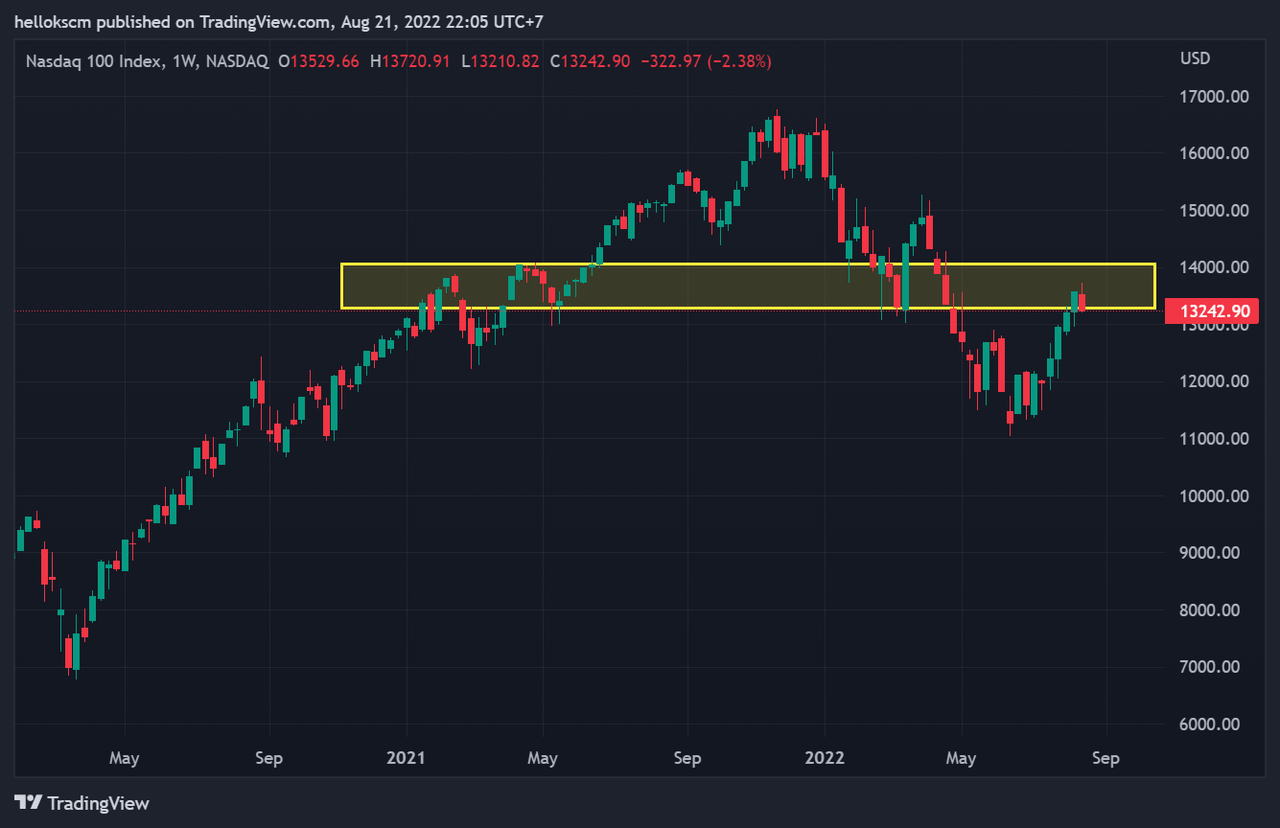
Big Player Elon Musk Have Sold Off His Shares
In the period of a recession, the fundamental analysis involving the well-being of a company may be less helpful because macro-contextual factors can be responsible for the market downturn. Meanwhile, investors’ sentiment and behavior across the market would be more important and make a huge contribution to the market movement through the snowball effect. Therefore, it should be necessary to investigate whether big players hedge against the possible coming recession because this group of people have extra information about business and market cycles that ordinary investors may not be able to have access to.
In his tweets, Tesla CEO Elon Musk has repeatedly said that the recession is coming. It may not be true, but it must definitely be his belief and can draw up his investment strategy. In reality, he has put his belief into action, and sold off nearly $5 billion of the Tesla electric automaker’s stock in late 2021, $8.5 billion of the stock in April 2022, and $6.9 billion in recent days. The man who leads Tesla, Inc. and has enormous power in its business operation has continually cashed out his shares, that should be a serious issue. To get further into details, it is necessary to analyze what traders and investors are doing behind the scenes.
Option Markets Suggest More Volatility Coming
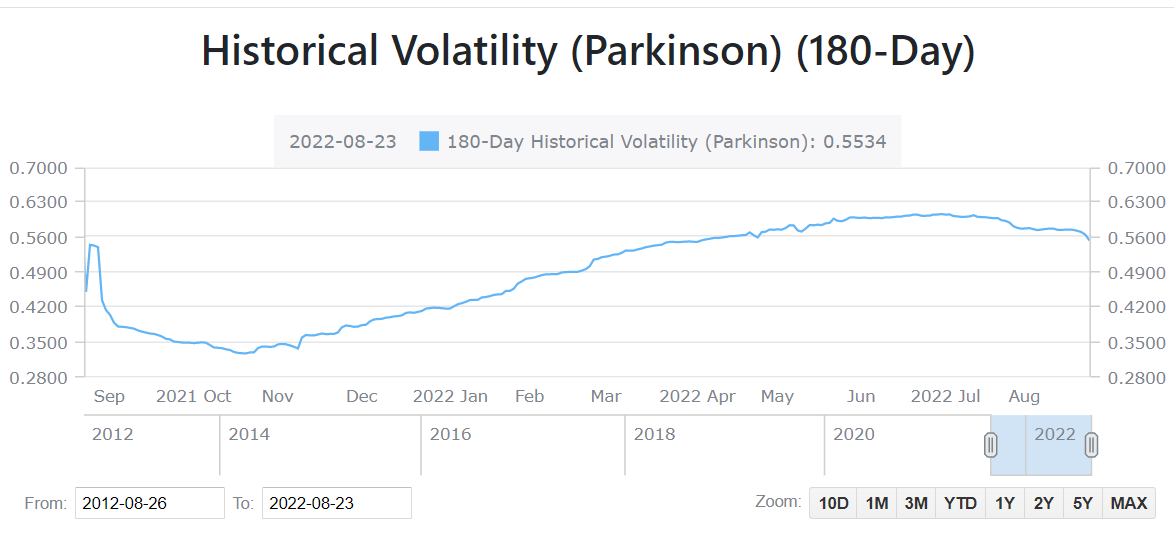
The historical volatility quantifies how much an underlying security’s price deviates from its mean value in an interval of time. According to the mean reversion, the price is likely to go back to its mean value in a period of time if it is too far away from its mean. Therefore, the historical volatility measures the relative strength of price changes. The 180-day historical volatility of Tesla stock has gradually increased since late 2021 and remained relatively high around 0.7 in recent days. This is also sharp when it comes to the Parkinson formula calculated using the high and low of daily trading prices. It suggests that there would be high volatility and a higher risk tolerance should be required.
The Tesla historical volatility has increased since late 2021 and remained relatively high. (Alphaquery) The Parkinson historical volatility in Tesla stock has surged since late 2021 and remained high. (Alphaquery)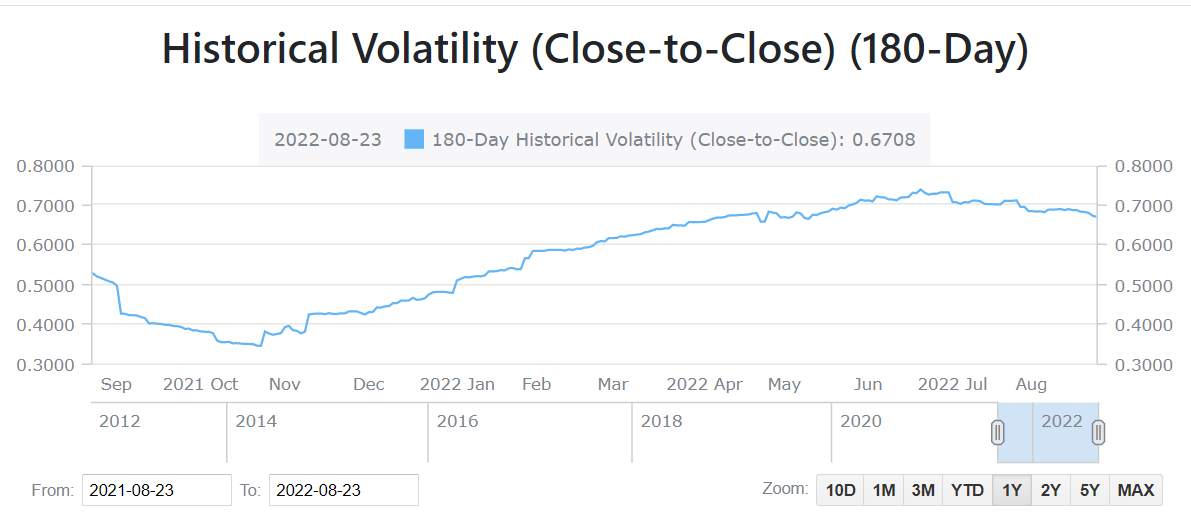
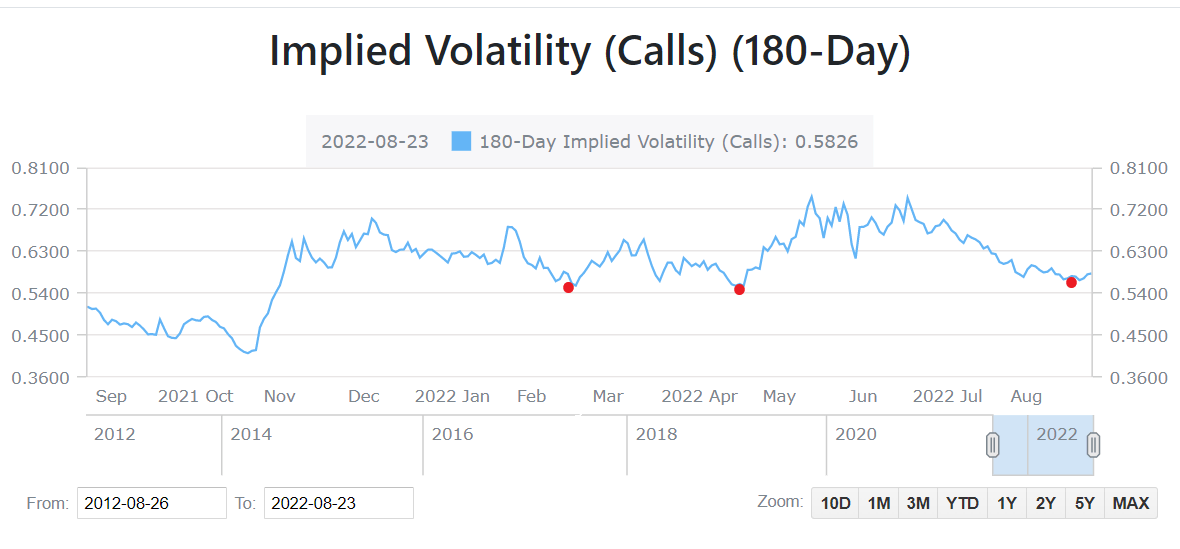
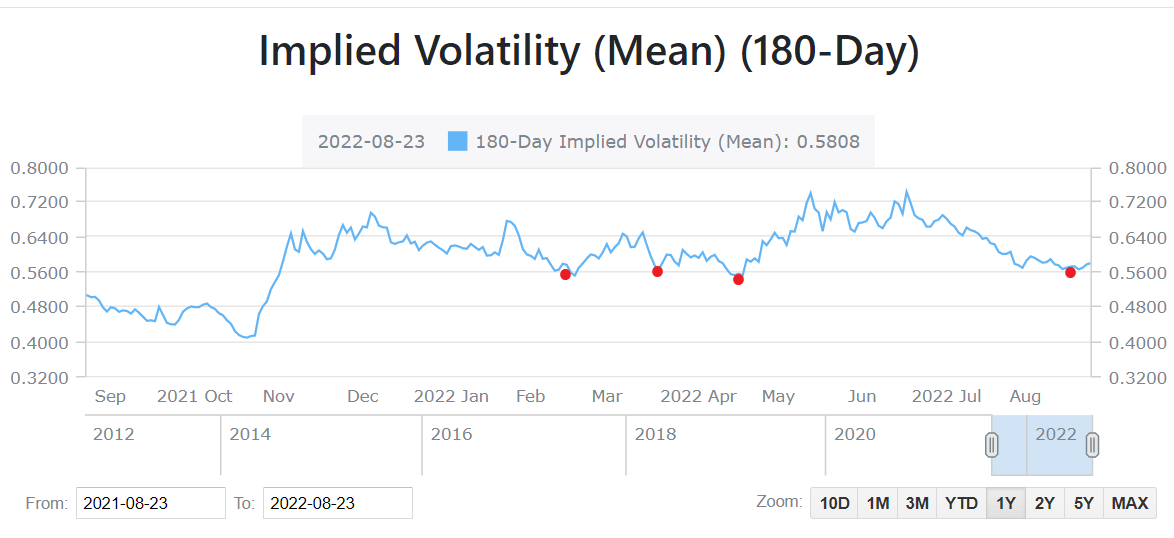
Unlike the historical volatility, implied volatility is a forward-looking volatility for options in a relevant timeframe. However, it is impossible to predict which direction the price change will unfold using implied volatility. In particular, high volatility denotes a significant price movement which may be in either the opposite direction, or oscillate with a high amplitude. Low volatility indicates that significant and erratic changes in price are unlikely. The implied volatility for 180-day put and call options of TSLA stock and their deprived average calculation have recently fallen to just above 0.56 as of the bearish market when the asset supply to demand is relatively high. Since November 2021, however, these fluctuations have held 0.56 as the strong support and have almost always kept their values above that level. There are two states of the market mechanism including balance (low volatility and market moving within a range or pattern) and imbalance (high volatility and market trending). These interconnected forces move the market from balance to imbalance and to balance again. It implies that the period of more volatility may be following after this stage of balance.
The 180-day implied volatility of TSLA put options has remained above 0.56 since November 2021. (Alphaquery) The 180-day implied volatility of TSLA call options has remained above 0.56 since November 2021. (Alphaquery) The 180-day implied volatility calculated using the average of TSLA put and call options has remained above 0.56 since November 2021. (Alphaquery)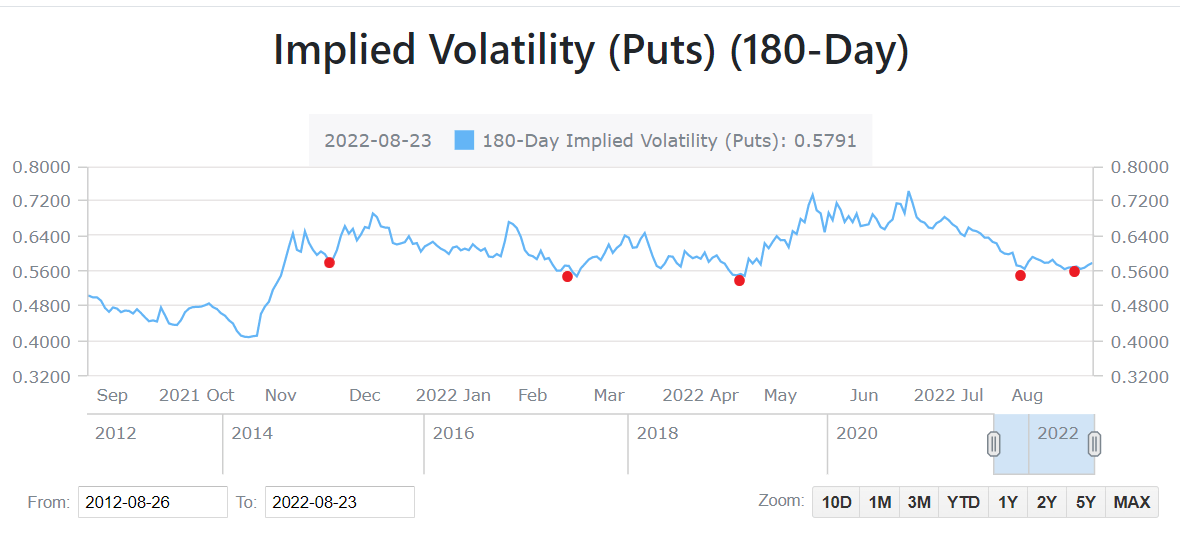
The difference between the implied volatility of options with lower and higher strike prices is referred to as the implied volatility skew. According to behavioral finance, traders prefer options with lower strike prices and are usually willing to “overpay” for those downside-striking stock options. In other words, options traders normally contribute more volatility to the downside than the upside, i.e., they are likely to hedge against the downside risk. As can be seen in the following figure, the 30-day implied volatility skew has mostly remained above zero and adopted it as a support. It is simply to say that bearishness among option traders has been relieved during the recent rally in Tesla stock. Unfortunately, the 30-day implied volatility skew draws a strong support at the zero line at which its value may bounce back. Hence, the skewness may come back from here when traders assign more downside volatility and the market will enter the imbalance again.
The 30-day implied volatility skew of TSLA stock has been positive almost all the time since 2021. (Alphaquery)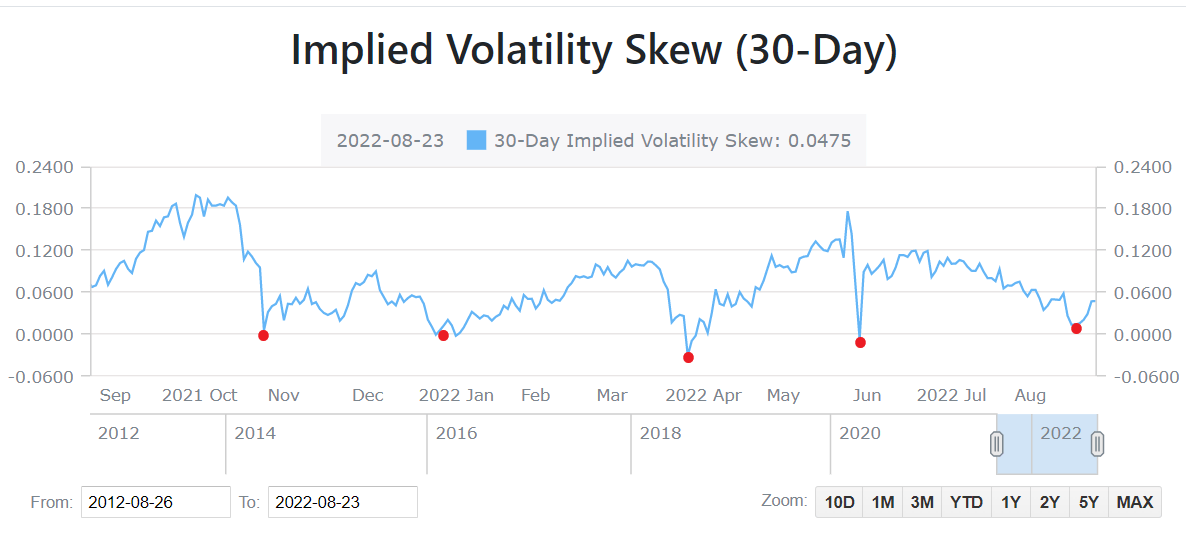
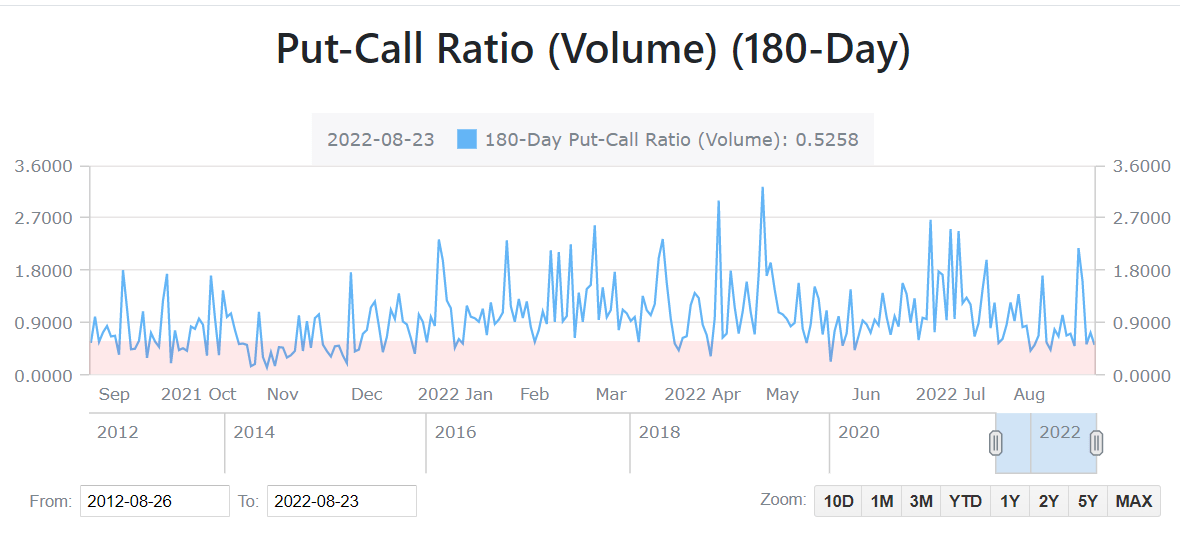
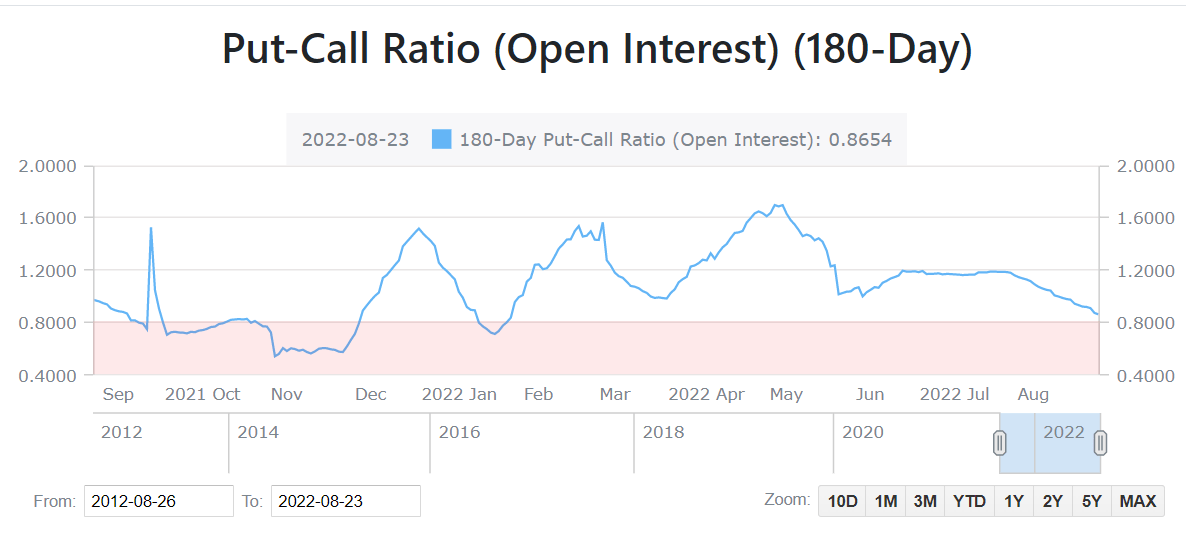
In terms of the put-call ratio based on traded volume, the level of 0.7 is typically seen as the neutral line in sentiment among market participants. Simply put, if the value of put-call ratio (volume) is lower than 0.7, there is a bullish sentiment building in the market. Unfortunately, the 30-day TSLA put-call ratio (volume) has consistently held the line of 0.7 as a strong support since September 2021 and rarely been below it. For those options with 180-day expiration, the put-call ratio (volume) has recently fallen to nearly 0.5 which may express a near-term bullishness among traders now. On a larger scale, however, it has kept the value above 0.7 most of the time and may increase further away from 0.7. This can be seen more clearly through the 180-day put-call ratio calculated by open interest when its value has aggressively remained above 0.8 almost always. It suggests that investors are either betting on a decline in the market or hedging their portfolios against the possible downside risk. There may be no space for contrarian fashion this time because this strategy is mostly applied when the market trend and sentiment are similar. Now, we are likely in the local market top with a bearish sentiment, thus it could be risky to go against it.
The 30-day volume based put-call ratio has almost remained above 0.7 over the past year. (Alphaquery) The 180-day volume based put-call ratio has almost remained above 0.7 over the past year. (Alphaquery) The 180-day put-call ratio calculated using the number of put and call outstanding contracts has almost remained above 0.8 over the past year. (Alphaquery)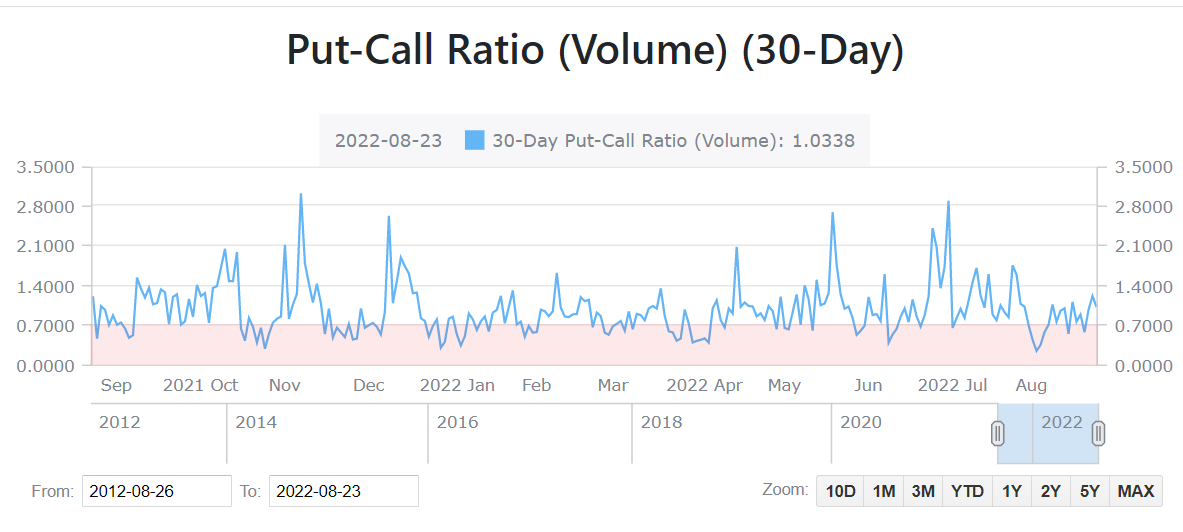
The TSLA Price Have Broken The Parabolic Pattern
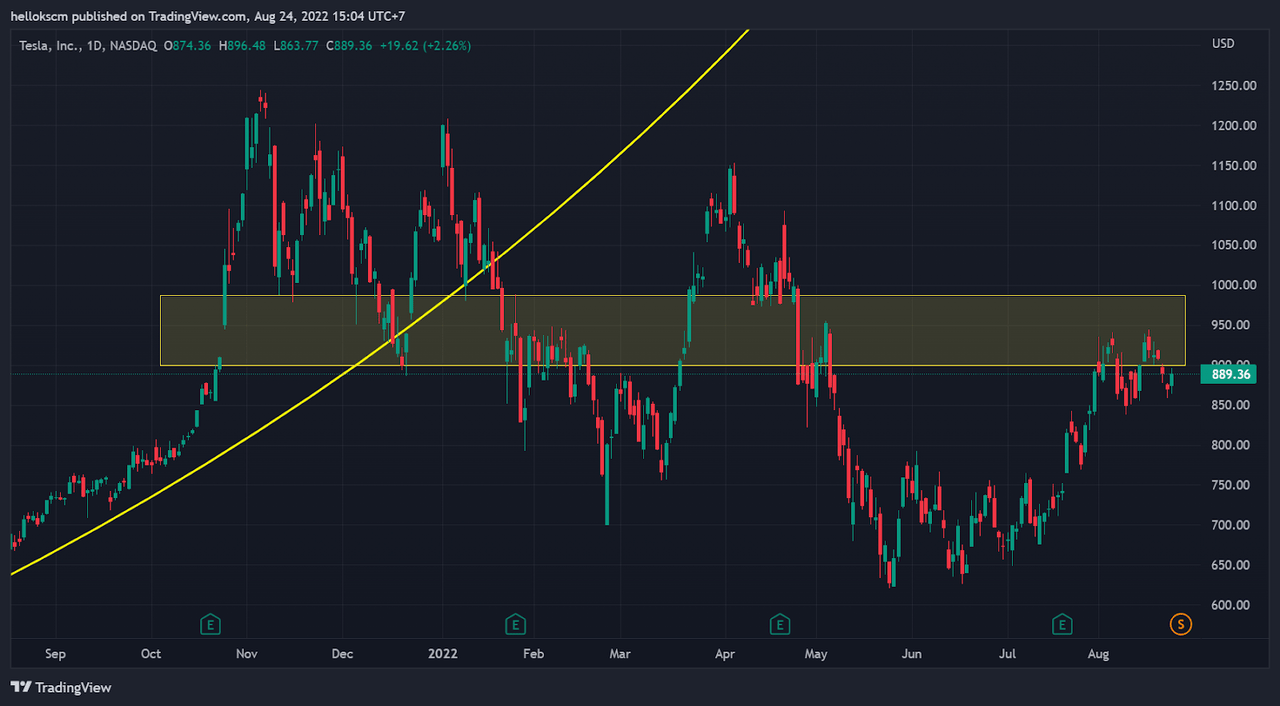
Looking at the weekly chart of Tesla stock, its price action has moved in a parabolic curve since May 2019 and might have finished the fourth base in late 2021. Ending this parabolic pattern with four stages has been historically proven to be the feasible reversal of a strong bull run in high probability. Additionally, the daily trading price of Tesla stock has broken the strong support area between $900 and $1000 which is the peak of Tesla price in the third phase, and recently retested it as the resistance. There is the likelihood that TSLA price would continue to go down in the next trending movement.
TSLA price has broken the parabolic curve made up since May 2019 after finishing the fourth phase. (TradingView) TSLA price has recently retested the resistance area between $900 and $1000. (TradingView)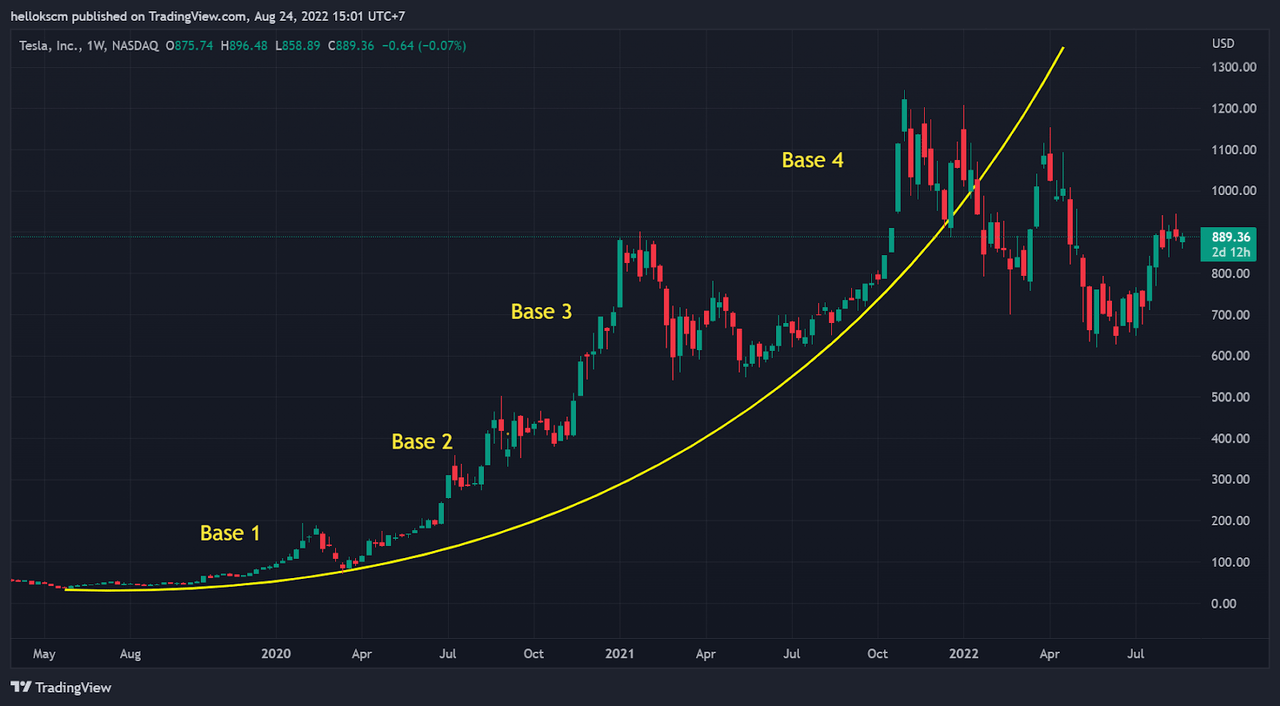
Conclusion
In summary, a global economic downturn might be just around the corner with reference to a variety of metrics. Meanwhile, the Nasdaq 100 and S&P 500 indexes have appeared to be weak during the current rally. Although the stock of Tesla Inc. has experienced a spectacular growth since 2019 following a parabola, it has recently breached this parabolic pattern after finishing the fourth stage. Having said that the put-call ratio and implied volatility of TSLA options point to potential future volatility that could put this stock at risk. Therefore, hedging against the rising negative downside risk may be a sensible line of action for investors this instant.
Be the first to comment