

Robert Way
Honeywell (NASDAQ:HON) is an industrial conglomerate with operations that span several portions of the economy through its 4 operating segments. The Aerospace segment serves both commercial, defense and space opportunities.
Meanwhile the Building Technologies segment offers a combination of software and hardware that allows clients to run their buildings, warehouses, factories, etc. more efficiently from a power standpoint i.e. energy management, while also tracking installation, maintenance, and upgrades to systems.
The Performance Materials Technologies segment offers automation instrumentation and control and well as specialized materials and reactants for across a wide variety of end markets including computer chips and healthcare.
The Safety and Productivity Solutions segment offers personal protective equipment, warehouse automation equipment and software as well as custom-engineered sensors and switches.
| Segment | 2Q FY 2022 Sales, $ MM | Percentage of Sales |
| Aerospace | $ 2,898.00 | 32% |
| Building Technologies | $ 1,531.00 | 17% |
| Performance Materials | $ 2,694.00 | 30% |
| Safety and Productivity Solutions | $ 1,829.00 | 20% |
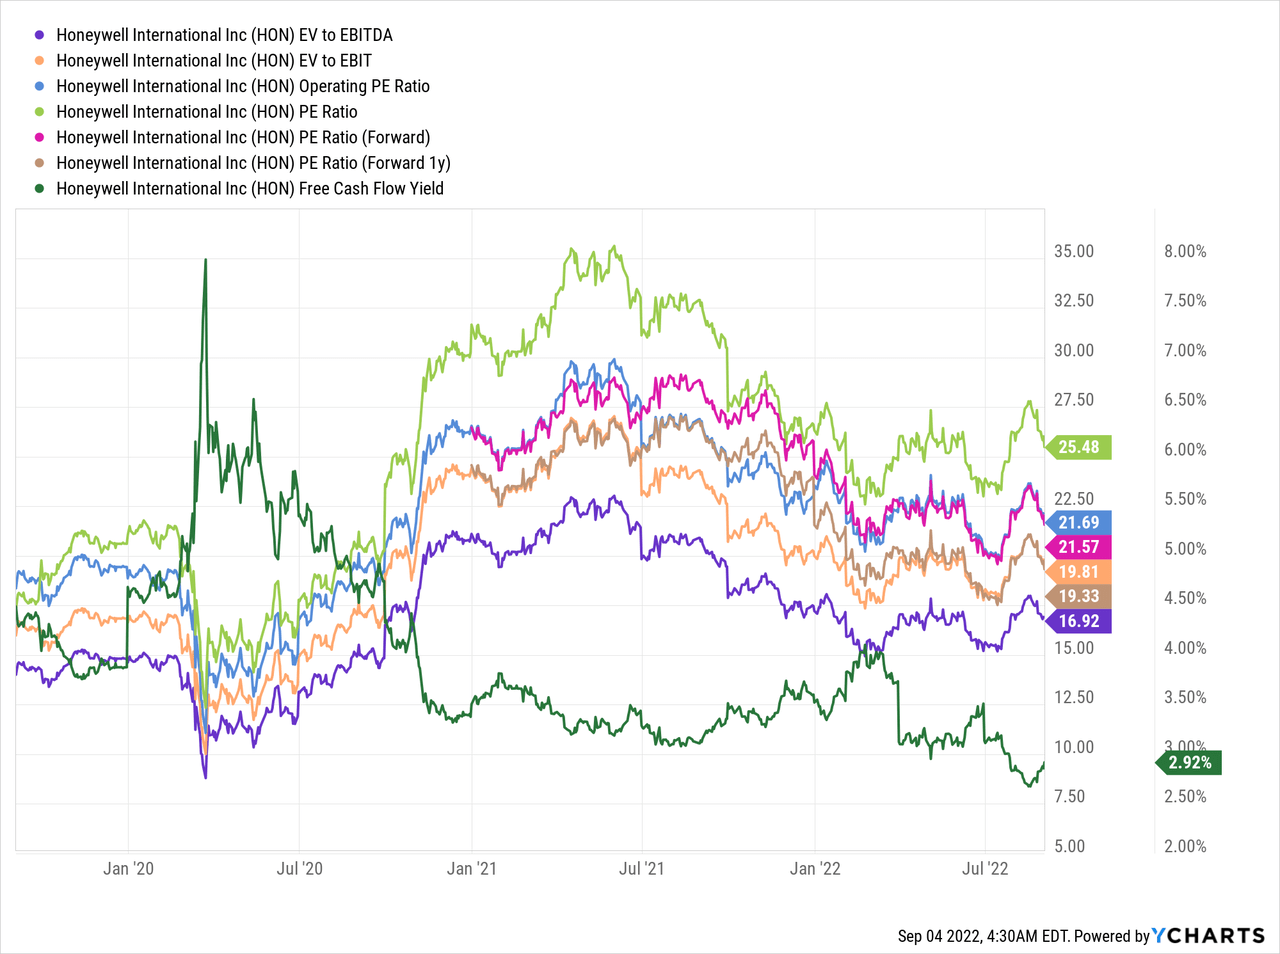
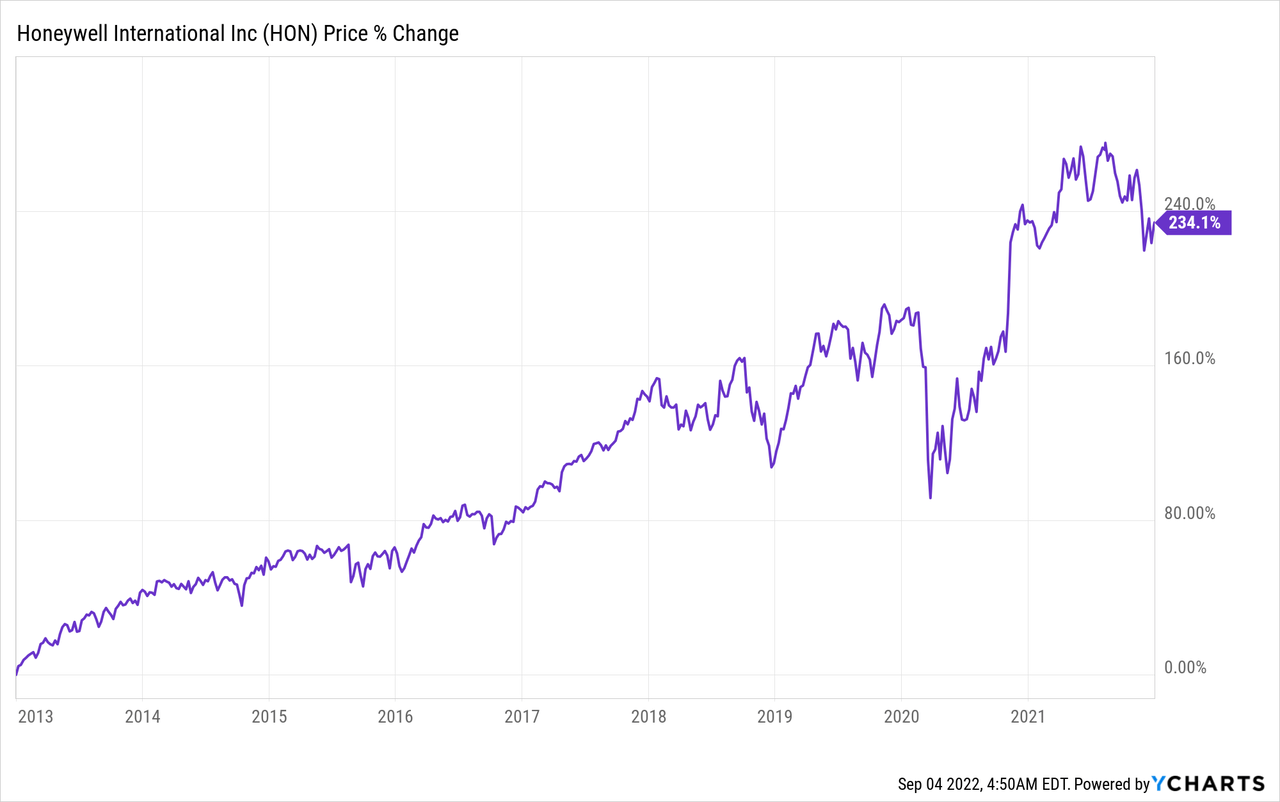
Honeywell’s share price currently sits ~20% off its high reached just over one year ago. However, before the market turned back higher in June shares were lower by around 28%.
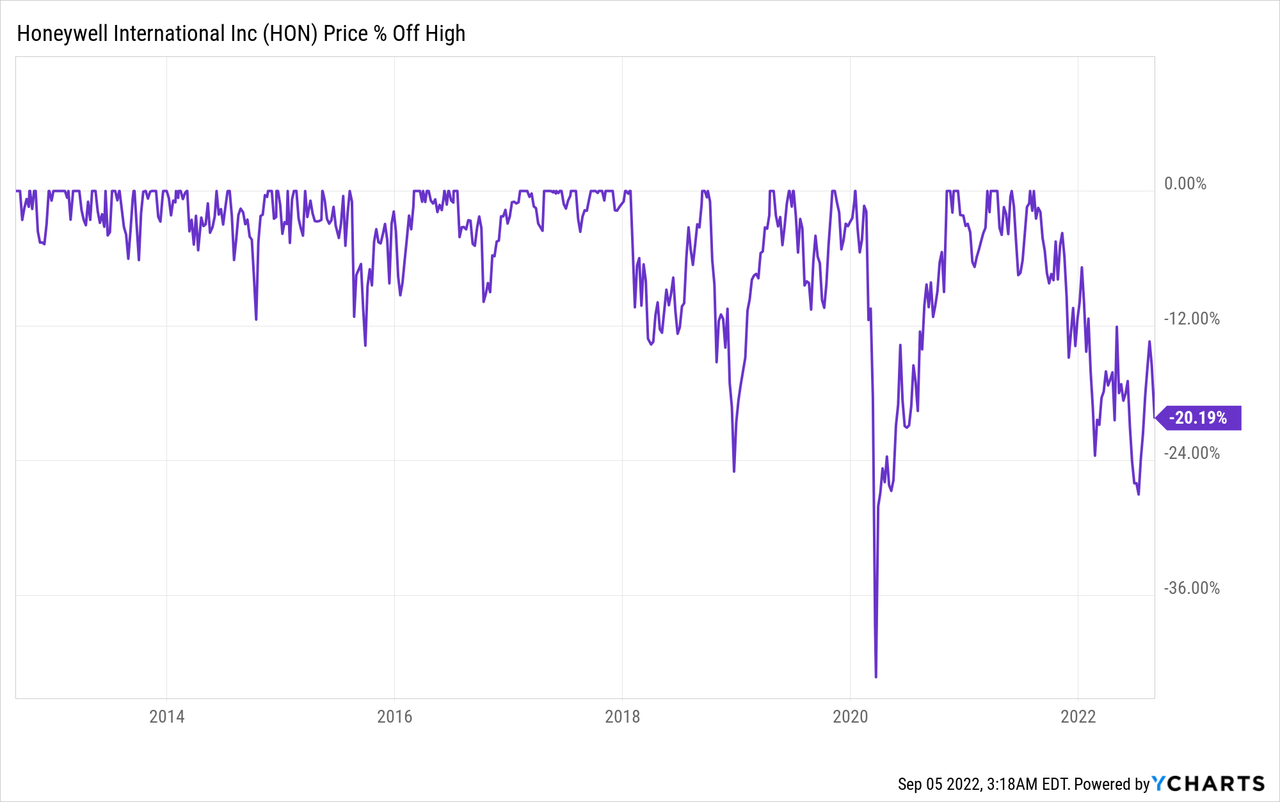
Honeywell’s share price decline has opened me up to the idea of adding a stake in this 100+ year old company that has proven itself through innovation and reinvention over time.
Dividend History
There’s nothing quite like a dividend payment, and a rising one at that, that says a business is doing better and wants to reward its shareholders. That’s why the dividend growth strategy is the one that I gravitated towards when I began investing into individual companies. I mean who doesn’t like receiving cold, hard cash, well more like some bits and bytes now that almost everything is digitized, every three months as a thank you for owning a stake in a business?
Honeywell Dividend History (Honeywell Investor Relations)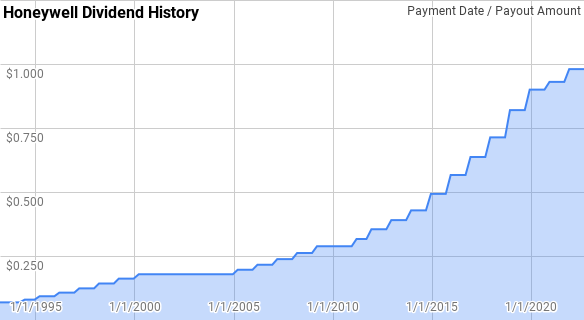
Honeywell has a strong dividend growth history although due to some brief pauses in dividend growth their consecutive years streak sits at 11 year old giving them the title of Dividend Contender. However, dating back to 1993 there’s been no reductions in annual dividends although there has been 5 years with no raises being announced.
Since 1993, year over year dividend growth has ranged from 0.0% to 20.4% with an average of 9.9% and a median of 10.7%.
Over that same time there’s been 24 rolling 5-year periods with Honeywell’s annualized dividend growth coming in between 1.9% to 16.0% with an average and median of 9.6%.
There’s also been 19 rolling 10-year periods since 1993 with annualized dividend spanning from 4.9% to 12.2% with an average of 8.7% and a median of 8.8%.
The rolling 1-, 3-, 5- and 10-year annualized dividend growth rates from Honeywell since 1993 can be found in the following table.
| Year | Annual Dividend | 1 Year DGR | 3 Year DGR | 5 Year DGR | 10 Year DGR |
| 1993 | $0.276 | ||||
| 1994 | $0.308 | 11.69% | |||
| 1995 | $0.371 | 20.41% | |||
| 1996 | $0.428 | 15.38% | 15.77% | ||
| 1997 | $0.495 | 15.56% | 17.09% | ||
| 1998 | $0.571 | 15.38% | 15.44% | 15.65% | |
| 1999 | $0.647 | 13.33% | 14.75% | 15.99% | |
| 2000 | $0.714 | 10.29% | 12.98% | 13.97% | |
| 2001 | $0.714 | 0.00% | 7.72% | 10.76% | |
| 2002 | $0.714 | 0.00% | 3.32% | 7.60% | |
| 2003 | $0.714 | 0.00% | 0.00% | 4.56% | 9.97% |
| 2004 | $0.714 | 0.00% | 0.00% | 1.98% | 8.76% |
| 2005 | $0.786 | 10.03% | 3.24% | 1.93% | 7.78% |
| 2006 | $0.864 | 9.99% | 6.56% | 3.89% | 7.27% |
| 2007 | $0.952 | 10.18% | 10.06% | 5.92% | 6.76% |
| 2008 | $1.047 | 10.00% | 10.06% | 7.96% | 6.25% |
| 2009 | $1.152 | 10.00% | 10.06% | 10.04% | 5.93% |
| 2010 | $1.152 | 0.00% | 6.56% | 7.96% | 4.90% |
| 2011 | $1.304 | 13.22% | 7.59% | 8.58% | 6.21% |
| 2012 | $1.454 | 11.50% | 8.08% | 8.84% | 7.37% |
| 2013 | $1.599 | 9.98% | 11.56% | 8.84% | 8.40% |
| 2014 | $1.778 | 11.16% | 10.88% | 9.07% | 9.55% |
| 2015 | $2.044 | 14.99% | 12.03% | 12.16% | 10.04% |
| 2016 | $2.336 | 14.26% | 13.46% | 12.36% | 10.46% |
| 2017 | $2.623 | 12.30% | 13.85% | 12.53% | 10.67% |
| 2018 | $2.960 | 12.83% | 13.13% | 13.10% | 10.95% |
| 2019 | $3.360 | 13.52% | 12.88% | 13.58% | 11.30% |
| 2020 | $3.630 | 8.04% | 11.43% | 12.17% | 12.16% |
| 2021 | $3.770 | 3.86% | 8.40% | 10.05% | 11.20% |
Source: Author
The dividend payout ratio gives you a glimpse into how safe a company’s dividend is. By comparing it to either profits or free cash flow you can see how much buffer a company has before they don’t earn enough to pay the dividend from what the business earns.
HON Dividend Payout Ratios (HON SEC filings)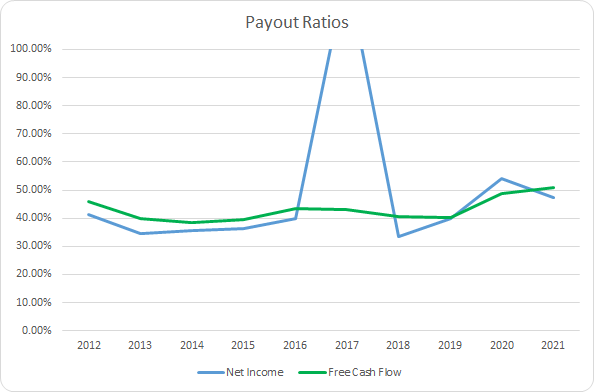
Excluding FY 2017, Honeywell’s net income payout ratio has averaged 40.3% for the last decade with the 5-year average coming to 43.7%. Similarly, the average free cash flow payout ratios are 43.1% and 44.7%, respectively. Honeywell’s dividend has historically been well covered by both net income and free cash flow which has allowed them to raise the dividend each year over that period.
Quantitative Quality
Of course, as a dividend growth investor, I want to see a rising dividend coming back to me year after year. However, my expectation is that quality companies will prove themselves over time and that proof will be laid bare in their business results.
HON Revenue Profits and Cash Flow (HON SEC filings)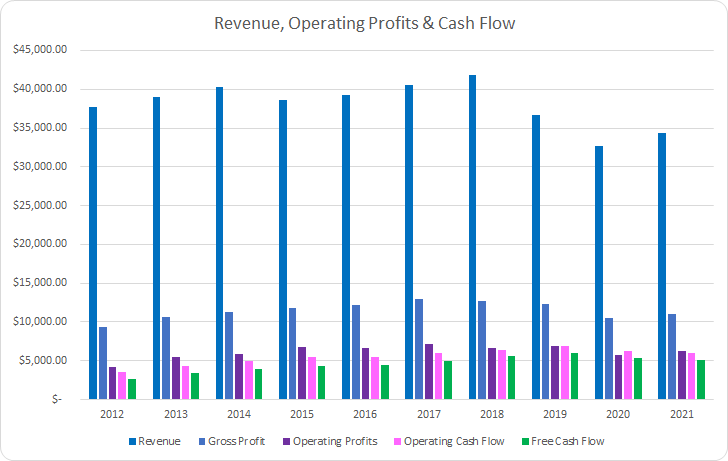
Honeywell’s revenues have actually declined over the last decade falling by 8.7% in total or around 1.0% annualized. Out of context that’s worrisome; however, it’s important to remember that in 2016 they spun off AdvanSix (ASIX), and in 2018, they spun off both Garrett Motion (GTX) and Resideo Technologies (REZI). So a dip on the top line should be expected.
Gross profits have held in surprisingly well showing a 17.3% increase or ~1.8% annualized gain. Operating profits improved by 49.2% or 4.5% annualized with operating cash flow rising by 71.7% or 6.2% annualized. Most impressively, free cash flow increased by 95.3% or 7.7% annualized. Keep in mind that’s in spite of the dip in revenue from the various spin-offs.
Strong businesses should be able to maintain stable or even improve their margins over time. The absolute levels aren’t absolutely critical; rather, the trajectory is what I tend to focus on more. That being said my preference is to see free cash flow margins greater than 10%.
HON Margins (HON SEC filings)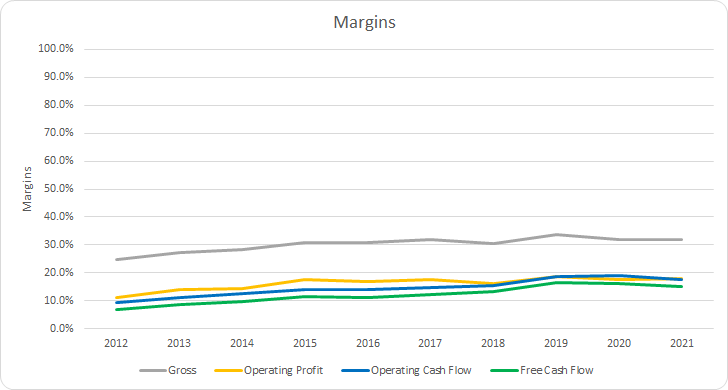
Honeywell has shown steady improvement in their margins over time as one would expect given that profits and cash flow improved while revenues have declined from the spin-offs. Gross margins have averaged 30.2% over the last 10 years with a 32.0% average for the most recent 5 years. Similarly, free cash flow margins have averages of 12.1% and 14.7%, respectively.
I also track how efficient the business is at utilizing its assets and capital by measuring various forms of free cash flow returns. My preference is to see at least 10% free cash flow returns on invested capital with a trend higher over time as the business is able to flex its operational and competitive strengths.
HON Free Cash Flow Returns (HON SEC filings)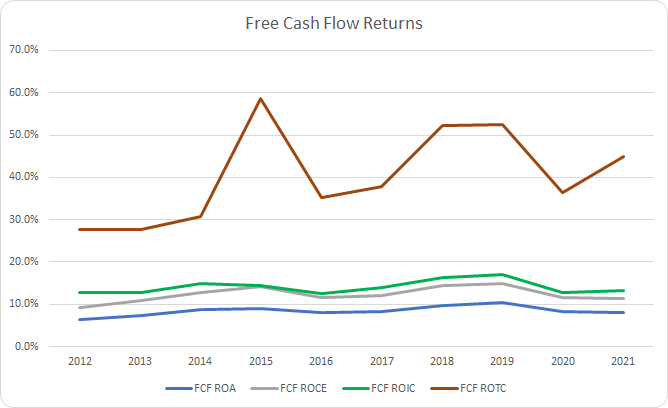
Over the last decade, Honeywell’s FCF ROA has been quite strong with an 8.4% average and an 8.9% average for the last 5 years. Their FCF ROIC has surpassed the 10% level each year with the 10-year average coming to 14.1% and the 5-year average at 14.7%.
To understand how Honeywell uses its free cash flow I calculate three variations of the metric, defined below:
- Free Cash Flow, FCF: Operating cash flow less capital expenditures
- Free Cash Flow after Dividend, FCFaD: FCF less total cash dividend payments
- Free Cash Flow after Dividend and Buybacks, FCFaDB: FCFaD less net cash spent on share repurchases
HON Free Cash Flows (HON SEC filings)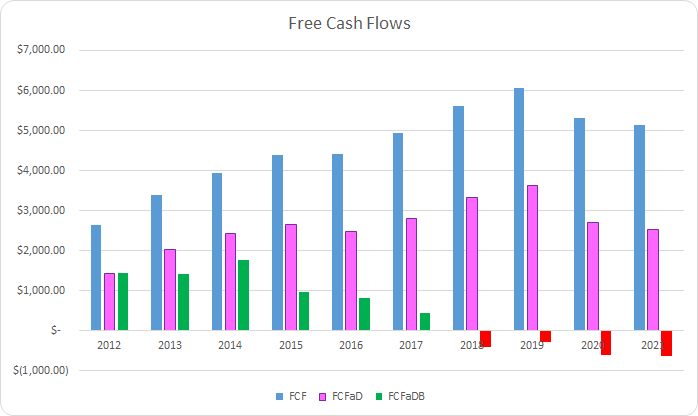
Honeywell has generated a cumulative total of $45.8 B in FCF over the last decade. Considering their market cap was roughly that size ten years ago that’s quite impressive. Honeywell has also paid out a total of $19.8 B to shareholders in dividend payments which brings the cumulative FCFaD at $26.0 B.
Prior to FY 2015 Honeywell didn’t commit a significant portion of free cash flow towards share repurchases; however, there’s definitely been a shift since then with Honeywell regularly spending all of their FCFaD to buy back shares. Over the last decade Honeywell has spent a net total of $21.1 B on repurchases which puts the cumulative FCFaD at $4.9 B.
I would prefer to see more companies utilize special dividends; however, the reality is that buybacks are likely to remain the chosen method. When done at attractive prices share repurchases can add value for shareholders. Of course that comes with the big caveat that in the future shares aren’t issued during times of distress.
HON Shares Outstanding (HON SEC filings)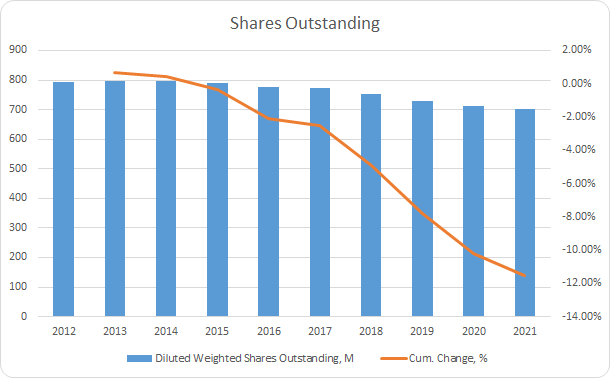
During the last decade Honeywell has allocated slightly more capital to repurchases than towards dividends. Over that time for every net $1 spent on buybacks Honeywell has shipped out ~$0.94 in dividends.
The share count is down 11.6% over that time or around 1.4% annualized. Repurchases have really ramped up between 2018 and 2021 which accounted for a 9.6% reduction in outstanding shares.
When I choose to invest my savings into a business my intention is to own the shares for years and potentially decades. As such the balance sheet, especially the debt, becomes critical to monitor. The debt-to-capitalization ratio gives an idea of the capital structure of the business. Generally I want to see stable levels over time with significant changes being examined further.
HON Debt to Capitalization (HON SEC filings)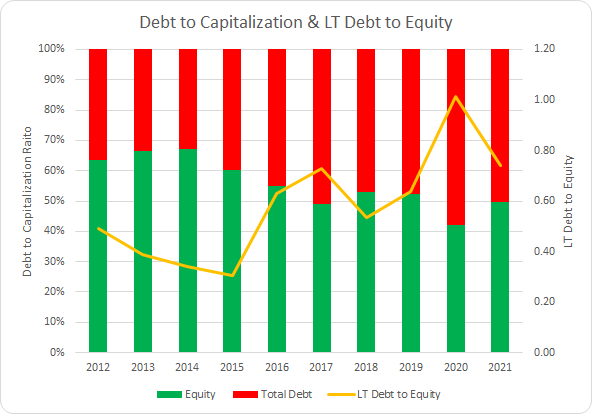
Honeywell has been increasing the level of debt in its capital structure over the last decade; however, it’s still fairly conservative. The 10-year average debt-to-capitalization ratio for Honeywell is 44% with the 5-year average at 51%.
In my opinion the net debt ratios paint a better picture of the debt or leverage that is placed on the business. The capital structure is more of a financing measure; whereas the debt ratios tell you how leveraged the business actually is by comparing the net debt versus some measure of profits or cash flow. A highly leveraged, i.e. high debt ratio business, is at much greater risk of short-term issues developing into long-term equity destruction if the required interest and debt service payments are too much to handle. Even more so if debt market begins to pull back.
HON Debt Ratios and Interest Coverage Ratio (HON SEC filings)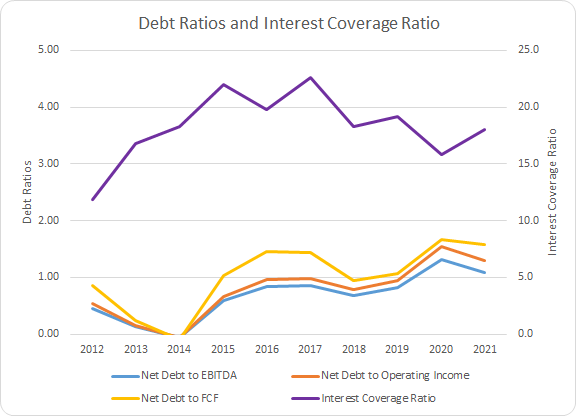
Honeywell still has fairly conservative net debt ratios despite the increase of debt in the capital structure. The 10-year average net debt-to-EBITDA, net debt-to-operating income, and net debt-to-FCF ratios are 0.7x, 0.8x, and 1.0x, respectively. The 5-year averages for each ratio are 1.0x, 1.1x, and 1.3x accordingly. In other words, assuming no material deterioration in Honeywell’s profits and cash flow they could completely de-lever by allocating roughly all profits towards debt reduction for just 1 year.
Valuation
In order to value a potential investment I utilize multiple valuation methods in an attempt to value the business from different perspectives. The methods that I use are dividend yield theory, a reverse discounted cash flow analysis, as well as a minimum acceptable rate of return, “MARR”, analysis.
Dividend yield theory is a quick and dirty valuation method that assumes that investors will value a business such that over time it offers a dividend yield that fluctuates around a given level. In other words it’s a reversion to the mean-based valuation method. For Honeywell I’ll use the 3-year average forward dividend yield as a proxy for the fair value.
Honeywell Dividend Yield Theory (Honeywell Investor Relations and Google Finance)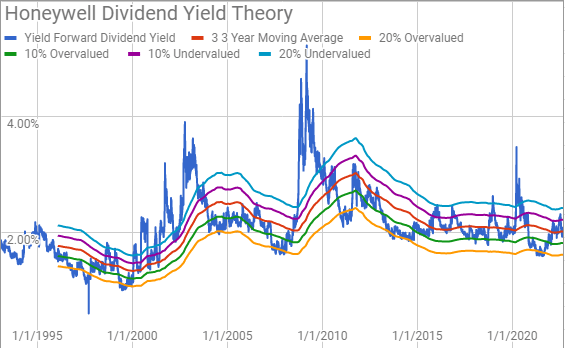
Over the long run Honeywell has been valued such that it offers a forward dividend yield just a hair over 2.0%. The average dating all the way back to 1993 is 2.08%. The yield bands have typically been a solid predictor of at least intermediate term over- and undervaluation.
Currently Honeywell offers a forward dividend yield of 2.10% with the 3-year average at 2.02%.
A reverse discounted cash flow model is a kind of shorthand DCF model that I use to see what kind of growth and margins the business must have in order to generate the cash flows that support the current market valuation. I use it as more of a reality check such that if the business is likely to grow revenues by 5.0% annually, but the reverse DCF shows they need to grow at 15% annually in order to support a certain return level then the business is clearly overvalued.
I use a simplified DCF model built on revenue growth, an initial free cash flow margin of 11.0% that improves to 15% during the forecast period, and a terminal growth rate of 3.0%.
For the discount rate I use an estimated after-tax cost of debt of 1.33% in conjunction with both a 10% and 8% cost of equity. In the case of the 10% cost of equity the WACC/discount rate becomes 8.9% and for the 8% cost of equity it’s 7.1%.
In order for Honeywell to generate the free cash flows that would support the current market valuation it would need to grow revenues 10.4% annually during the forecast period for the 10% cost of equity/8.9% discount rate scenario. With the 8% cost of equity/7.1% discount rate the required revenue growth falls to 4.7% annually during the forecast period.
A MARR analysis entails estimating the future earnings and dividends that a business will produce. You then apply a reasonable, and hopefully conservative, multiple on those future earnings after some timeframe and calculate what the expected return for the investment would be. If the expected return is greater than your required minimum for investment then you can feel free to purchase shares.
Analysts expect Honeywell to show FY 2022 EPS of $8.68 and FY 2023 EPS of $9.64. They also expect Honeywell to be able to grow EPS 9.5% annually across the next 5 years. I then assumed that EPS growth would come to 5.0% annually for the following 5 years. Dividends are assumed to maintain a 45% target payout ratio.
Over the last 3 years Honeywell has seen pretty significant fluctuation in its TTM P/E which has ranged from ~12.5x to ~35.0x. For the MARR analysis I’ll examine terminal multiples spanning 15x to 30x.
The following table shows the potential internal rates of return that Honeywell could provide if the assumptions listed above prove to be reasonable forecasts for the future path of Honeywell. Returns assume that dividends are paid as well as increased along the timeframe that Honeywell has followed and that dividends are taken in cash. The return expectations assume that shares are purchased at $186.89, Friday’s closing price.
| IRR | ||
| P/E Level | 5 Year | 10 Year |
| 30 | 21.2% | 13.4% |
| 25 | 16.4% | 11.4% |
| 22.5 | 13.7% | 10.3% |
| 20 | 10.8% | 9.0% |
| 17.5 | 7.6% | 7.7% |
| 15 | 4.0% | 6.1% |
Source: Author
Additionally I use the MARR analysis framework to work backwards in order to determine what price I could pay for shares today if the EPS and dividend growth plays out as forecast across the range of terminal multiples. My base hurdle rate is a 10% IRR and for Honeywell I’ll also examine 12% and 8% return thresholds.
| Purchase Price Targets | ||||||
| 10% Return Target | 12% Return Target | 8% Return Target | ||||
| P/E Level | 5 Year | 10 Year | 5 Year | 10 Year | 5 Year | 10 Year |
| 30 | $286 | $248 | $266 | $213 | $308 | $289 |
| 25 | $241 | $212 | $224 | $183 | $259 | $247 |
| 22.5 | $219 | $194 | $203 | $168 | $235 | $226 |
| 20 | $196 | $177 | $183 | $153 | $211 | $205 |
| 17.5 | $174 | $159 | $162 | $137 | $187 | $185 |
| 15 | $151 | $141 | $141 | $122 | $163 | $164 |
Source: Author
How Did We Get Here?
The share price for a business fluctuates significantly more than the underlying business. As such I want to try and distill out the business justified returns versus the change in investor sentiment over time.
From December 31, 2012 through December 31, 2021 Honeywell’s share price rose from $62.41 to $208.51 which is good for a 234.1% total rise or a 12.8% CAGR. Including the dividend Honeywell’s CAGR was ~15.3% over that time.
In order to break down the returns I’ve separated them into business returns (sales growth and margin change), capital allocation returns (dividend and share count change), and change in sentiment (change in P/E multiple). It’s not perfect but it should give a rough idea of the justified returns from the business.
As we saw earlier sales have declined by 8.7% in total or -1.0% annual return contributions over that timeframe. Meanwhile the net profit margin improved by 107.4% adding 8.1% to the annualized returns bringing the business returns to 7.1% annualized.
The capital allocation returns have been roughly a +1.3% annualized boost as the share count has fallen due to the repurchases. Dividends, of course, are always a positive source of returns and based on the yield at the beginning of the period of 2.5% that puts the total capital allocation returns at +3.8%.
The P/E multiple rose from ~16.9x to ~26.4x or roughly a 56.0% increase. That works out to a +4.4% annualized contribution to investor sentiment.
Approximately 47% of the returns were from business growth with 25% attributed to capital allocation. The remaining 29% came from sentiment change.
| Annualized Returns | % of Returns | |
| Business Returns | 7.1% | 47% |
| Capital Allocation Returns | 3.8% | 25% |
| Sentiment Change | 4.4% | 29% |
| Total Annualized Returns | 15.3% |
Looking forward I would expect sales growth to be a tailwind over time especially compared to the prior decade. However, net margin likely isn’t to be as big of a contributor although I would expect it to still be a plus over time.
Dividends are currently at a 2.1% contribution and my expectation is for anywhere between 1-3% annual contribution from share repurchases. For sentiment change I wouldn’t bank on a 4.4% annualized contribution and wouldn’t be surprised to see it be a headwind on future returns.
HON How Did We Get Here? (HON SEC Filings)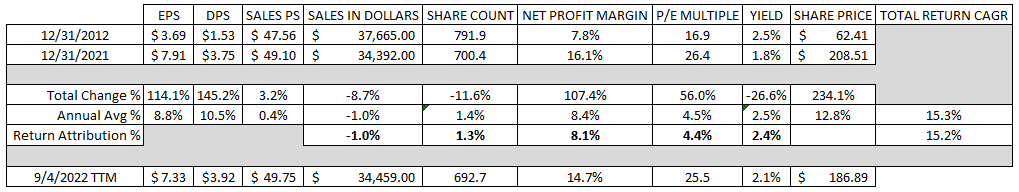
Conclusion
Honeywell is a diversified industrial conglomerate with ties to many sectors of the economy including aerospace, building technologies, safety and productivity, and performance and specialty materials. The diversified nature of their business helps to stabilize the business as a whole whenever certain segments of the economy slow down.
Honeywell has actually seen its revenues decline over the last decade; however, that’s due to the various spin-offs completed during that time. Despite what is effectively flat revenue during the last ten years Honeywell’s margins have shown very solid improvement which in conjunction with share repurchases led to nearly 9% annual EPS growth.
Honeywell is able to turn a fair amount of sales into free cash flow with their free cash flow margin now in the mid-teens and trending higher over time. Similarly, Honeywell’s FCF ROIC had been trending solidly higher prior the pandemic impact for FY 2020 and FY 2021 although it’s since pulled back. Over time though Honeywell has earned solid returns with ROICs coming in >10% each year for the last decade.
Dividend yield theory suggests a fair value range between $177 and $216. Although Honeywell should announce an increase to their dividend in October. If the dividend is increased to $1.05 per share per quarter the fair value range would increase to between $189 to $232.
Meanwhile the MARR analysis shows a fair value between $174 and $219 over the next 5 years assuming a 17.5x to 22.5x terminal multiple for 10% annualized returns. For a 12% return target the fair value range drops to $162 and $203 if you maintain the multiples; meanwhile at an 8% return target the fair value rises to $187 to $235.
The reverse DCF analysis suggests that 10% returns are probably unlikely unless you expect a pretty dramatic increase in margins. The required growth rate is quite high at 10.4% annually during the forecast period. Although 8% returns do appear much more realistic with just 4.7% required growth with the respective margin improvements.
One thing to note is that the reverse DCF does not account for share repurchases which I fully expect to continue moving forward. The average FCFaD for the last 3 fiscal years as well as the TTM period comes to $2.48 B. With the market cap currently around $127.6 B they could retire approximately 1.9% of outstanding shares.
One potential issue that Honeywell is likely having to deal with is their size. At over $34 B in TTM revenues it’s hard to meaningfully grow at a rapid pace. However, that size does bring in safety as they have long standing relationships and wide economic diversification.
Honeywell Innovation (HON Investor Conference March 2022)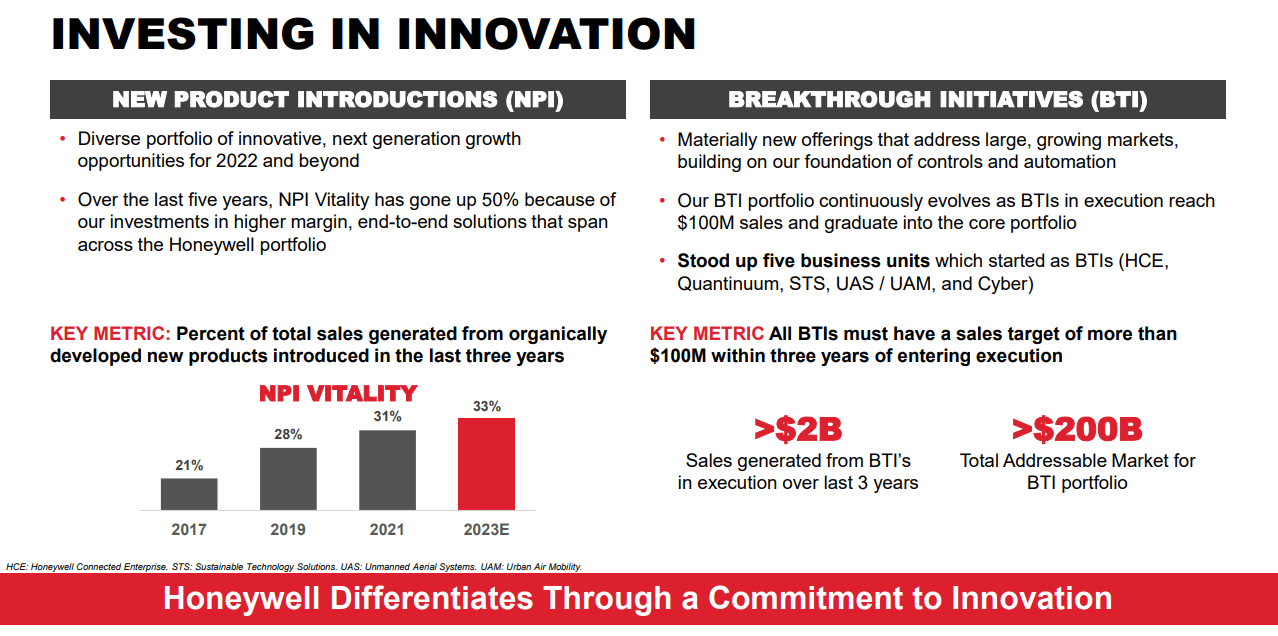
It’s quite impressive though that Honeywell estimates that for FY 2023 they will see 33% of sales generated from new products introduced within the last 3 years. Those new products come from their Breakthrough Initiatives or BTI. Of course they have to search out for larger and larger market opportunities for their BTIs.
In my opinion, the Honeywell Connected Enterprise, HCE, is an interesting opportunity as it’s a software based sub-segment that focuses on improving productivity and safety for customers. Stacking SaaS offerings that improve customers’ performance on top of the physical solutions that Honeywell is already providing should do wonders for Honeywell as it should come with high margins and recurring, sticky revenue.
Honeywell HCE (HON Investor Conference March 2022)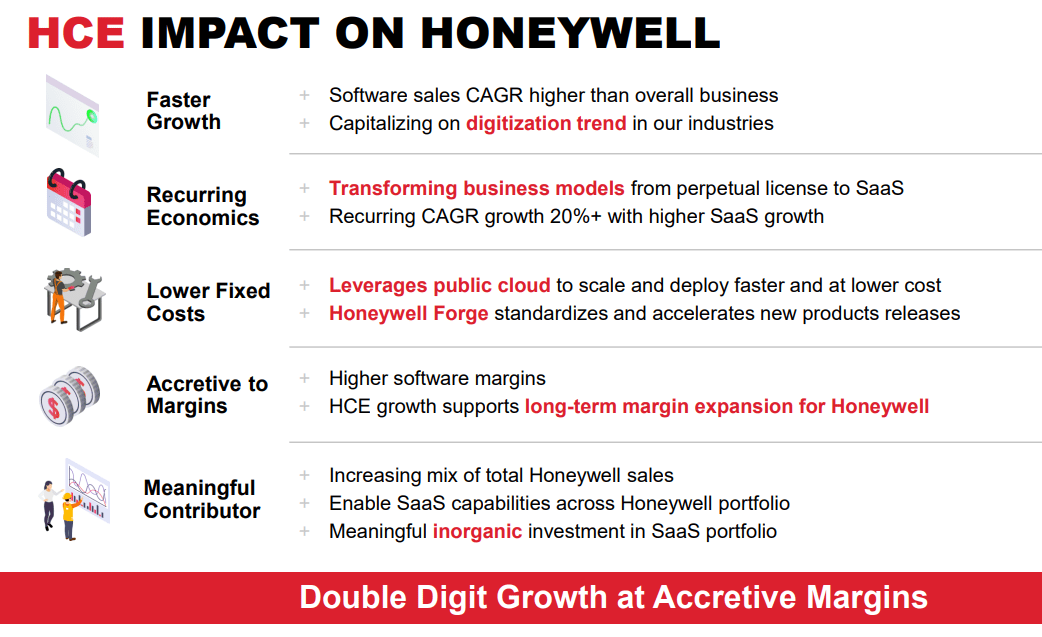
Additionally with the 2Q 2022 earnings release in July management is forecasting strong organic growth from three segments although the fourth is likely to be down mid-single digits.
HON 2Q 2022 Earnings Presentation – Segment Outlook (HON 2Q 2022 Earnings Presentation)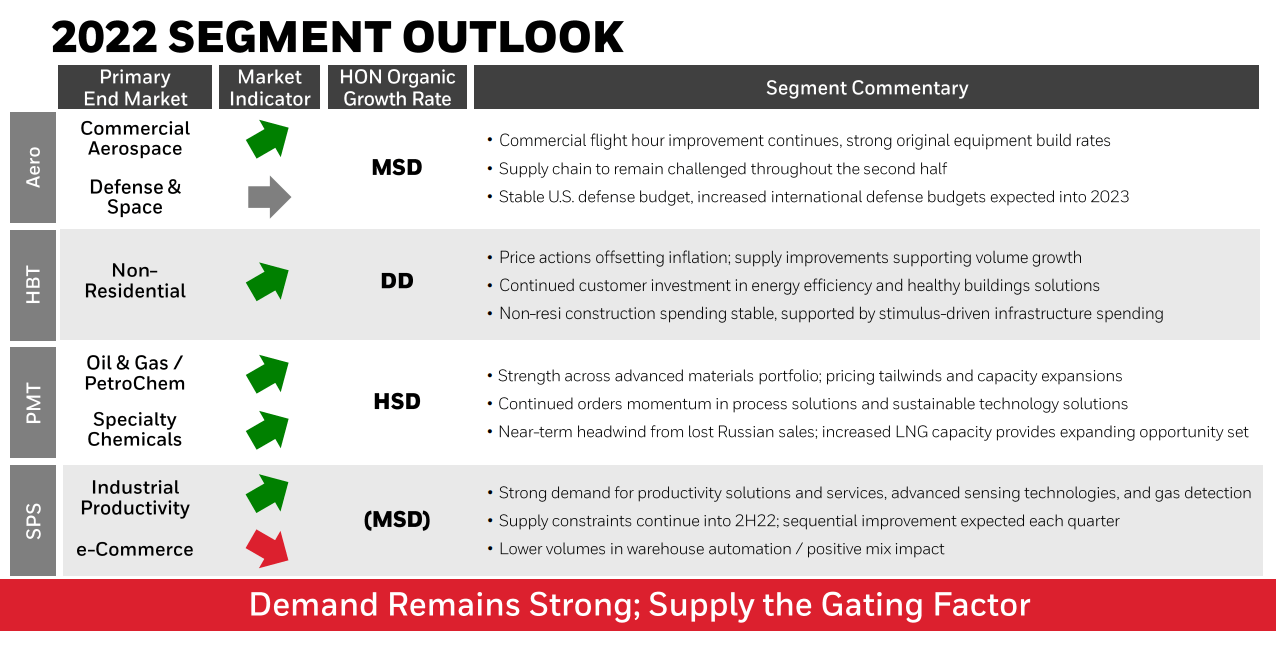
Honeywell looks intriguing here as the valuation appears quite reasonable. I don’t think I’d say it’s necessarily cheap; however, I do think a purchase around these levels is likely a fair price to pay for this great buy & forget industrial conglomerate.
Be the first to comment