

piranka
DISCLAIMER: This note is intended for US recipients only and, in particular, is not directed at, nor intended to be relied upon by any UK recipients. Any information or analysis in this note is not an offer to sell or the solicitation of an offer to buy any securities. Nothing in this note is intended to be investment advice and nor should it be relied upon to make investment decisions. Cestrian Capital Research, Inc., its employees, agents or affiliates, including the author of this note, or related persons, may have a position in any stocks, security, or financial instrument referenced in this note. Any opinions, analyses, or probabilities expressed in this note are those of the author as of the note’s date of publication and are subject to change without notice. Companies referenced in this note or their employees or affiliates may be customers of Cestrian Capital Research, Inc. Cestrian Capital Research, Inc. values both its independence and transparency and does not believe that this presents a material potential conflict of interest or impacts the content of its research or publications.
The Tooth Fairy Has Been Busy
Since maybe 2014-15, Amazon (NASDAQ:AMZN) has operated on the basis that the AWS line of business generates enough cashflow to fund the growth of the retailer side of the business. A quick look at Amazon financial statements right now says that the rules of the game at Amazon have changed.
AMZN Financials (Ycharts.com, Cestrian Analysis)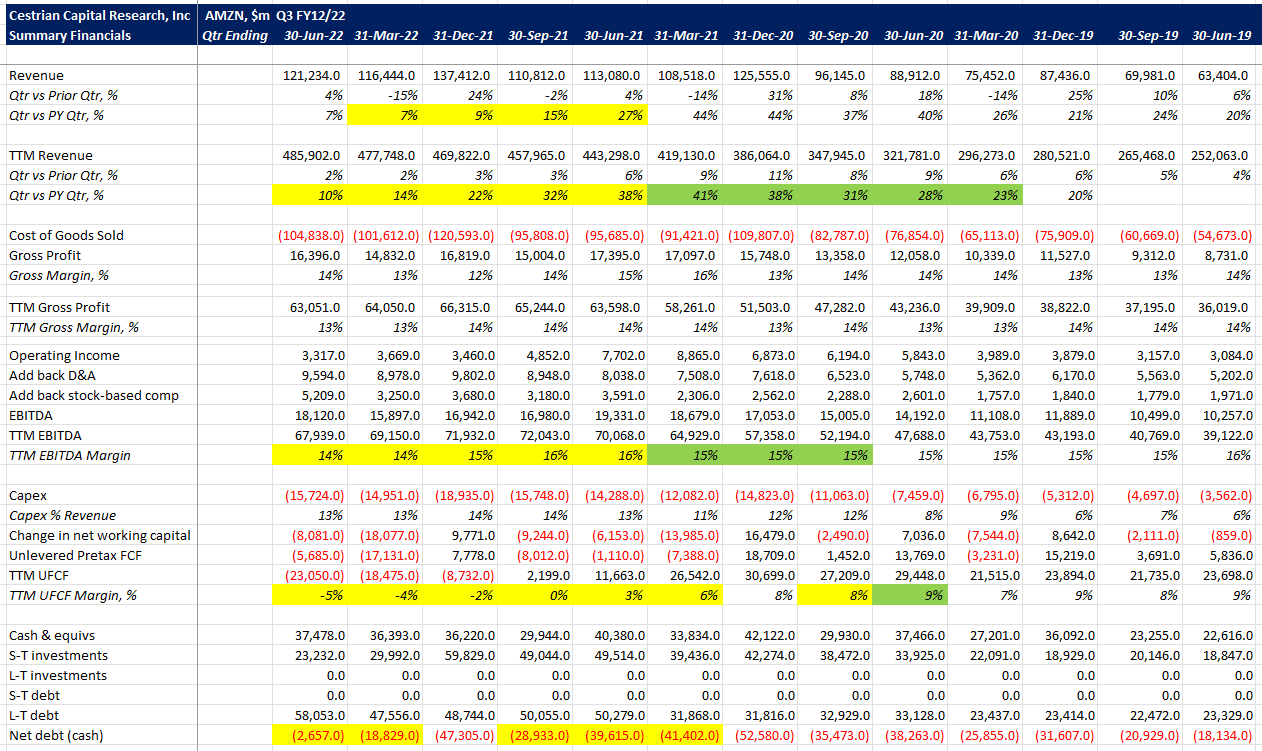
Revenue growth is slowing, EBITDA margins are declining and cashflow margins have been negative and getting more so for some time now. In addition the net cash balance is dwindling.
Not pretty.
The valuation reflects that. No problem to buy AMZN on negative cashflows when the company was growing like a weed. Not so compelling now.
AMZN Valuation (YCharts.com, Cestrian Analysis)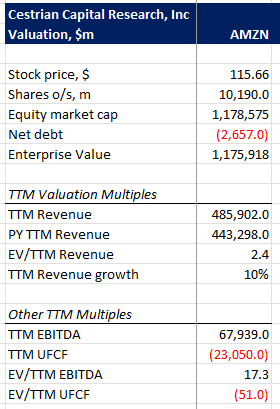
Let’s take a look at the stock chart. (You can open a full page version of this chart, here.)
AMZN Chart (TrendSpider, Cestrian Analysis)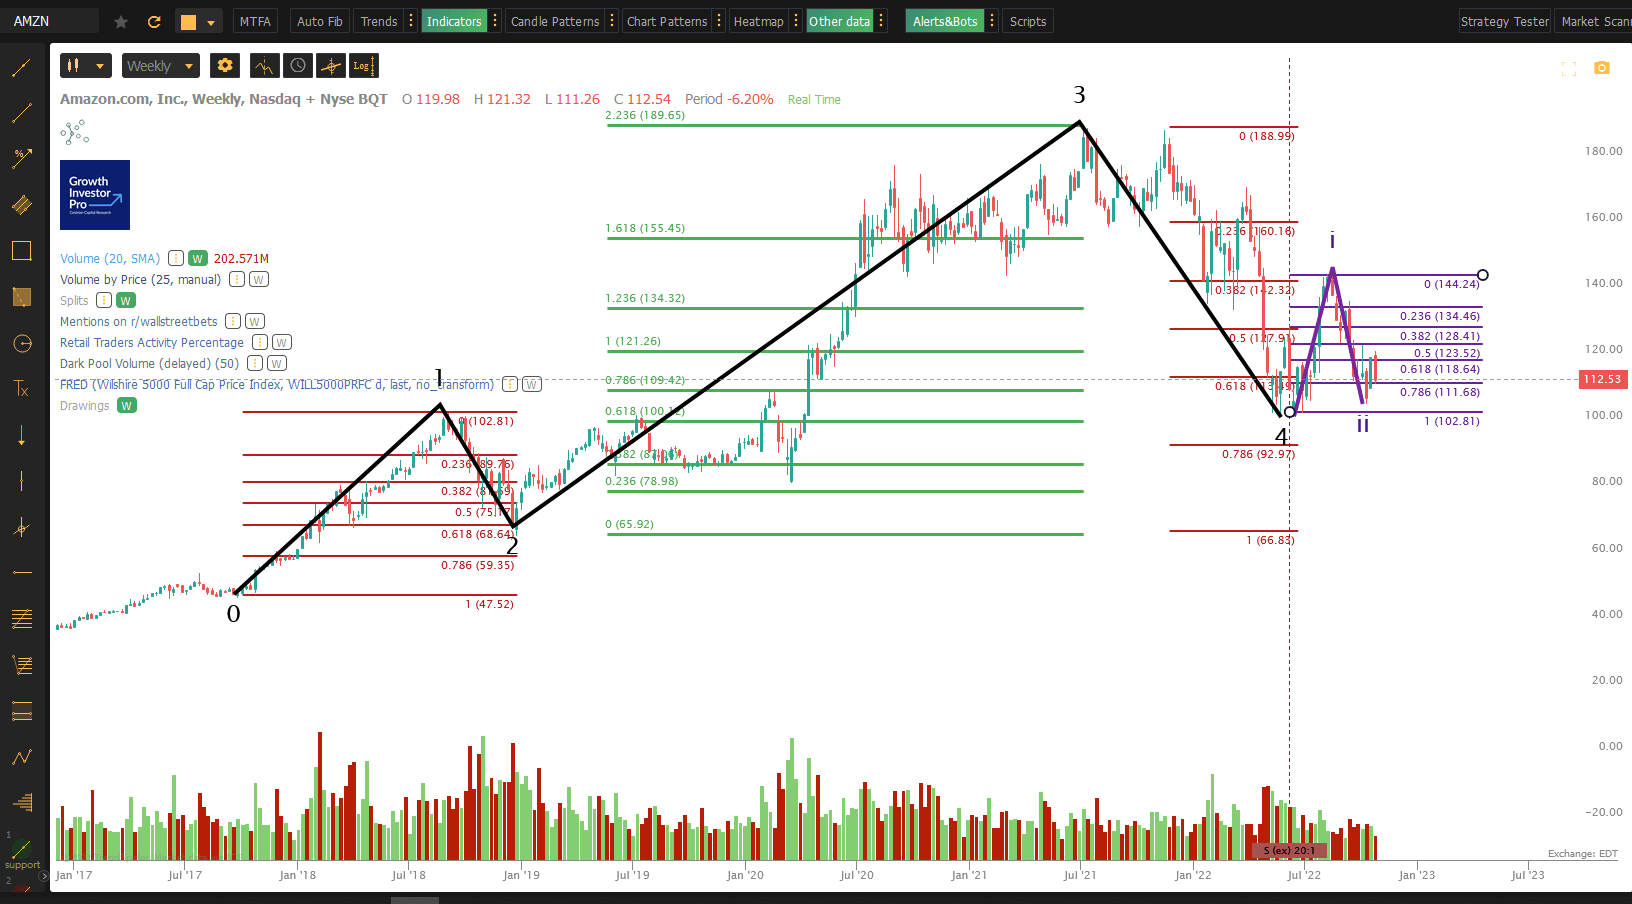
The chart is more bullish than one might expect from the fundamentals. From Q3 2017 the stock puts in a Wave 1 up, retracing back into a 61.8% Wave 2 low at the end of 2018 when the Fed last tried to raise rates. Then a Wave 3 up peaking at the 2.236 Fib extension of Wave 1 in mid 2021. (Just as Jeff Bezos quit!). A deep Wave 4 has followed which thus far bottomed in June this year right around those Wave 1 highs. Since then the stock has attempted a Wave 5 up, putting in a 1-2 smaller degree up then down move. On technicals? That’s not a bad bullish setup.
On fundamentals? Urgh.
So, conclusion? Do nothing. Hold rating. Plenty of upside ahead if it starts moving upwards.
Cestrian Capital Research, Inc – 27 October 2022.
Be the first to comment