

cemagraphics/E+ via Getty Images
This article was first released to Systematic Income subscribers and free trials on June 11.
Welcome to another installment of our BDC Market Weekly Review, where we discuss market activity in the Business Development Company (“BDC”) sector from both the bottom-up – highlighting individual news and events – as well as the top-down – providing an overview of the broader market.
We also try to add some historical context as well as relevant themes that look to be driving the market or that investors ought to be mindful of. This update covers the period through the second week of June.
Be sure to check out our other Weeklies – covering the CEF as well as the preferreds/baby bond markets for perspectives across the broader income space. Also, have a look at our primer of the BDC sector, with a focus on how it compares to credit CEFs.
Market Action
The BDC sector was down on the back of an unexpectedly high CPI print, which pushed the broader income space into a risk-off mode. The CPI index increased by 1% in May (8.6% on a year-over-year basis) on the back of a surge in energy and grocery prices. Like a high-performance athlete, inflation will likely peak over an extended period, rather than climb down quickly as many have expected.
Despite its higher-beta profile, however, the BDC sector outperformed the broader income space due to the continued rise in short-term rates. 2Y Treasury yields rose by a massive 0.4% to above 3%. This move suggests that the market thinks the Fed will likely move the policy rate faster and higher. This should support BDC income levels, given the sector primarily holds floating-rate assets.
Year-to-date, the BDC sector is down about 6%, which is actually pretty good. By contrast, the Loan CEF sector is down around 13% or more than twice as much.
Systematic Income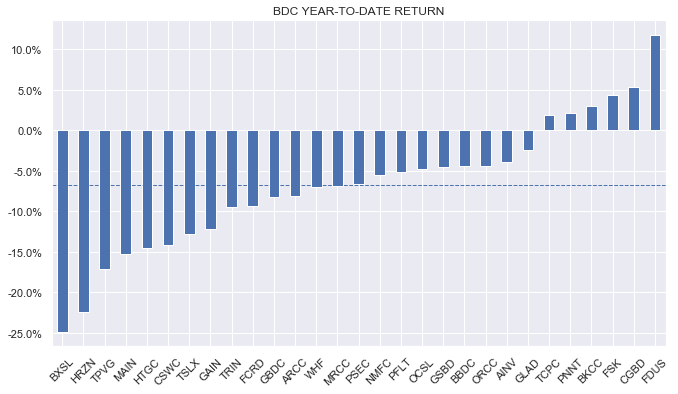
The current average valuation of the sector (in our 29-name coverage universe) is 96% (current median valuation is 94%). This stands below the historic average of around 102%. The sector valuation has only been significantly below its current 96% figure during periods of serious distress such as the GFC, the Euro crisis, the Energy crash and the COVID crash.
Systematic Income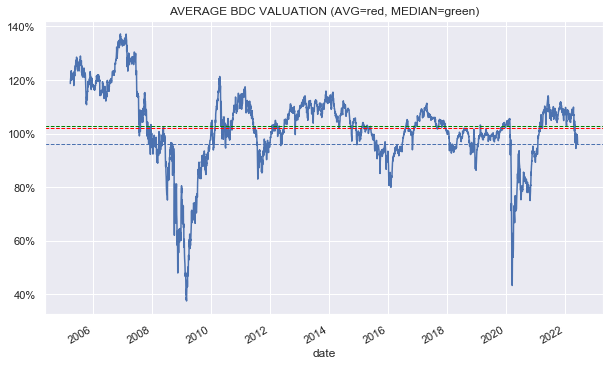
Market Themes
It’s always interesting when income sectors popular with retail investors get a look in the financial press. The other week, an FT newsletter highlighted BDCs as a window into the relatively opaque and larger private debt market.
Its conclusions were in part on the basis of the following selection of the larger BDCs – the screenshot below is from their (possibly paywalled) commentary. The goal here was to “get some sense of how the market assesses the riskiness of private debt”.
FT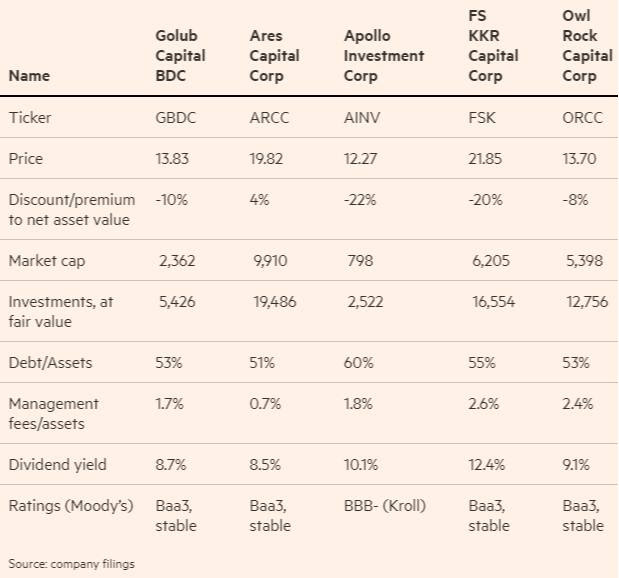
The FT’s first conclusion by looking at this subset is to say that because some of these BDCs trade at “meaty” discounts to NAV suggests “some anxiety about credit quality in the portfolios” as do dividend yields north of 8%.
As most BDC investors know, the BDC market is about an order of magnitude larger than this sample, making it pretty unrepresentative even if it does cover the larger BDCs. This makes it very difficult to get a sense of the broader BDC space, much less the much larger private debt space, from such a small window.
Specifically, when this commentary was published, the average BDC valuation was around 98% which suggests very little concern, in aggregate, about BDC portfolios.
And as it happens, two of the five BDCs, (FSK) and (AINV), in the sample above are some of the worst historic performers, which explains why they continue to trade at significant discounts to NAV. (ORCC) does not have a long track record as a public entity, but it has also significantly underperformed the sector over its short public life. (GBDC) has put up strong longer-term returns, but has underperformed over the last few years, primarily because of its rights offering during the COVID crash. (ARCC) is the only clear outperformer in the sample.
It’s also important to point out that making conclusions about the BDC sector on the basis of valuation snapshots is not very strong analysis. For instance, the newsletter suggests that ARCC is a strong BDC because it trades at a premium. However, as recently as just a few weeks ago, the ARCC valuation dipped as low as 93% before recovering. An “analysis” on the grounds of a 93% valuation might have concluded that investors are seriously worried about the ARCC portfolio, which would have been incorrect.
The other comment had to do with yields being north of 8% as indicative of anxiety about BDC sector portfolio risk. The fact is that for a loan portfolio that is leveraged 2x (i.e. debt / equity = 2x) it doesn’t take a very high yield on underlying assets to generate net investment income of 8%. For an average BDC, that requires a yield of around 7.5% on its underlying assets. This is pretty much where the high-yield corporate bond market trades. And while it’s true that this yield is above the current yield of the publicly traded loan space, it obviously doesn’t include the fact that BDCs often work closely with their borrowers to drive performance, something which obviously doesn’t happen in public markets.
The conclusion of the newsletter was that we should look to the weaker BDCs to anticipate any broad-based weakness in the world of private credit. However, the performance of weaker and stronger BDCs have not been very well aligned over the past while – weak BDCs performed poorly in good and bad markets while strong BDCs have performed very well in strong markets and fell but eventually recovered during downturns. In short, there is no direct link between weaker and stronger BDCs. Clearly, a massive downturn will hit everyone (though to a different degree) but that’s not an interesting insight.
Overall, our view is that there are better ways to track potential challenges in the BDC space, such as via unrealized / realized losses and increases in non-accruals and PIK income, among others.
Market Commentary
Horizon Technology Finance Corp (HRZN) is issuing a 6.5% 2027 baby bond (HTFC). It’s odd that some BDCs still continue to issue into the baby bond market rather than doing a standard institutional bond. It’s possible that because HRZN doesn’t have an investment-grade rating (a proper one that is – it has BBB from Egan Jones) they feel the need to instead issue to retail, but it’s not clear they are getting a great deal there. The 6.5% coupon is roughly equivalent to a BB- / B+ corporate bond rating – surely they could get a better rating from a major agency. It’s possible that institutional investors are passing on the company’s debt (at a reasonable coupon) which then raises the obvious question why.
The company’s portfolio is 95% secured loan and its historic total NAV return is in line with the sector average. The timing is obviously bad, given corporate yields have closed to doubled over the last 12 months. A 6.5% yield for 5-year maturity is reasonably attractive in this environment from a risk like HRZN. To get some intuition, if we remove the ABS-financed assets from the portfolio, assume a recovery of 51% on the remaining assets and pay off the $138m of credit facility then the bonds are made whole. Below a recovery of 51%, the bonds start taking losses. That feels pretty decent, especially given that secured loans have tended to recover around 70%. The consensus is that loan recoveries will be closer to 50-60% going forward, given the loosening in covenants. Private companies also don’t have bonds ahead of loans in the capital structure, which could push recoveries a bit lower than their publicly traded counterparts. It’s also true that the portfolio is heavy on Technology companies, which don’t actually tend to have a lot of hard assets to secure the loans.
That said, we don’t need the recovery there to be all that high if we can assume that not 100% of the portfolio will actually default – a pretty safe assumption. Also keep in mind that the standard asset coverage number is not going to be very insightful for BDC baby bonds because of the presence of secured credit facilities that are ahead of the unsecured bonds in the payoff waterfall. Asset coverage numbers don’t tell them apart, i.e., the same asset coverage number can lead to a very different outcome for unsecured holders depending on the size of the secured facility ahead of them.
Stance And Takeaways
We continue to have a constructive view on the BDC sector. The fact that the broader macro picture is fairly robust, if slowing, and short-term rates keep moving higher are two key supports for the sector.
Our BDC sleeve in our High Income Portfolio is about flat for the year. It has outperformed the sector since inception in late 2021 by around 7%.
At current valuations we see value in Carlyle Secured Lending (CGBD), trading at an 11.4% dividend yield and an 82% valuation as well as the Golub BDC (GBDC), trading at an 8.8% dividend yield and an 89% valuation.
Be the first to comment