

da-kuk/E+ via Getty Images
This article was first released to Systematic Income subscribers and free trials on Mar. 22
Welcome to another installment of our BDC Market Weekly Review where we discuss market activity in the Business Development Company sector from both the bottom-up – highlighting individual news and events – as well as the top-down – providing an overview of the broader market.
We also try to add some historical context as well as relevant themes that look to be driving the market or that investors ought to be mindful of. This update covers the period through the third week of March.
Be sure to check out our other Weeklies – covering the CEF as well as the preferreds/baby bond markets for perspectives across the broader income space. Also, have a look at our primer of the BDC sector with a focus on how it compares to credit CEFs.
Market Action
BDCs had a strong week with about three-quarters of the sector finishing in the green. Month-to-date, HRZN has underperformed due to a public offering while FDUS is leading with a very strong Q4.
Systematic Income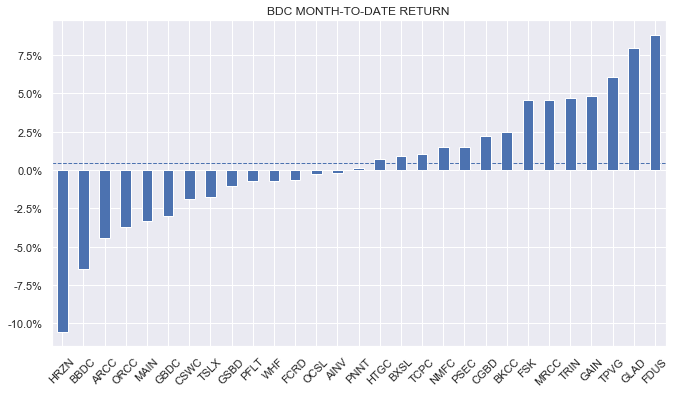
On a monthly basis, BDCs have clocked in a marginally positive return, not much higher than in January and February which have been flat.
Systematic Income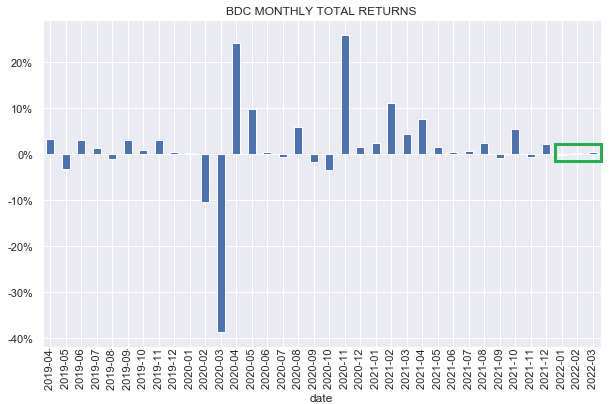
Year-to-date BDCs have outperformed the broader income space, partly on the back of strong Q4 results as well as support from a more hawkish turn by the Fed.
Systematic Income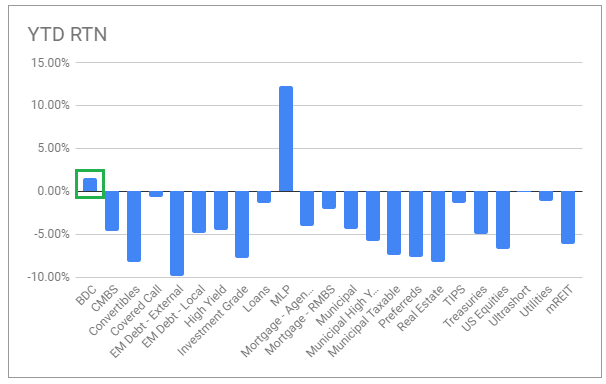
The median Fed dot plot has risen to near 2% for 2022 and 2.75% for 2023 (though the Fed Funds futures are more skeptical). Although historically the dot plot has overestimated the eventual number of hikes, if the current dot plot is anywhere near reality, then the BDC sector stands to benefit from a strong income tailwind given its primarily floating-rate asset profile.
Systematic Income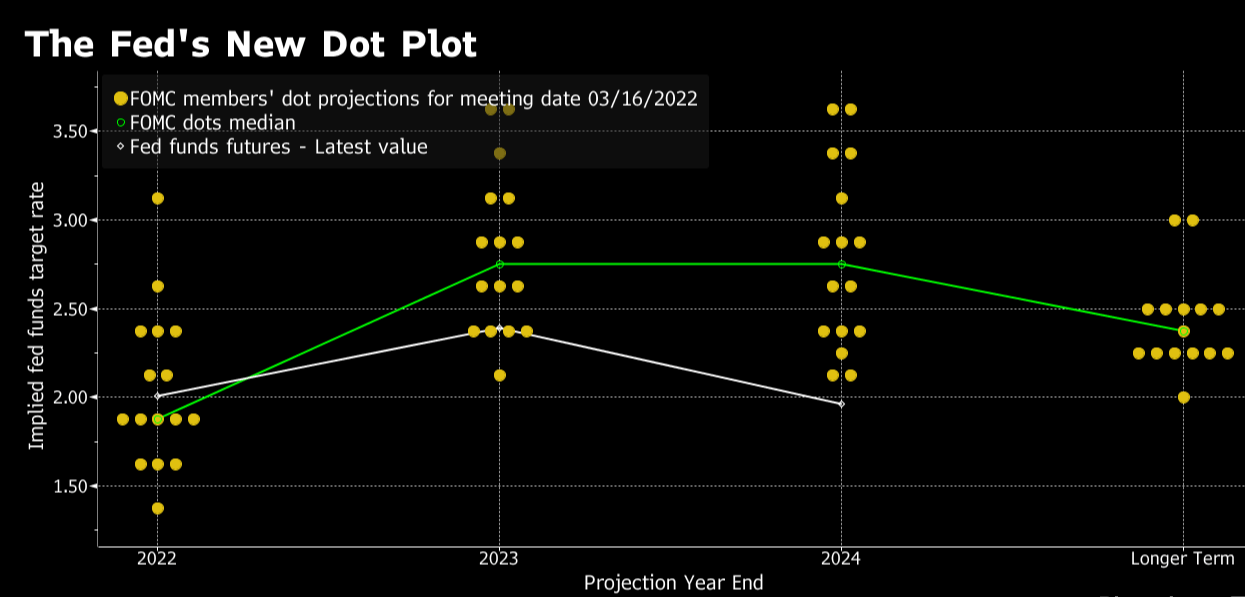
Market Themes
One of the questions for BDC investors is whether to go with a “big boy” brand name or a boutique manager when allocating to BDCs. What we mean by a “big boy” is a BDC that operates within a much larger asset management organization.
The following is a list of BDC that we would consider falling into this bucket:
- Apollo Investment Corp (AINV) – managed by an affiliate of Apollo Global Management – a $500bn investment management firm.
- Ares Capital Corp (ARCC) – a subsidiary of the $300bn alternative investment manager Ares Capital.
- Barings BDC (BBDC) – part of a $390bn asset manager – a subsidiary of MassMutual.
- BlackRock Capital Investment Corp (BKCC) – managed by a subsidiary of BlackRock – a $10trn investment manager.
- Blackstone Secured Lending Fund (BXSL) – managed by a subsidiary of Blackstone Credit which oversees $150bn of assets.
- FS KKR Capital Corp (FSK) – a partnership between FS Investments and KKR Credit – a subsidiary of KKR & Co – a $470bn investment manager.
- Goldman Sachs BDC (GSBD) – advised by GSAM which oversees more than $1trn of assets.
- Oaktree Specialty Lending Corp (OCSL) – advised by Oaktree Capital Management which oversees $160bn of assets.
- TCG BDC (CGBD) – managed by a subsidiary of The Carlyle Group – a $300bn alternative investment manager
The intuition of sticking with a BDC that falls under a larger family umbrella is pretty strong.
A “big boy” investment manager is typically better known than a smaller boutique one. This “brand name” recognition might make borrowers more willing to work with it and/or willing to pay a bit more to borrow from it. This can also be entirely rational since a larger manager would have more resources to assist the borrower in their operations, particularly, if the borrower hits a rough patch.
A “big boy” manager is likely to have a bigger network with which to source attractive lending opportunities either due to extra internal resources and/or a relatively long history of operating in money management. For example, half of the originations in Q4 by FSK came from companies previously invested in by KKR.
A “big boy” manager is also likely to take advantage of research / due diligence carried out by its larger umbrella organization – in effect, getting quality pro-bono work. For example, while ARCC has, by BDC standards, a very large number of investment professionals at 145, it also benefits from an additional 615 people across the broader Ares Management platform.
A “big boy” manager is also likely to get support from its umbrella organization whether through additional financing or through asset support. For example, CGBD received a preferred allocation from its Carlyle affiliate during the COVID shock which, in the absence of conversion (ruled out by the CEO), is a form of pretty cheap equity. Separately, Barings BDC has a credit support agreement from its parent Barings LLC on its MVC legacy portfolio which limits shareholder downside.
A “big boy” manager can also participate in larger transactions carried out by its parent without taking on excessive concentration risk. For example, due to its size, BlackRock can make a big loan which it can then spread across its investment vehicles. Recent examples were a loan to Hanna Andersson and OpenMarket Inc. with smaller pieces taken by BCIC – the BKCC joint venture.
Let’s see how “big boy” BDCs look relative to the sector from a performance perspective. The chart below shows 3Y and 5Y total NAV returns, sorted by 3Y returns, with the “big boy” BDCs highlighted.
Systematic Income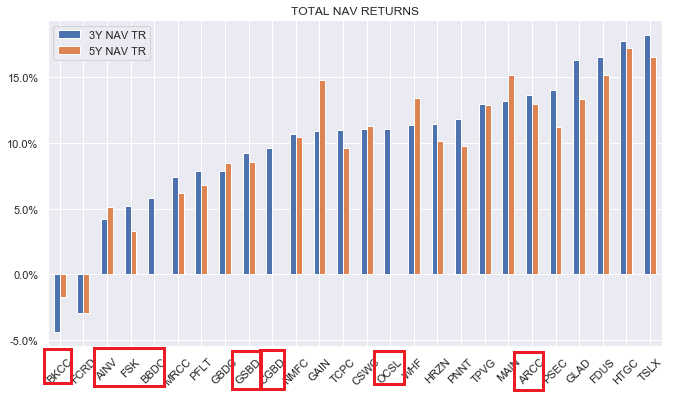
The chart suggests that the “big boy” BDCs have tended to underperform the broader BDC sector. Some of this is, arguably due to a different allocation profile. “Big boy” BDCs tend to have lower equity allocations (causing a drag in what has been a strong equity market environment) and a more diversified focus (which would have underperformed those BDCs that have a higher equity and a Tech focus).
At the same time, the underperformance appears to be excessive even when taking these factors into account. Specifically, four of the bottom 5 performers are all “big boy” BDCs. And while, as investors are well aware, historic returns don’t predict future ones, credit firms tend to see relatively high serial correlations in their returns – another way of saying that past and future returns tend to look more similar than if they were due to random noise. This is because historic credit problems tend to persist over time as problem credits, that find their way into the portfolio because of lax underwriting standards, get worse over time.
It’s not all bad, however. Two “big boy” BDCs – OCSL and ARCC have put up strong returns and are generally regarded as running very high-quality portfolios and underwriting processes. The main takeaway here is that while “big boy” BDCs do have some advantages they don’t appear to be decisive in driving strong and consistent book value returns. This suggests investors should largely focus on other BDC features in their allocations.
BDC Tool Updates
We recently added a couple of new metrics to the investor BDC Tool on the service. First is the quarterly total NAV return for the past 4 quarters. It provides a quick snapshot of the trend in returns over the last 4 quarters as well as how recent returns stack up relative to the sector.
Systematic Income BDC Tool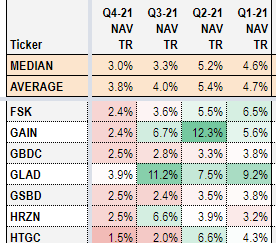
The other update was the addition of total dividends paid for the last 5 calendar years which provides a quick way to see the trend in dividends. It doesn’t break down regular from specials so some of the companies like CSWC or TSLX will be somewhat noisy.
Systematic Income BDC Tool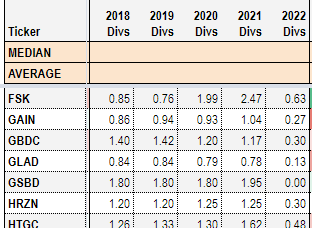
Stance and Takeaways
BDC valuations bounced higher this week as the broader income market recovered. From a longer-term perspective current sector valuation is on the expensive side though not extreme. We expect market volatility to remain amid the uncertainty of the impact of the geopolitical crisis on both inflation as well as the broader macro picture. This suggests investors may want to remain patient with some of the more expensively-valued names in the sector.
Systematic Income BDC Tool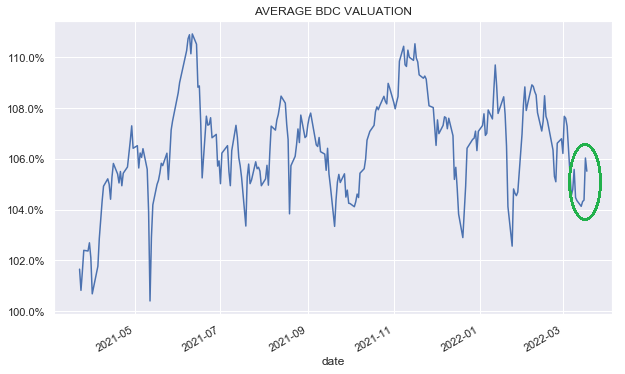
At current valuations we find value in the TCP Capital Corp (TCPC), trading at an 8.84% yield and a 95% valuation as well as the Fidus Investment Corp (FDUS), trading at a 10.82% yield and a 98% valuation.
Be the first to comment