

KanawatTH
Written by Nick Ackerman, co-produced by Stanford Chemist. This article was originally published to members of the CEF/ETF Income Laboratory on October 21st, 2022.
Bancroft Fund (NYSE:BCV) is pushing towards its historically deep discount. It is trading at a discount deeper than the average over the last decade. Albeit, this is a fund that regularly trades at a discount. I suspect the distribution policy of this fund of lower regular quarterly distribution with a large year-end to top off their minimum policy is to blame. Investors typically want high distributions all the time, even throughout the year.
In more recent years, it was starting to get rid of that discount when convertibles were working well. Some of the convertibles that were issued over the last several years have zero or almost zero yields to them. In a rapidly rising rate environment, that means the bulk of the returns would have to come from appreciation. Now that growth no longer matters to investors, though, the fund has struggled as asset prices collapse.
For a longer-term investor, that could still present an opportunity, but it could take a while. Essentially, we are waiting for the Fed to get data that shows they can pivot and stop being aggressive. At that point, the current discount might or might not be available. An additional positive for the fund could be that as these convertible bonds mature, they should receive par back to reinvest in higher-yielding investments once the portfolio starts to turn over.
Since the last time we covered the fund, the discount had gone from almost 9% at that time to now just over 14%. That’s generally a natural occurrence in closed-end funds during times of volatility. As interest rates rise, the costs of leverage employed by CEFs can also rise. So that can be a reason to discount a CEF too.
For BCV, though, they carry fixed rate Series A 5.375% Cumulative Preferred Shares (BCV.PA) as leverage. While it is an elevated cost of capital, it is fixed, and that means no impact from the Fed raising rates.
However, that discount widening can explain some of the underperformance between the fund and the broader market since our last update. Of course, the S&P 500 isn’t a benchmark, but it can help provide context. Heavier allocations to more growth-oriented companies – those that would be able to find willing buyers in the last couple of years for their growth prospects – are another large contributor to the type of performance we are seeing.
BCV Performance Since Previous Update (Seeking Alpha)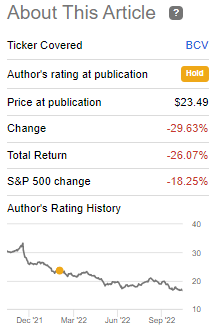
The Basics
- 1-Year Z-score: -1.29
- Discount: 14.04%
- Distribution Yield: 7.74%
- Expense Ratio: 1.16%
- Leverage: 22.04%
- Managed Assets: $142.36 million
- Structure: Perpetual
BCV’s investment objectives are “…providing income and the potential for capital appreciation; which objectives the Fund considers to be relatively equal over the long term.” Their approach is quite simple; they “operate as a closed-end, diversified management investment company and invest primarily in convertible securities…”
With BCV, it is always worth pointing out the small size of the fund. That can make it more difficult for larger retail investors to take sizeable positions – at least if one would try to take a sizeable position all at once. The average daily trading volume comes to around 12.5k a day. It would then also mean the exit door is quite small when trying to exit a position too.
Additionally, the fund’s leverage ratio is now elevated. This has been a function of the declines we’ve seen in the fund YTD. However, it is still a rather modest level of leverage, relatively speaking. As we touched on above, it is also fixed-rate leverage, so no surprises on leverage costs are coming for this fund.
Performance – Deep Discount
One of the more interesting prospects of this fund, and the key reason to focus on CEFs, is the fund’s discount. At this current level, we are now trading at a wider average discount than we’ve seen in the last decade. Of course, we can see that a discount of 16% around 2013 to 2016 was fairly prevalent. In the COVID Crash, we even see the usual discount spike we’ve seen from so many other funds.
Ycharts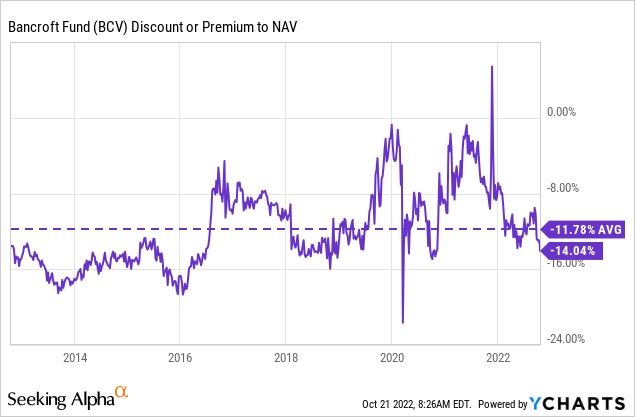
The last decade may not be the most appropriate period, given the new interest rate regime. Fortunately, BCV is an old fund, and we can see some history through the 90s and just where the discount averaged at that time.
Ycharts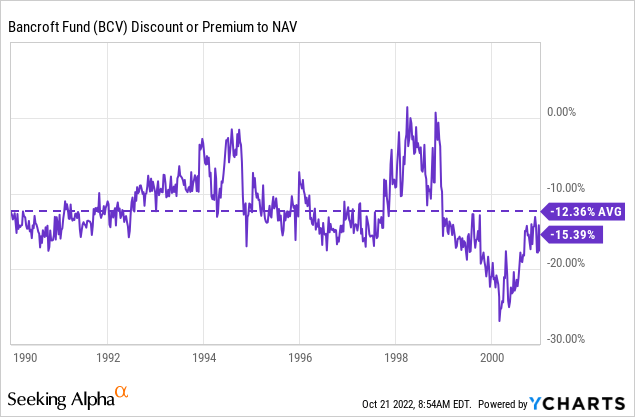
Of course, they were coming off of higher interest rates in the 80s. Presumably, the convertible bonds they were holding then were still yielding some significant rates at that time. So it isn’t a perfect comparison, but it can provide some more context behind the fund and how it traded even in other decades besides just the last decade. Below is a chart of the effective Fed funds rates. I think it just highlights how no period is truly the same.
Ycharts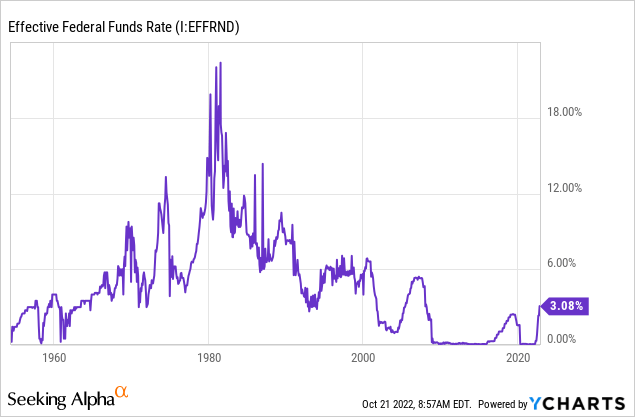
For historical annualized comparisons, the fund has done okay relative to the benchmarks that it selects. Of course, for the last year, that has really meant poor results. Longer-term, the results have been comparable. Once again, equities did well during the last decade to help contribute to these results.
BCV Annualized Returns (Gabelli)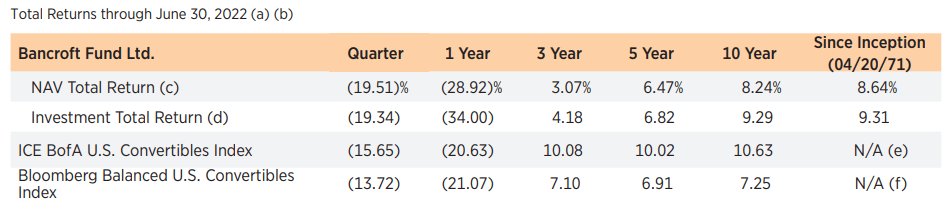
Distribution – 5% Minimum Policy
One of the ways that BCV is run is through this minimum distribution policy. Several of the Gabelli funds operate with this approach. For BCV, it is a 5% minimum policy that they’ll distribute out to investors annually. Sometimes it’s much higher, but that’s the lowest it will be. It is achieved through what is generally smaller quarterly distributions and then a larger year-end.
BCV Distribution History (CEFConnect)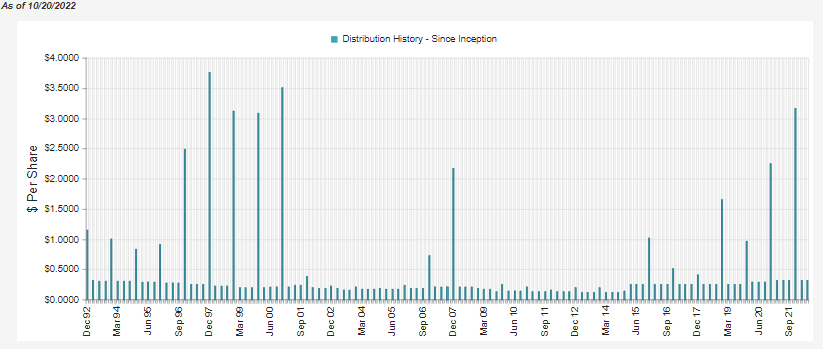
At this time, the share price distribution rate comes to 7.74%, with a NAV rate of 6.66%. Therefore, we are already over this minimum policy at this time. That could mean that unless there is a sharp rebound or they realize significant gains that they have to pay out, the minimum could already be met.
Given their last available semi-annual report shows that they didn’t cover the distribution to shareholders, it would suggest that having too many gains realized won’t be a problem this year. That being said, this period also reflects the large year-end payout of the previous year.
At $2.85 and roughly 5,517,786 shares outstanding at the end of October 2021, that would account for a significant $15.726 million of the $19.375 million paid out. Adjusting for that large year-end would suggest that capital gains covered the regular payout.
The low net investment income is a testament to how little convertible bonds are paying out.
BCV Semi-Annual Report (Gabelli)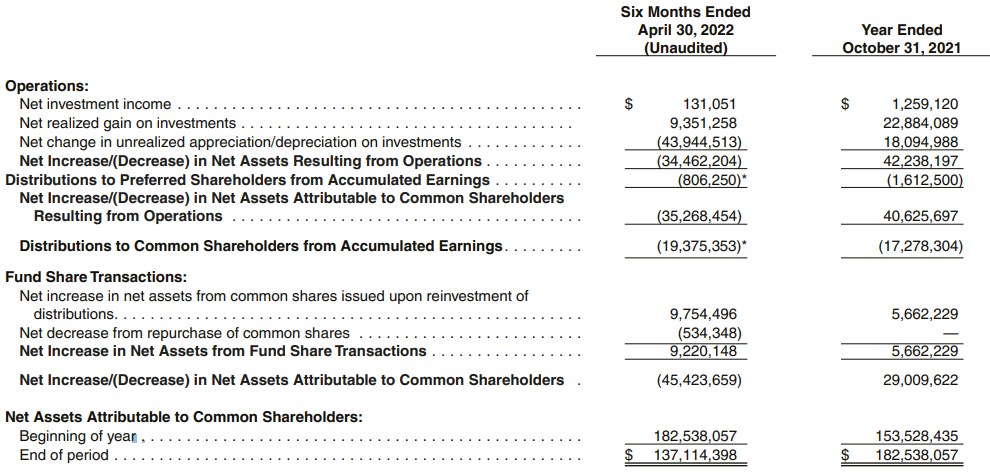
All this could suggest that no year-end could be coming. At the same time, the declines also make the current distribution which would have been seen as low previously, as being more attractive.
BCV’s Portfolio
BCV isn’t just a pure-play convertible fund, but it is heavily geared toward convertibles. The breakdown in the last holdings report showed: 84.5% in Convertible Corporate Bonds, 0.3% in Convertible Preferred Stocks, 11% in Mandatory Convertible Securities, 2.8% in common stocks and 1.4% in U.S. Government Obligations. Overall, the portfolio is tilted more towards tech-oriented sectors such as “computer software & services,” which makes up the largest industry.
BCV Top Sector Exposure (Gabelli)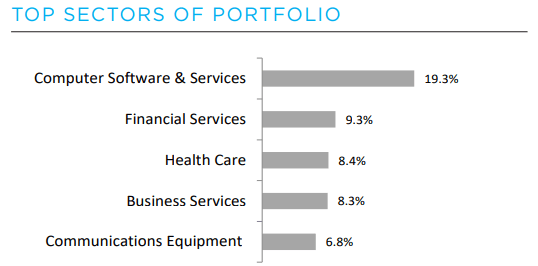
When looking at the top positions, we can get a better grasp on the types of holdings they carry – plus the paltry yields. Paltry yields for now as companies could sell convertibles with these types of terms previously. With current interest rates, that isn’t the case.
BCV Top Ten Holdings (Gabelli)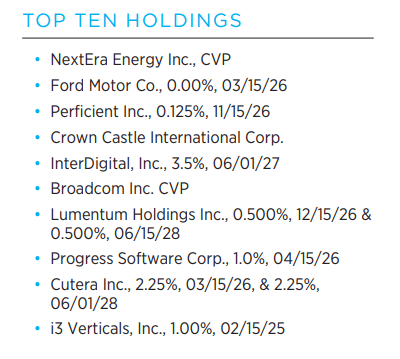
Right in the top ten, we can see that BCV is holding a Ford (F) convertible bond with a 0% coupon. We also have Perficient, Inc. (PRFT) with a 0.125% rate and Lumentum Holdings (LITE) at 0.5%. Most investors are probably pretty sure of Ford’s business; they produce at least a couple of vehicles a year (1.9 million vehicles in 2021, which was a decline due to supply chain issues.)
PRFT is a tech company that provides digital consultancy services and solutions. LITE is a tech company that manufactures and sells optical and photonic products around the globe.
While I’m a shareholder of Ford, the share price obviously hasn’t been performing well, and that impacts the valuation of the underlying convertible being carried by BCV. Here is the share price performance over the last year of these.
Ycharts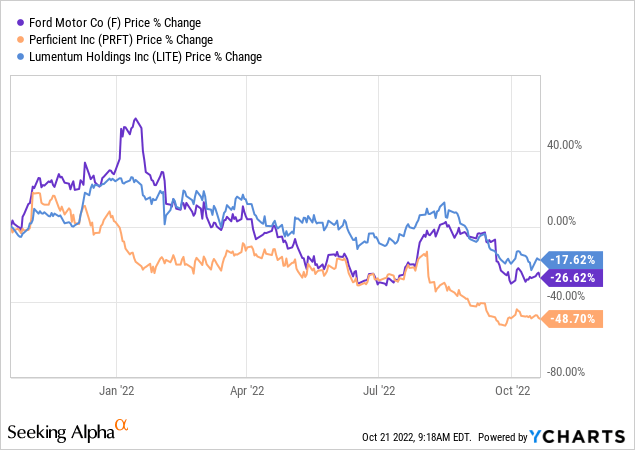
At the end of April 30th, 2022, the cost for the bonds was $3,844,711, with a market value of $3,732,750. Unfortunately, the principal amount is only $3.5 million. Since that time, the value of these would have dropped even further.
On the other hand, the Perficient cost was $3,643,519 with a market value of $3,238,125 and a principal amount of $3.75 million. The good news here is that it means that there is some upside left if it is just held to maturity at the end of 2026. Unfortunately, it isn’t very much upside from the cost of the fund. Given the amount of time the fund is holding this position, unless the stock blasts off higher once again, it could mean little return was generated. This is certainly possible, but it would seem improbable in the current environment.
While that is an example of a convertible not maturing until 2026, other holdings expire earlier in 2023 and 2024. When those do, they have a good chance of putting that capital back to work in higher-yielding instruments, or we could be out of this bear market. That would also help the fund as equity prices appreciate.
Conclusion
Heading into 2022, BCV and other convertible funds found their portfolios unraveling much of the gains they saw in the prior years when convertibles were booming. They were booming because growth was taking off. Now that has reversed, and growth isn’t in fashion with interest rates rising materially. While it doesn’t mean that there isn’t more pain to come, it is starting to look attractive as holdings drop below their par value.
Be the first to comment