

EXTREME-PHOTOGRAPHER
Earnings of BCB Bancorp, Inc. (NASDAQ:BCBP) will most probably be flattish to slightly down this year relative to last year. The average net interest margin will likely be lower, which will pressurize earnings. On the other hand, loan growth will support the bottom line. Further, the provisioning for loan losses will likely remain subdued following the fourth quarter’s surprisingly good performance. Overall, I’m expecting BCB Bancorp to report earnings of $2.52 per share for 2023, down 2% year-over-year. Compared to my last report on the company, I’ve reduced my earnings estimate as I’ve decreased my margin estimate. The year-end target price suggests a high upside from the current market price. Therefore, I’m maintaining a buy rating on BCB Bancorp.
Revising Downwards the Margin Estimate After 4Q’s Disappointing Performance
Surprisingly, BCB Bancorp’s net interest margin slipped in the last quarter of 2022 by 42 basis points, after rising by a total of 72 basis points in the second and third quarters of the year. The reason behind the sudden and sharp trend reversal was a massive surge in the average deposit cost. As mentioned in the earnings release, the total cost of interest-bearing liabilities increased by 82 basis points to 1.46% in the fourth quarter of 2022. In comparison, the fed funds rate increased by 125 basis points during the quarter. This means that the deposit beta (rate sensitivity) was quite high during the quarter.
The deposit beta may be even higher during the first quarter of 2023 because the deposit mix deteriorated through the last quarter of 2022, whose full-quarter impact will be visible in the ongoing quarter. The proportion of non-interest-bearing deposits dropped to 21.8% by the end of December 2022 from 22.5% at the end of September 2022.
In my last report on the company, I had anticipated the margin to remain unchanged from the third quarter’s level of 4.18%. Following the fourth quarter’s disappointing performance, I’ve decided to reduce my margin estimate for 2023. I’m now expecting the margin to decline by 10 basis points during 2023 to an average of 3.6% for the full year.
Loan Growth Likely to Drop Closer to the Historical Level
BCB Bancorp’s loan growth remained unusually high during the fourth quarter of 2022 and beat my expectations. The portfolio surged by 9% during the quarter, taking full-year loan growth to a massive 32%. The outlook for loan growth appears bright, but not as bright as last year because of higher interest rates this year. Fortunately, BCB Bancorp focuses on commercial and multi-family loans which are not as highly dependent on borrowing costs as residential mortgage loans are. Commercial and multi-family loans made up a sizable 76% of total loans at the end of December 2022.
BCB Bancorp operates in the states of New York and New Jersey, which currently have satisfactory economic activities at par with the national average (see the slope of the trendlines below). This indicates that credit offtake will likely remain at a decent level in the near term.
The Federal Reserve Bank of Philadelphia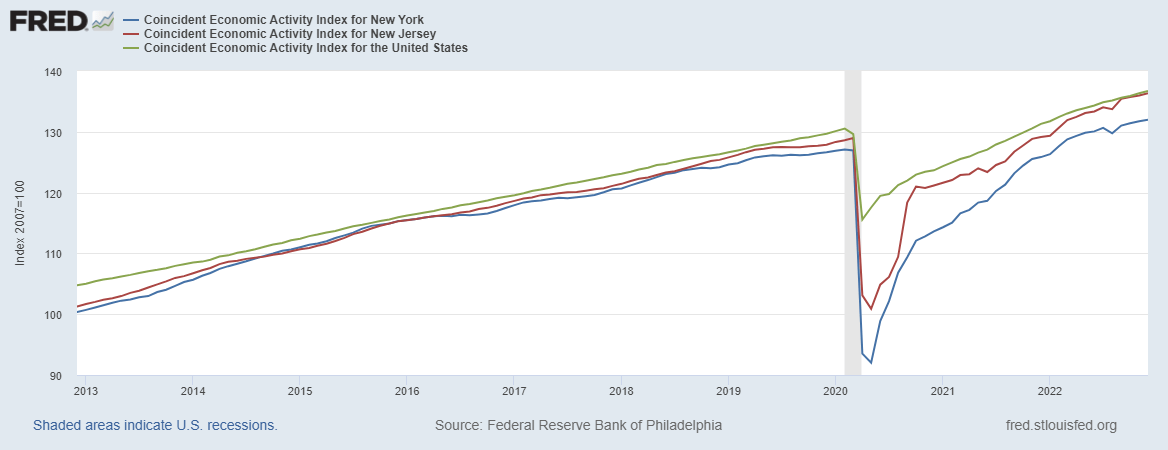
Considering these factors, I’m expecting the loan portfolio to grow by 4.1% in 2023, which is much lower than the growth for 2022 but still higher than the growth experienced in previous years. Meanwhile, I’m expecting other balance sheet items to grow somewhat in line with loans. The following table shows my balance sheet estimates.
| Financial Position | FY18 | FY19 | FY20 | FY21 | FY22 | FY23E |
| Net Loans | 2,278 | 2,178 | 2,228 | 2,305 | 3,045 | 3,169 |
| Growth of Net Loans | 38.6% | (4.4)% | 2.3% | 3.5% | 32.1% | 4.1% |
| Other Earning Assets | 305 | 621 | 360 | 514 | 329 | 342 |
| Deposits | 2,181 | 2,362 | 2,318 | 2,561 | 2,812 | 2,926 |
| Borrowings and Sub-Debt | 282 | 296 | 243 | 122 | 434 | 451 |
| Common equity | 181 | 214 | 223 | 245 | 270 | 299 |
| Book Value Per Share ($) | 11.5 | 13.1 | 13.1 | 14.2 | 15.6 | 17.2 |
| Tangible BVPS ($) | 11.2 | 12.7 | 12.7 | 13.9 | 15.3 | 16.9 |
| Source: SEC Filings, Earnings Releases, Author’s Estimates(In USD million unless otherwise specified) | ||||||
Reducing the Provisioning Estimate
BCB Bancorp surprised me by reporting a large reversal of provisioning for loan losses during the last quarter of 2022. The portfolio’s asset quality also improved substantially during the quarter. As mentioned in the earnings release, non-accrual loans dipped to $5.1 million by the end of December from $8.5 million at the end of September 2022. Allowances were a hefty 633.6% of non-accrual loans at the end of December 2022; therefore, there is a good chance that the provisioning expense will remain subdued this year despite economic headwinds. These economic headwinds include the high interest-rate environment and heightened inflation. Overall, I’m expecting the net provision expense to make up 0.06% of total loans, which is much below the last five-year average of 0.21%. Compared to my last report on the company, I’ve slashed my provisioning estimate because of the fourth quarter’s surprisingly good performance.
Reducing the Earnings Estimate to $2.52 per Share
Mostly because of a reduction in my margin estimate, my updated earnings estimate is much lower than the previous estimate given in my last report on BCB Bancorp. I estimated earnings of $2.73 per share for 2023 in my last report. I’m now expecting the company to report earnings of $2.52 per share in 2023, down 2% year-over-year. The following table shows my updated earnings estimate.
| Income Statement | FY18 | FY19 | FY20 | FY21 | FY22 | FY23E |
| Net interest income | 78 | 83 | 80 | 97 | 114 | 125 |
| Provision for loan losses | 5 | 2 | 9 | 4 | (3) | 2 |
| Non-interest income | 8 | 5 | 12 | 9 | 2 | 4 |
| Non-interest expense | 56 | 56 | 54 | 54 | 56 | 64 |
| Net income – Common Sh. | 16 | 20 | 20 | 33 | 45 | 44 |
| EPS – Diluted ($) | 1.01 | 1.20 | 1.14 | 1.92 | 2.58 | 2.52 |
| Source: SEC Filings, Earnings Releases, Author’s Estimates(In USD million unless otherwise specified) | ||||||
My estimates are based on certain macroeconomic assumptions that may not come to fruition. Therefore, actual earnings can differ materially from my estimates.
Large Price Upside Justifies a Buy Rating
BCB Bancorp is offering a dividend yield of 3.7% at the current quarterly dividend rate of $0.16 per share. The earnings and dividend estimates suggest a payout ratio of 25% for 2023, which is below the five-year average of 42%. Therefore, there is a chance of a dividend hike this year. To remain on the safe side, I have decided to not incorporate a dividend hike in this investment thesis.
I’m using the historical price-to-tangible book (“P/TB”) and price-to-earnings (“P/E”) multiples to value BCB Bancorp. The stock has traded at an average P/TB ratio of 1.06 in the past, as shown below.
| FY18 | FY19 | FY20 | FY21 | FY22 | Average | ||
| T. Book Value per Share ($) | 11.2 | 12.7 | 12.7 | 13.9 | 15.3 | ||
| Average Market Price ($) | 14.4 | 12.7 | 10.0 | 14.2 | 18.3 | ||
| Historical P/TB | 1.29x | 1.00x | 0.79x | 1.02x | 1.20x | 1.06x | |
| Source: Company Financials, Yahoo Finance, Author’s Estimates | |||||||
Multiplying the average P/TB multiple with the forecast tangible book value per share of $16.9 gives a target price of $17.9 for the end of 2023. This price target implies a 2.9% upside from the February 10 closing price. The following table shows the sensitivity of the target price to the P/TB ratio.
| P/TB Multiple | 0.86x | 0.96x | 1.06x | 1.16x | 1.26x |
| TBVPS – Dec 2023 ($) | 16.9 | 16.9 | 16.9 | 16.9 | 16.9 |
| Target Price ($) | 14.5 | 16.2 | 17.9 | 19.6 | 21.3 |
| Market Price ($) | 17.4 | 17.4 | 17.4 | 17.4 | 17.4 |
| Upside/(Downside) | (16.6)% | (6.8)% | 2.9% | 12.6% | 22.3% |
| Source: Author’s Estimates |
The stock has traded at an average P/E ratio of around 9.6x in the past, as shown below.
| FY18 | FY19 | FY20 | FY21 | FY22 | Average | ||
| Earnings per Share ($) | 1.01 | 1.20 | 1.14 | 1.92 | 2.58 | ||
| Average Market Price ($) | 14.4 | 12.7 | 10.0 | 14.2 | 18.3 | ||
| Historical P/E | 14.3x | 10.6x | 8.8x | 7.4x | 7.1x | 9.6x | |
| Source: Company Financials, Yahoo Finance, Author’s Estimates | |||||||
Multiplying the average P/E multiple with the forecast earnings per share of $2.52 gives a target price of $24.3 for the end of 2023. This price target implies a 39.4% upside from the February 10 closing price. The following table shows the sensitivity of the target price to the P/E ratio.
| P/E Multiple | 7.6x | 8.6x | 9.6x | 10.6x | 11.6x |
| EPS 2023 ($) | 2.52 | 2.52 | 2.52 | 2.52 | 2.52 |
| Target Price ($) | 19.2 | 21.7 | 24.3 | 26.8 | 29.3 |
| Market Price ($) | 17.4 | 17.4 | 17.4 | 17.4 | 17.4 |
| Upside/(Downside) | 10.4% | 24.9% | 39.4% | 53.8% | 68.3% |
| Source: Author’s Estimates |
Equally weighting the target prices from the two valuation methods gives a combined target price of $21.1, which implies a 21% upside from the current market price. Adding the forward dividend yield gives a total expected return of 25%. Hence, I’m maintaining a buy rating on BCB Bancorp.
Be the first to comment