

Moussa81/iStock via Getty Images
Introduction
Toronto-based Barrick Gold (GOLD) released its preliminary full year and fourth quarter 2021 production results on January 19, 2022.
1 – Q4 and full-year results snapshot
Barrick Gold posted better-than-expected preliminary gold production for the full year of 4.437 million ounces was within the 4.4 to 4.7 million ounce guidance range. Production for the fourth quarter was 1.203 Moz (sold 1.234 Moz) of gold and 126 Mlbs of Copper (sold 113 Moz).
The average market price for gold in Q4 was $1,795 per ounce, while the average market price for copper was $4.40 per pound.
Chart comparison 3Q 4Q Fun Trading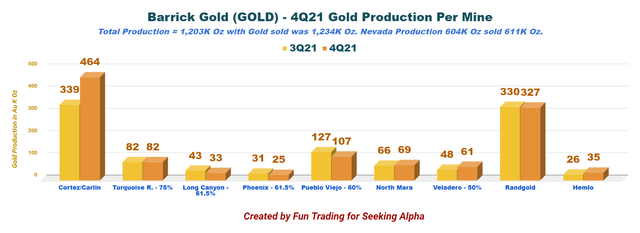
Preliminary copper production of 415 million pounds for 2021 was also within the guidance range of 410 to 460 million pounds.
Production was higher sequentially mainly due to the strong performance from Carlin and Cortez following the repair of the Goldstrike roaster completed at the end of the third quarter, which allowed for increased processing of material mined from both sites. I have indicated the combined production in my chart above.
Barrick Gold expects Q4 gold all-in sustaining costs per oz. to come in 4%-6% lower than in Q3 or about $983 per ounce.
GOLD AISC history Fun Trading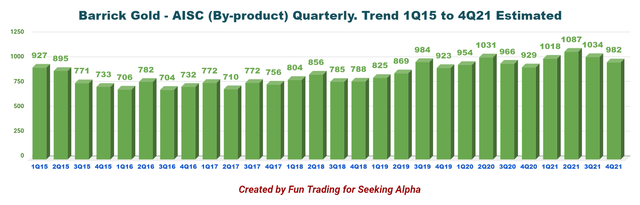
However, 4Q21 copper all-in sustaining costs per pound are expected 11%-13% higher than Q3 due to higher capital expenditures at Lumwana from new mining equipment and stripping.
2 – Stock Performance
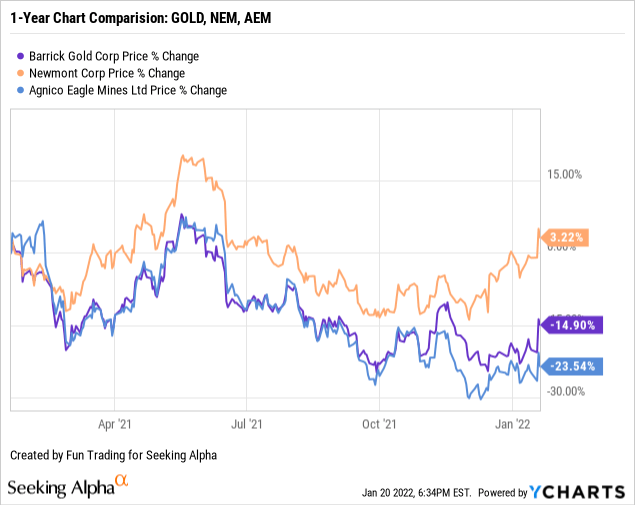
Barrick Gold is one of the three gold miners that I consider my core long-term “gold miners,” along with Newmont (NYSE:NEM) and Agnico Eagle (AEM).
We can see that Barrick is underperforming Newmont but is faring better than Agnico Eagle. GOLD is down 15% in one year despite the recent uptick experienced after data showing accelerated inflation.
3 – Investment thesis
The investment thesis has not changed for many years. I recommend keeping a long-term GOLD position and never entirely selling out. GOLD is part of my core long-term gold miners holding with Newmont Corp. and Agnico Eagle, which merged with Kirkland Lake Gold (NYSE:KL) recently.
However, the gold price volatility has been more pronounced with the gold miners, which were often definitely disconnected from the normal relationship between stocks and their corresponding commodities.
While gold was extremely stable the last six months, the miners suffered several micro-corrections that could not be easily explained, and this trend will likely continue stronger in 2022.
Thus, it is crucial to use about 40% of your total capital investment to trade the stock LIFO short term in light of the gold industry’s extreme volatility and inherent cyclicity – not to mention the geopolitical risks attached to specific regions Barrick Gold is operating, notably Africa.
Barrick Gold – Balance Sheet 3Q21 And Production In 4Q21: The Raw Numbers
| Barrick Gold | 4Q20 | 1Q21 | 2Q21 | 3Q21 | 4Q21 |
| Total Revenues in $ billion | 3.279 | 2.956 | 2.893 | 2.826 | – |
| Net Income in $ billion | 0.685 | 0.538 | 0.411 | 0.347 | – |
| EBITDA $ billion | 2.078 | 1.788 | 1.613 | 1.563 | – |
| EPS diluted in $/share | 0.39 | 0.30 | 0.23 | 0.20 | – |
| Cash from operations in $ million | 1,638 | 1,302 | 639 | 1,050 | – |
| Capital Expenditure in $ million | 546 | 539 | 658 | 569 | – |
| Free Cash Flow in $ million | 1,092 | 763 | -19 | 481 | – |
| Total cash $ billion | 5.19 | 5.67 | 5.14 | 5.04 | – |
| Long-term Debt in $ billion | 5.16 | 5.15 | 5.15 | 5.15 | – |
| Dividend per share in $ | 0.09 | 0.23 | 0.23 | 0.23 | – |
| Shares outstanding (diluted) in billion | 1.778 | 1.778 | 1.779 | 1.779 | – |
| Gold Production | 4Q20 | 1Q21 | 2Q21 | 3Q21 | 4Q21 |
| Gold Production K Oz | 1,206 | 1,101 | 1,041 | 1,092 | 1,203 |
| Copper Production Mlbs | 119 | 93 | 96 | 100 | 126 |
| AISC $/Oz by-product | 929 | 1,018 | 1,087 | 1,034 | – |
| Gold price realized $/Oz | 1,871 | 1,777 | 1,820 | 1,790 | 1,798 |
Data Source: Company press release
Note: Historical data starting from 2015 are available for subscribers only.
Complete Presentation of the 4Q21 Production and full-year 2021 with Commentary
The company reported fourth-quarter production for gold of 1,203K Au ounces (sold 1,234K Oz) and 126M Cu Lbs (sold 113M Cu Lbs).
The average price for gold in the third quarter was $1,798 per ounce, while the average copper price was $4.40 per pound. AISC is estimated at $982 per ounce.
1 – Gold production details and historical charts
Weak production again this quarter slightly better than the 2Q21, as shown below:
Chart Gold production history Fun Trading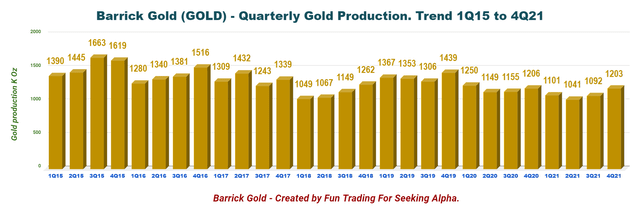
Nevada, including Turquoise and Phoenix, did better sequentially. Long Canyon production was a little down.
Chart gold production per mine Fun Trading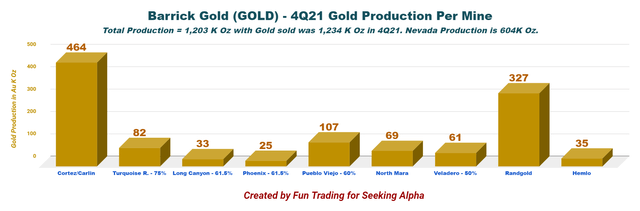
2 – Copper Production per mine and per quarter ending the fourth quarter of 2021
Chart Copper production history per mine Fun Trading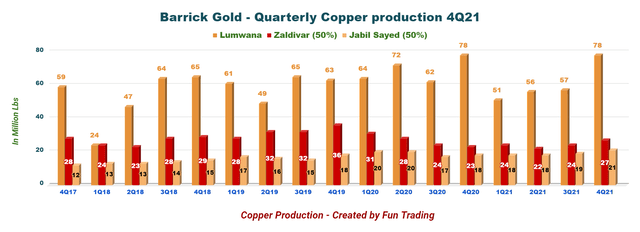
The primary 4Q21 copper production was 4.2% higher than in 3Q21. Copper sales were a record 126 M lbs, but the company sold 113 M lbs in 4Q21.
3 – Prices realized
The average market price for gold in the fourth quarter was $1,795 per ounce, and it was $4.40 per pound for copper. The company is still enjoying solid and stable commodity prices.
Chart gold price history Fun Trading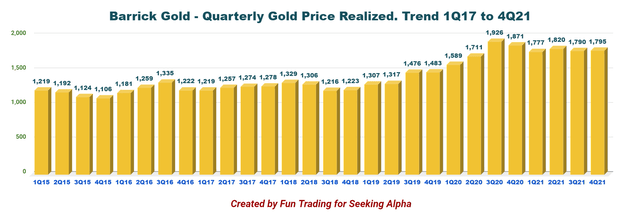
Chart copper price history Fun Trading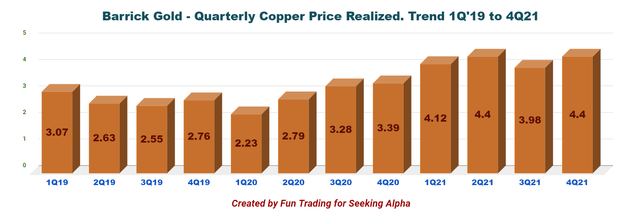
The gold price realized in the fourth quarter of 2021 was up 0.2% sequentially, and the copper price realized was 10.6% higher sequentially.
Technical Analysis And Commentary
TA Analysis Fun Trading with Stockcharts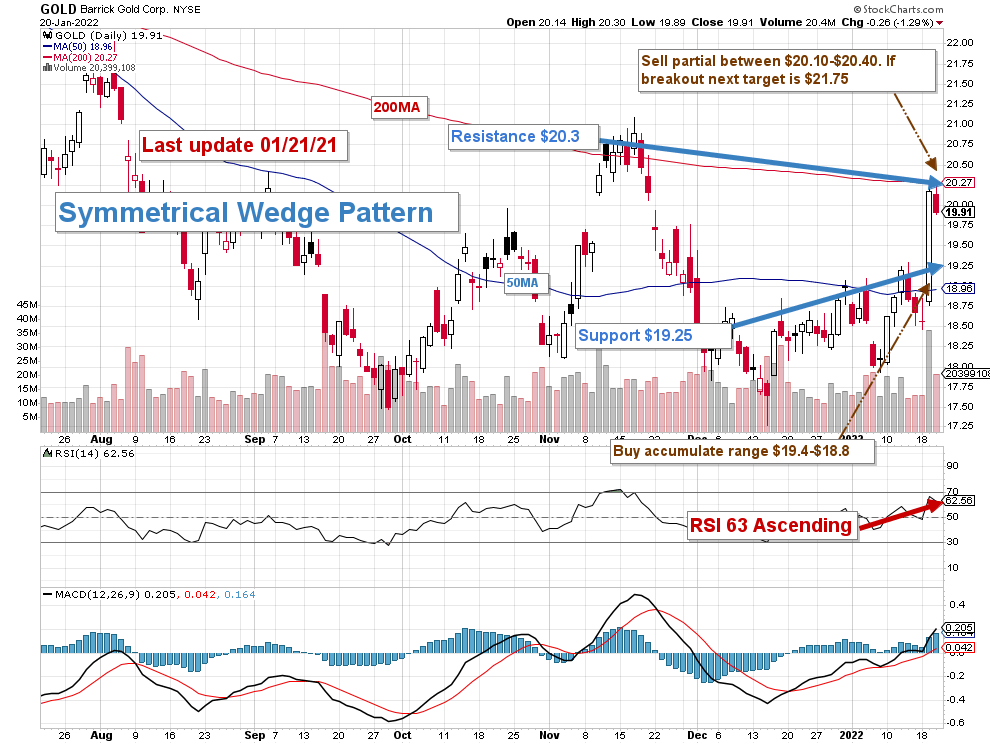
Note: the chart is adjusted for the dividend.
GOLD forms a symmetrical wedge pattern with resistance at $20.3 and support at $19.25 (the preceding resistance).
The trading strategy is to trade LIFO about 40% of your total position. Trading LIFO allows you first to sell your most recent purchases while keeping your core long position for a higher target.
I suggest selling 25% between $20.10 and $20.40 and waiting for an eventual breakout to sell another 15% above $21.75.
However, if gold turns bearish again, GOLD will likely drop below $19.25 and could even cross the support (breakdown) to retest $18-17.75 again in the worst-case scenario. I suggest accumulating GOLD below $19.25.
Rampant inflation is helping the gold price right now, but it is not a simple connection and could reverse quickly. The main issue is how hawkish the FED will shift in 2022 to fight it.
Analysts agree on one thing right now. The FED is about to raise interests potentially four to six times in 2022. The question is how high interests will have to jump to affect inflation.
Right now, I am not utterly optimistic for the gold price mid-term even if we are currently testing resistance at $1,840 per ounce, we could retest $1,800 per ounce or lower soon.
TA Analysis Fun Trading on Stockcharts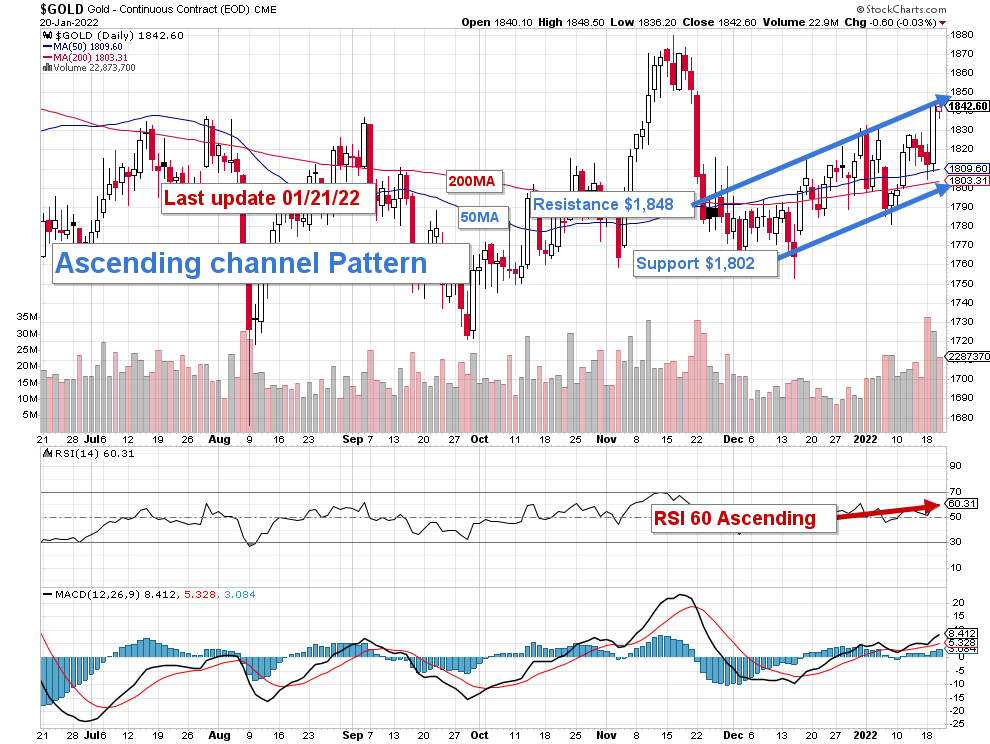
Watch gold price and the Fed mood like a hawk.
Warning: The TA chart must be updated frequently to be relevant. It is what I am doing in my stock tracker. The chart above has a possible validity of about a week. Remember, the TA chart is a tool only to help you adopt the right strategy. It is not a way to foresee the future. No one and nothing can.
Author’s note: If you find value in this article and would like to encourage such continued efforts, please click the “Like” button below as a vote of support. Thanks!
Be the first to comment