

studiocasper
Part I – Introduction
Toronto-based Barrick Gold Corporation (NYSE:GOLD) reported preliminary Q3 production and sales on October 13, 2022, and is scheduled to report its 3Q22 full results on November 3, before the market opens.
Note: This article is an update of my article published on September 2, 2022. I have followed GOLD on Seeking Alpha since April 2015.
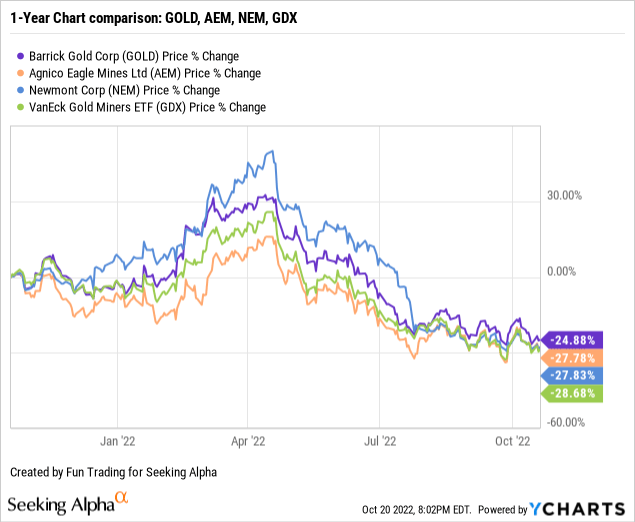
1 – Stock Performance
Barrick Gold is one of the three gold miners that I regard as my core long-term “gold miners,” together with Newmont (NEM) and Agnico Eagle (AEM).
We can see that Barrick and its peers have done poorly since May and are down about 27% on a one-year basis.
2 – Investment thesis
Barrick Gold is one of the leading gold and copper miners. I recommend trading and investing in the sector around three top gold producers I regularly follow on Seeking Alpha: Barrick Gold, Newmont Corp., and Agnico Eagle.
The Gold and Copper prices have been weakening since May, and the situation is significantly worsening with the FED’s action against rampant inflation and a strong dollar.
GOLD gold and copper comparison 1 year chart (Fun Trading StockCharts)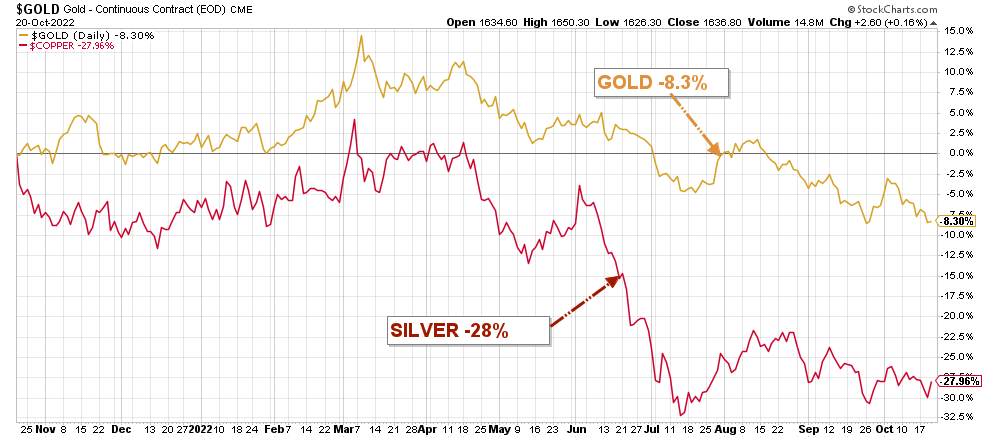
Gold closed at $1,628 per ounce yesterday, a far cry from the $2,050+ per ounce recorded only eight months ago. The copper price is even more depressed, as seen in the chart above.
Thus, I believe long-term investors should continue accumulating this highly cyclical stock on any significant weakness. But, due to extreme volatility in the gold segment, I recommend short-term trading LIFO. About 40% should be allocated to this task to minimize the risks of a sudden severe retracement. It is what I regularly promote in my marketplace, “The gold and the oil corner.”
Part II – 2Q22 Gold Production and Commentary
The company reported third-quarter production for gold of 988K Au ounces (sold 997K Oz) and 123M Cu Lbs (sold 120M Cu Lbs).
The average market price for gold in the second quarter was $1,729 per ounce, while the average market price for copper was $3.51 per pound. In its earnings release, the company said:
The Company’s third quarter realized copper price is expected to be 7 to 9% below the third quarter average market price for copper (or about $3.23 per pound), primarily as a result of provisional pricing adjustments that reflect the decrease in the copper price near the end of Q3.
Furthermore, Barrick will indicate the AISC next month but said it would be higher by about 4% (mid-point) or $1,260 per ounce. Inflationary pressures are hurting free cash flow:
Compared to Q2, Q3 gold cost of sales per ounce4 is expected to be in line with the prior quarter, while total cash costs per ounce and all-in sustaining costs per ounce are both expected to be 3% to 5% higher.
1 – Gold production details and historical charts
Production this quarter was particularly weak, as shown below:
GOLD Quarterly gold production history (Fun Trading)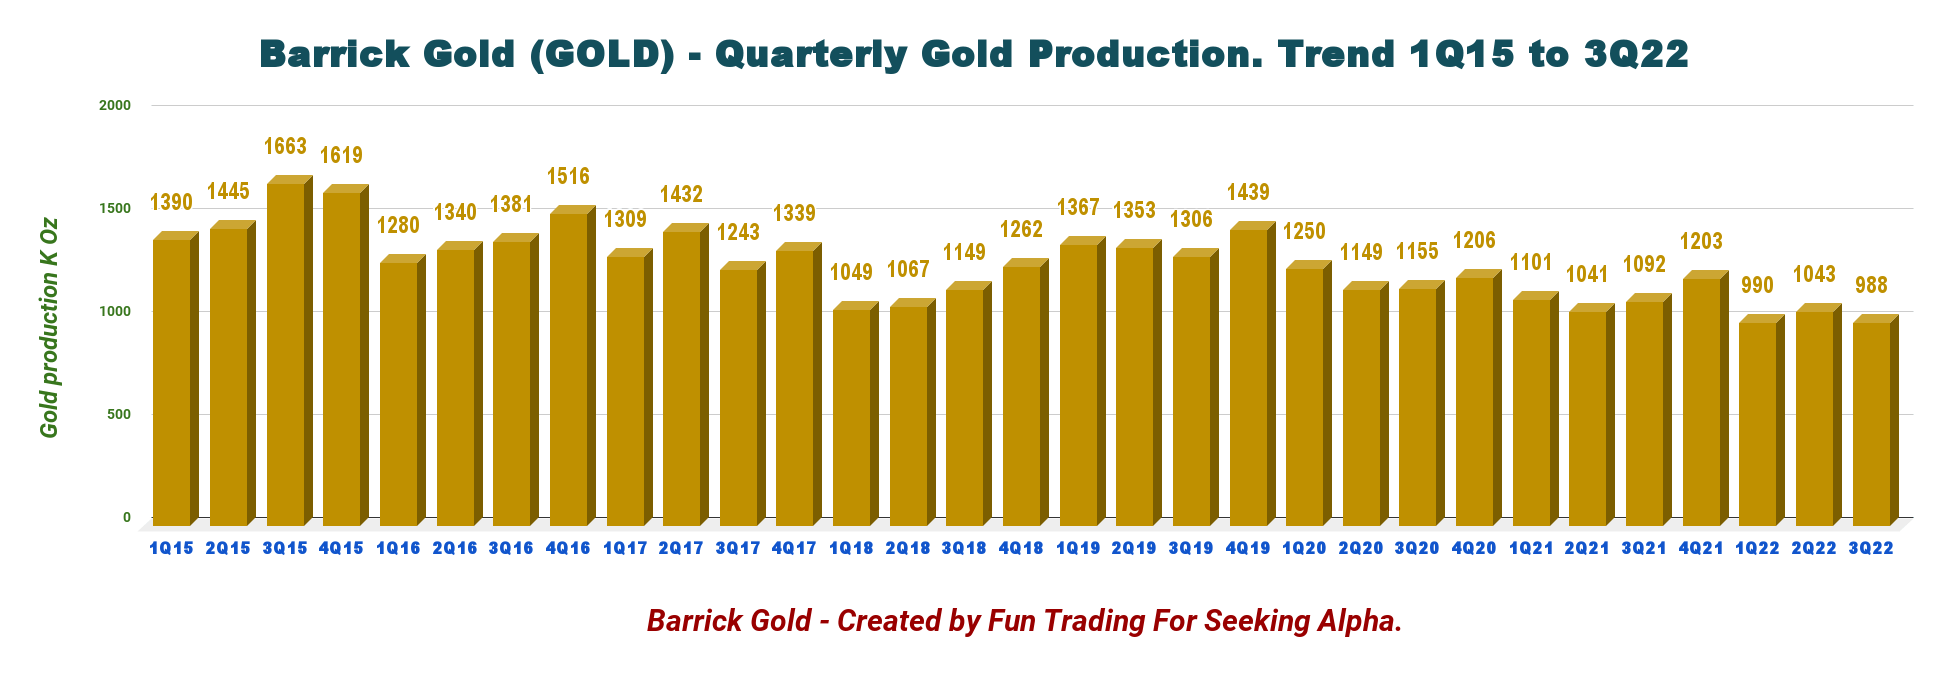
However, Barrick’s gold remains on track to achieve 2022 production guidance, with gold at the low end of the range and copper at the midpoint.
Below is shown production per mine. JV Nevada represents five gold mines: Cortez, Carlin, Turquoise, Long Canyon, and Phoenix. A total for Nevada JV of 425K Oz. Barrick said that access to high-grade ore previously expected in late Q3 at Nevada Gold Mines is now scheduled for Q4, which should drive a solid finish to the year.
GOLD Production per mine in 3Q22 (Fun Trading)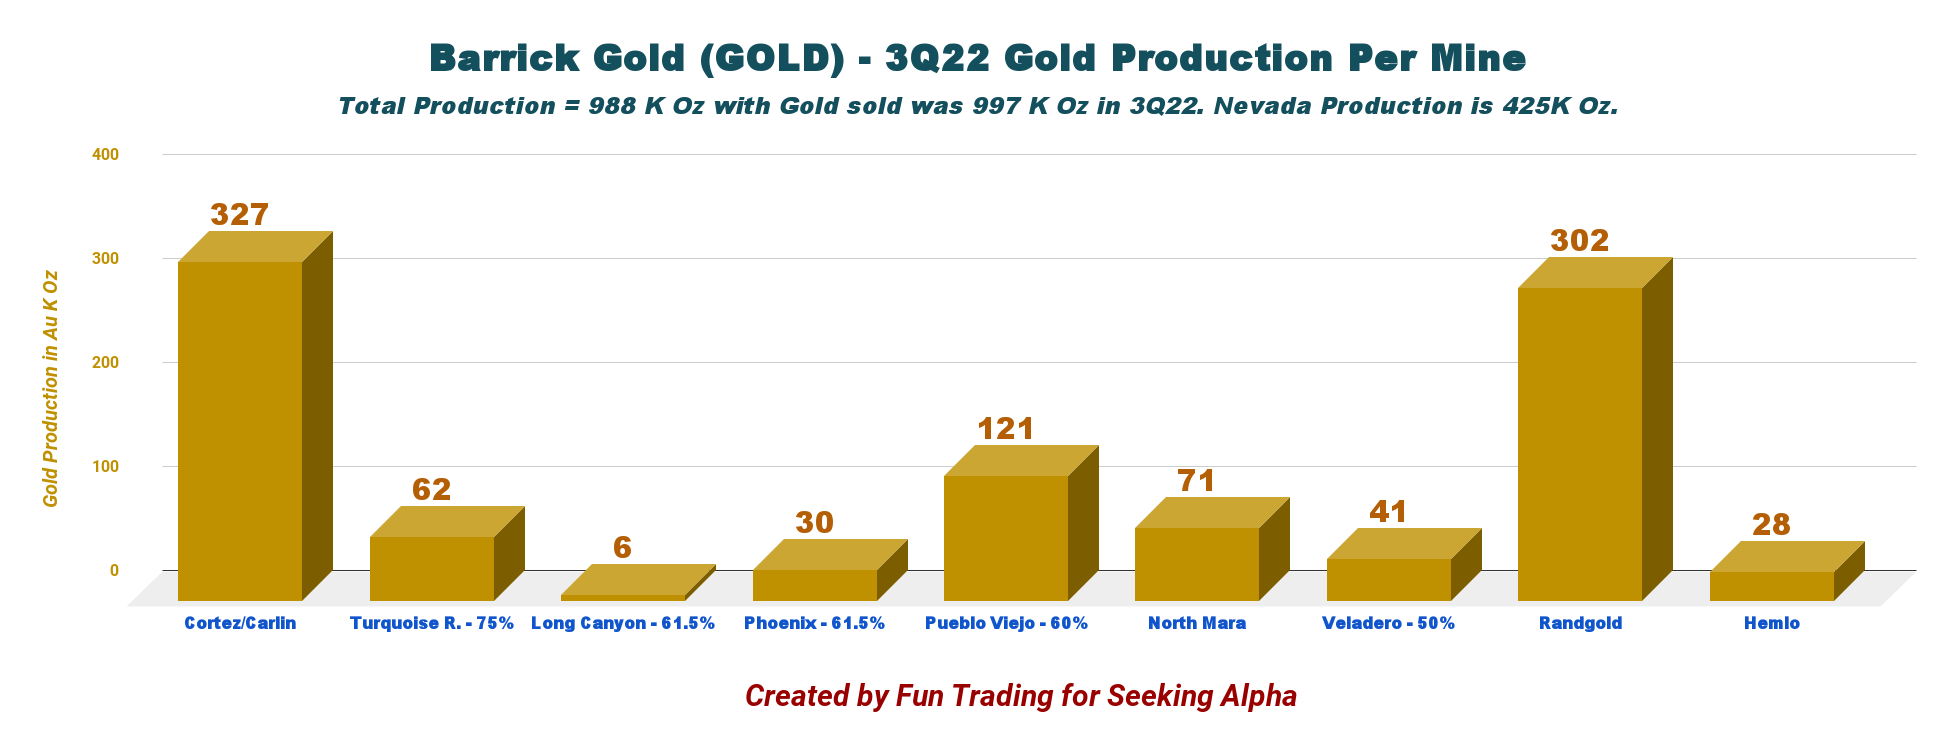
Gold production dropped 5.3% sequentially, as shown below:
GOLD Quarterly gold production 2Q22 versus 3Q22 (Fun Trading)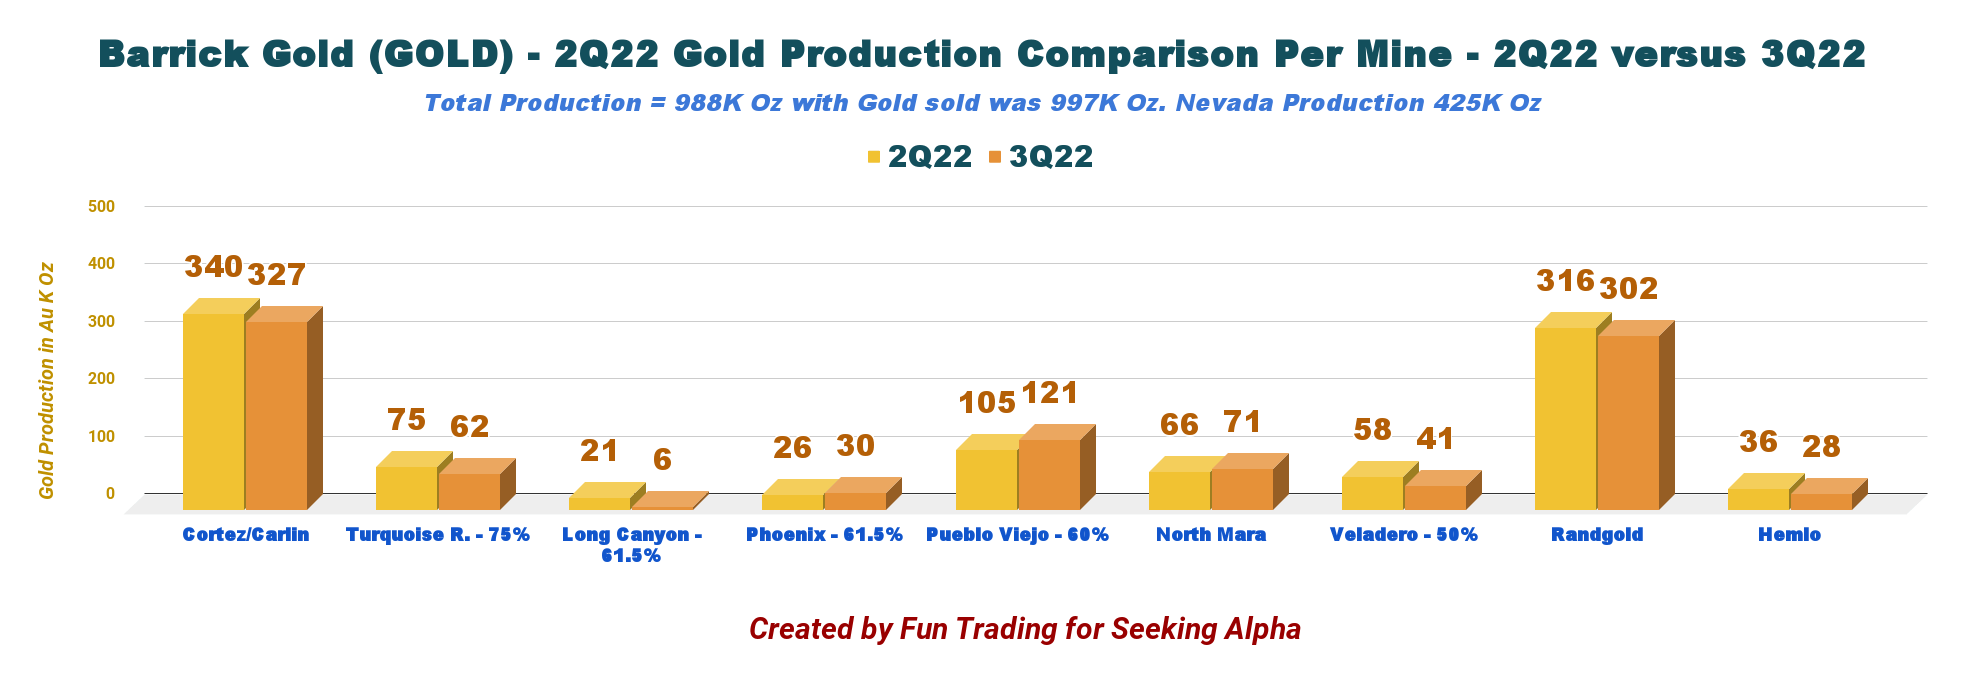
2 – Copper Production per mine and quarter ending the third quarter of 2022
GOLD production copper per mine history (Fun Trading)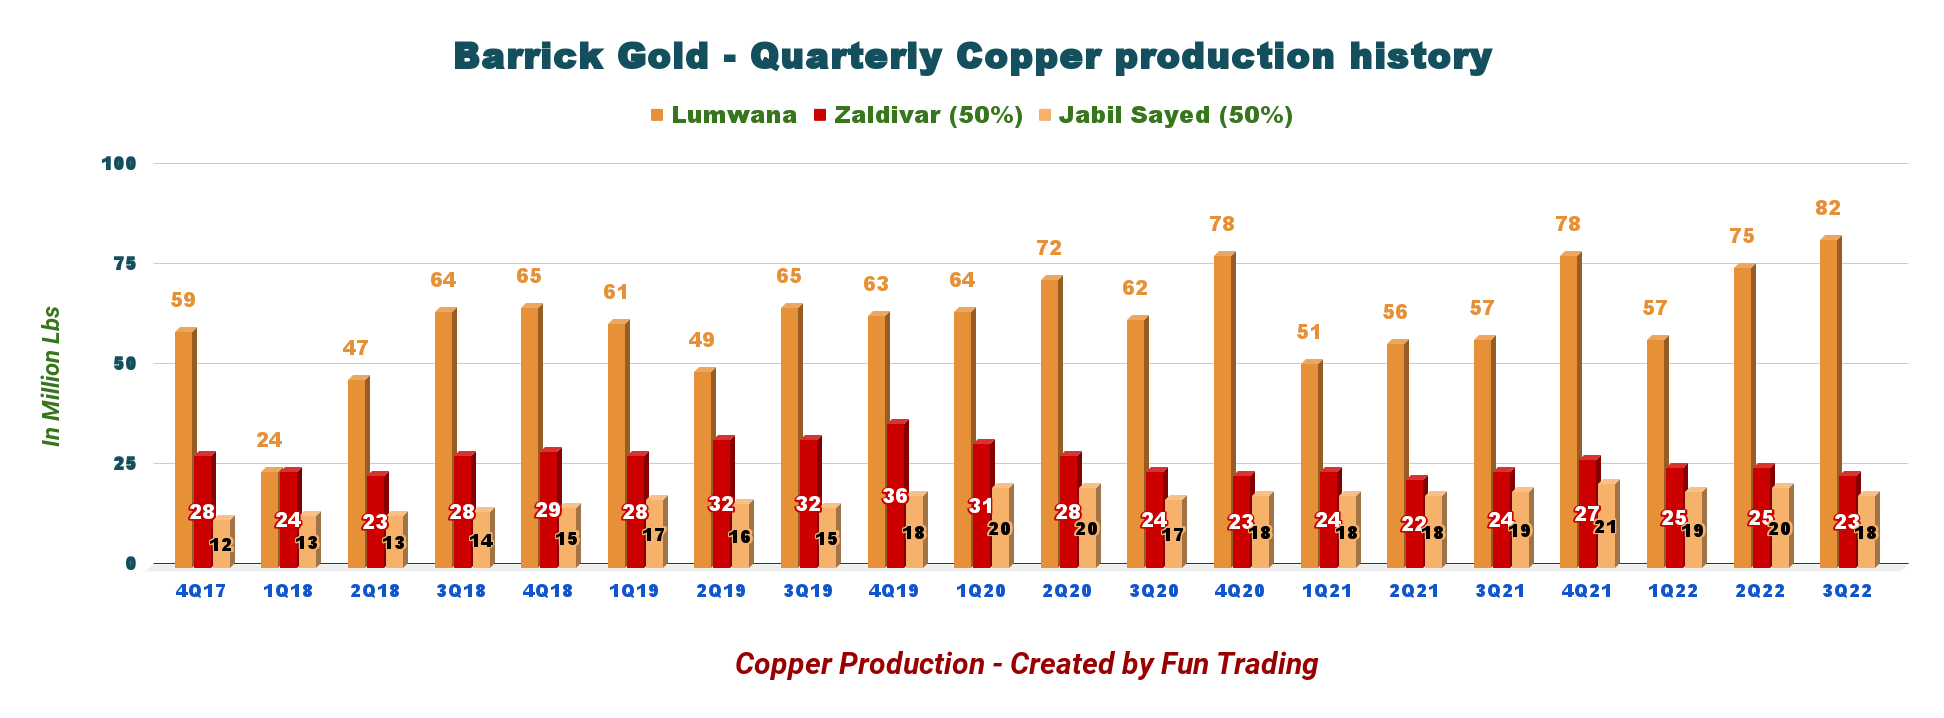
3 – Gold and Copper Prices realized
The average market price for gold in the first quarter was a solid $1,729 per ounce and $3.23 per pound for copper.
3.1 – Gold price history
GOLD Quarterly gold price history (Fun Trading)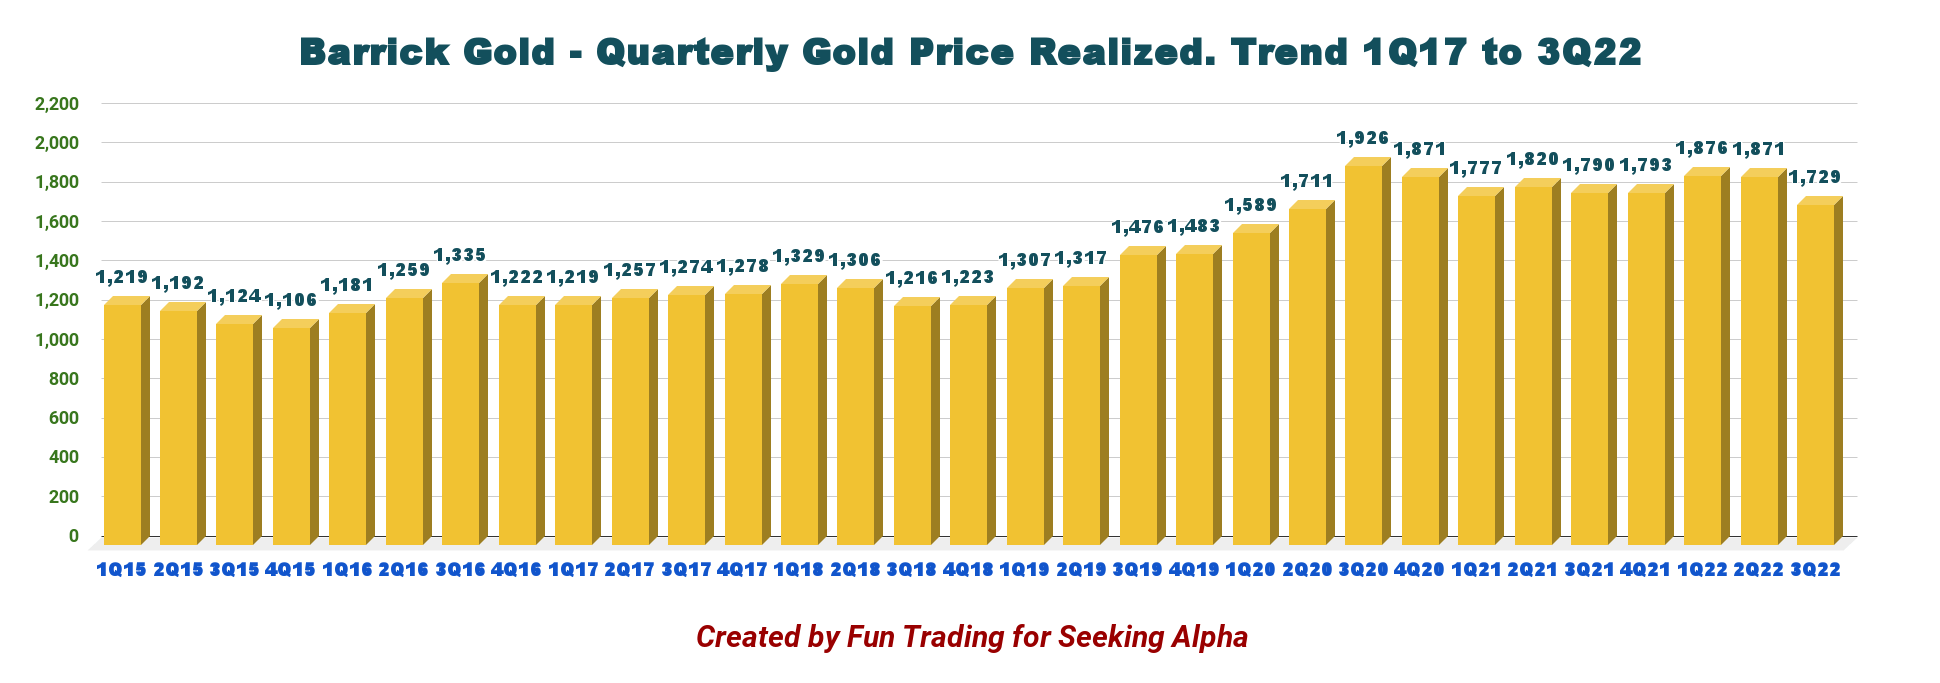
The gold price realized was $1,729 per ounce in 3Q22, down 7.6% sequentially. However, the gold price weakened significantly and closed at $1,629 per ounce today.
3.2 – Copper price realized will be lower this quarter
GOLD Quarterly copper price history (Fun Trading)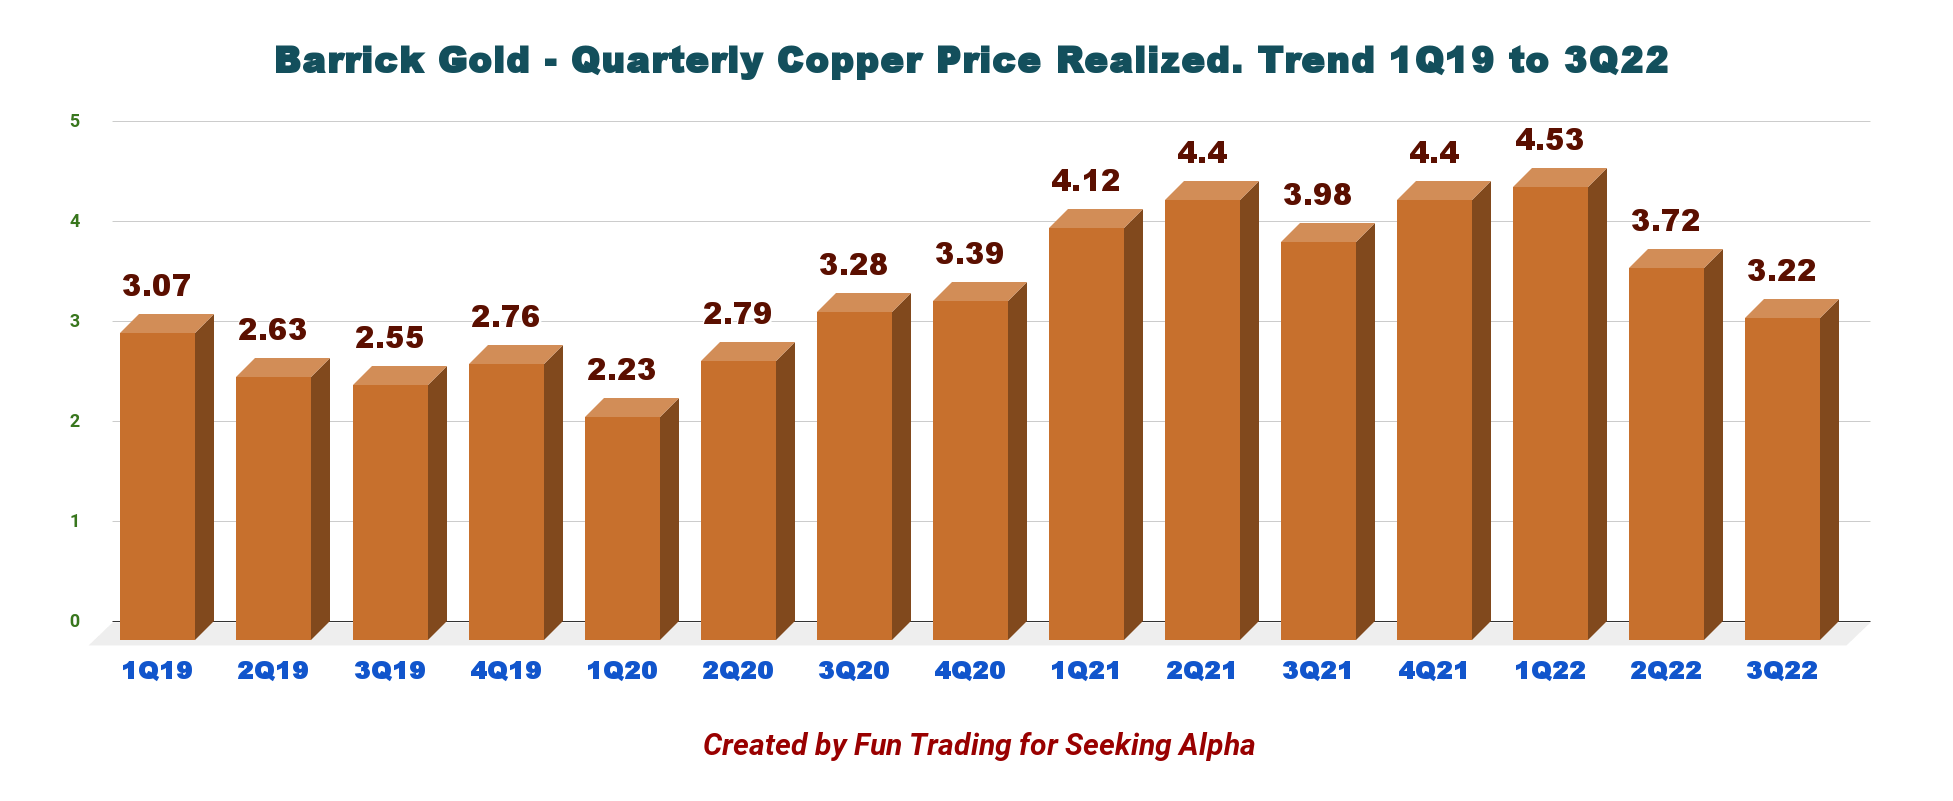
The copper price in the third quarter of 2022 continues to drop. The average market price for copper in 3Q22 was $3.51 per pound, but the price received by Barrick is expected to be $3.23 per pound.
If we look at the one-year chart for copper, we can see how quickly and sharply the price of copper has dropped since April, when the FED indicated that it would hike interest aggressively to fight inflation.
However, the copper price seems to have found lower support at about $3.40 per pound.
GOLD Copper price 1 year chart (Kitco)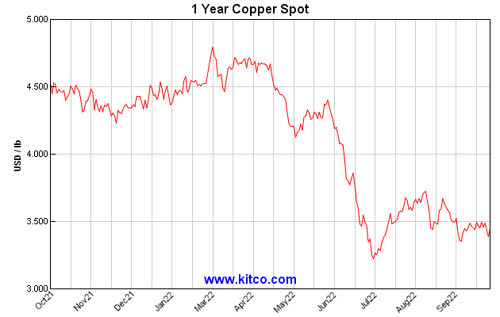
4 – Progress at the Reko Diq Copper Project in Pakistan
On October 17, 2022, Barrick announced that it is making “steady progress” in completing the final agreements and legal steps toward enabling the development of the Reko Diq project.
Reko Diq, one of the largest undeveloped copper-gold deposits in the world, will be owned 50% by Barrick Gold, 25% by Balochistan province, and 25% by major Pakistani state-owned enterprises. Reko Diq is designed as a conventional open pit and milling operation, producing a high-quality copper-gold concentrate.
Production from Reko Diq is expected in 2027-2028, with a cost of about $4 billion for Phase 1, followed by $3 billion for phase 2.
Technical Analysis And Commentary
GOLD TA Chart short-term (Fun Trading StockCharts)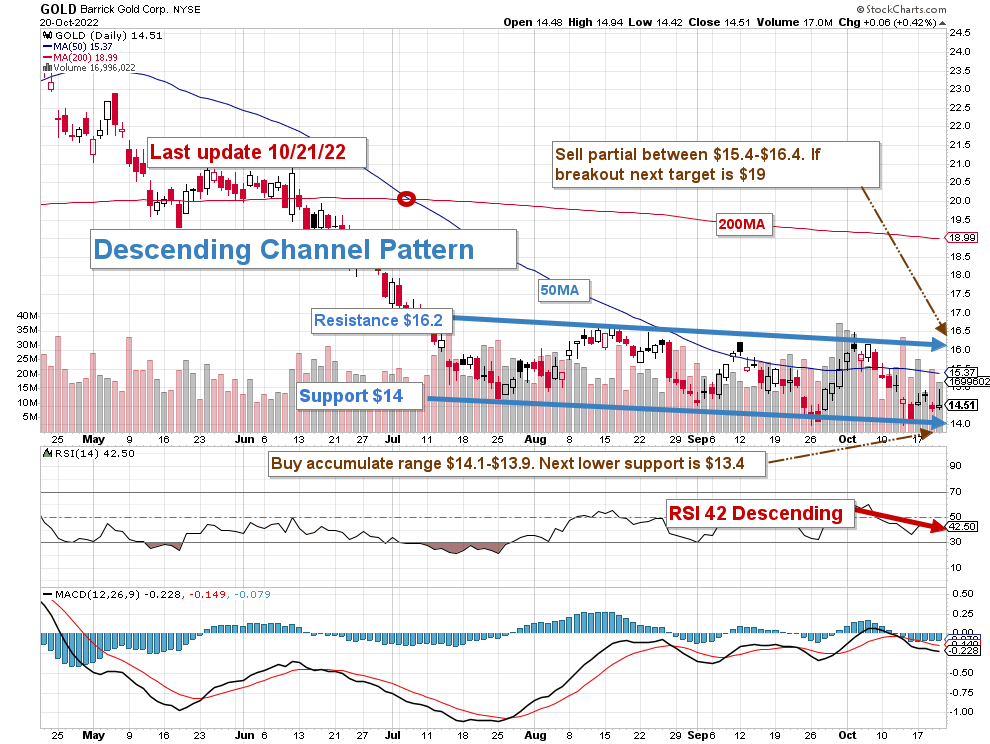
Note: The chart is adjusted for the dividend.
GOLD forms a descending channel pattern with resistance at $16.2 and support at $14.
The overall strategy that I suggest in my marketplace, “The Gold And Oil Corner,” is to keep a core long-term position and use about 40% to trade LIFO (see note below) while waiting for a higher final price target for your core position between $29 and $30 and pocketing the dividend in the meantime.
The trading strategy is to sell 40% between $15.4 (50MA) and $16.4 and another 10% above $17. I suggest waiting for a retracement between $14.1 and $13.9 to accumulate again, with potential lower support at $13.4 or lower, depending on the gold price.
Thus, watch gold prices and the Fed’s mood like a hawk.
Note: The LIFO method is prohibited under International Financial Reporting Standards (IFRS), though it is permitted in the United States by Generally Accepted Accounting Principles (GAAP). Therefore, only US traders can apply this method. Those who cannot trade LIFO can use an alternative by setting two different accounts for the same stock, one for the long term and one for short-term trading.
Warning: The TA chart must be updated frequently to be relevant. It is what I am doing in my stock tracker. The chart above has a possible validity of about a week. Remember, the TA chart is a tool only to help you adopt the right strategy. It is not a way to foresee the future. No one and nothing can.
Author’s note: If you find value in this article and would like to encourage such continued efforts, please click the “Like” button below to vote of support. Thanks.
Be the first to comment