

MicroStockHub
DEAR BARON DISCOVERY FUND SHAREHOLDER:
PERFORMANCE
Table I: Performance† – Annualized for periods ended June 30, 2022
|
Baron Discovery Fund Retail Shares[1],2 |
Baron Discovery Fund Institutional Shares1,2 |
Russell 2000 Growth Index1 |
S&P 500 Index1 |
|
|
Three Months3 |
(22.72)% |
(22.66)% |
(19.25)% |
(16.10)% |
|
Six Months3 |
(35.38)% |
(35.26)% |
(29.45)% |
(19.96)% |
|
One Year |
(40.61)% |
(40.44)% |
(33.43)% |
(10.62)% |
|
Three Years |
5.45% |
5.75% |
1.40% |
10.60% |
|
Five Years |
9.13% |
9.43% |
4.80% |
11.31% |
|
Since Inception (September 30, 2013) (Annualized) |
11.75% |
12.03% |
6.56% |
11.85% |
|
Since Inception (September 30, 2013) (Cumulative)3 |
164.28% |
170.27% |
74.37% |
166.43% |
|
Performance listed in the above table is net of annual operating expenses. Annual expense ratio for the Retail Shares and Institutional Shares as of September 30, 2021 was 1.31% and 1.05%, respectively. The performance data quoted represents past performance. Past performance is no guarantee of future results. The investment return and principal value of an investment will fluctuate; an investor’s shares, when redeemed, may be worth more or less than their original cost. The Adviser reimburses certain Baron Fund expenses pursuant to a contract expiring on August 29, 2032, unless renewed for another 11-year term and the Fund’s transfer agency expenses may be reduced by expense offsets from an unaffiliated transfer agent, without which performance would have been lower. Current performance may be lower or higher than the performance data quoted. For performance information current to the most recent month end, visit www.BaronFunds.com or call 1-800-99BARON. †The Fund’s 3- and 5-year historical performance was impacted by gains from IPOs and there is no guarantee that these results can be repeated or that the Fund’s level of participation in IPOs will be the same in the future. [1]The Russell 3000® Growth Index measures the performance of the broad growth segment of the U.S. equity universe comprised of the largest 3000 U.S. companies representing approximately 98% of the investable U.S. equity market. The Russell 2000® Growth Index measures the performance of small-sized U.S. companies that are classified as growth and the S&P 500 Index of 500 widely held large cap U.S. companies. Russell Investment Group is the source and owner of the trademarks, service marks and copyrights related to the Russell Indexes. Russell is a trademark of Russell Investment Group. The indexes and the Fund include reinvestment of dividends, net of withholding taxes, which positively impact the performance results. The indexes are unmanaged. Index performance is not Fund performance; one cannot invest directly into an index. [2]The performance data in the table does not reflect the deduction of taxes that a shareholder would pay on Fund distributions or redemption of Fund shares. [3] Not annualized. |
Thank you for investing in Baron Discovery Fund (the “Fund”). We usually say that at the end of the letter, but we wanted to put it upfront to acknowledge the steadfastness of our investors during what has been a volatile second quarter. In the second quarter, the Fund was down 22.66% (Institutional Shares), which was 3.41% below the Russell 2000 Growth Index (the “Benchmark”).
We are long-term investors and we believe in our process. Sometimes that means that in the short term we will lag behind the Benchmark, particularly when, as was the case in the second quarter, markets trade more on current macroeconomic headlines than on fundamental valuations. In such environments, riskier assets such as small-cap growth tend to sell off harder than value stocks and larger-cap companies as traders rush to purchase what they perceive to be safer assets.
We have seen this behavior since November 2021, and it was particularly pronounced in the first half of 2022. As can be seen in the charts below, the difference between the median small-cap growth stock’s price change from peak (under $1 billion market cap as of June 30, 2022) in the first half of 2022 versus the end of the period was negative 44.3%. This compares to negative 23.4% for the largest stocks in the Russell 3000 Growth Index.
This was even more pronounced in the sectors to which the Fund has its largest sector exposures: Health Care (down 46% in under $1 billion market capitalization stocks vs. down 10% for the largest stocks), Consumer Discretionary (down 50% vs. down 36%) and Information Technology (IT) (down 48% vs. down 28%). And value stocks (not shown in the table) outperformed growth in the same categories (with median declines from peak valuations of 38.4% for smaller stocks and 21.7% for larger stocks, respectively).
Russell 3000 Growth Index
Median Price Change – 6/30/2022 vs. Peak Price YTD
|
GICS Sector1 |
Market Cap < $1 bn |
Market Cap $1 to $5 bn |
Market Cap $5 to $10 bn |
Market Cap $10 to $50 bn |
Market Cap $50 to $100 bn |
Market Cap > $100 bn |
Median |
|
Communication Services |
–45% |
–32% |
–33% |
–35% |
–50% |
–41% |
–39.3% |
|
Consumer Discretionary |
–50% |
–40% |
–32% |
–31% |
–35% |
–36% |
–39.8% |
|
Consumer Staples |
–36% |
–19% |
–17% |
–7% |
–19% |
–10% |
–19.7% |
|
Energy |
–42% |
–34% |
–33% |
–26% |
–23% |
– |
–33.5% |
|
Financials |
–29% |
–33% |
–30% |
–23% |
–21% |
–32% |
–30.5% |
|
Health Care |
–46% |
–32% |
–24% |
–24% |
–28% |
–10% |
–34.1% |
|
Industrials |
–36% |
–29% |
–25% |
–25% |
–26% |
–22% |
–28.0% |
|
Information Technology |
–48% |
–36% |
–33% |
–34% |
–35% |
–28% |
–36.5% |
|
Materials |
–41% |
–29% |
–27% |
–30% |
–37% |
–47% |
–30.4% |
|
Real Estate |
–30% |
–36% |
–27% |
–25% |
–23% |
–13% |
–27.9% |
|
Utilities |
–24% |
–11% |
–11% |
–19% |
– |
– |
–17.8% |
|
Median |
–44.3% |
–33.0% |
–28.8% |
–28.0% |
–27.6% |
–23.4% |
–33.6% |
|
Number of Companies |
|||||||
|
GICS Sector1 |
Market Cap < $1 bn |
Market Cap $1 to $5 bn |
Market Cap $5 to $10 bn |
Market Cap $10 to $50 bn |
Market Cap $50 to $100 bn |
Market Cap > $100 bn |
Total |
|
Communication Services |
28 |
21 |
4 |
13 |
2 |
3 |
71 |
|
Consumer Discretionary |
82 |
87 |
24 |
26 |
6 |
6 |
231 |
|
Consumer Staples |
16 |
34 |
6 |
10 |
2 |
4 |
72 |
|
Energy |
23 |
41 |
6 |
11 |
3 |
0 |
84 |
|
Financials |
48 |
44 |
12 |
18 |
5 |
2 |
129 |
|
Health Care |
141 |
117 |
28 |
25 |
10 |
9 |
330 |
|
Industrials |
59 |
118 |
28 |
34 |
8 |
4 |
251 |
|
Information Technology |
87 |
129 |
32 |
59 |
8 |
15 |
330 |
|
Materials |
19 |
34 |
7 |
13 |
1 |
2 |
76 |
|
Real Estate |
18 |
20 |
4 |
7 |
3 |
1 |
53 |
|
Utilities |
7 |
11 |
2 |
2 |
0 |
0 |
22 |
|
Total |
528 |
656 |
153 |
218 |
48 |
46 |
1,649 |
|
1Industry sector group levels are provided from the Global Industry Classification Standard (“GICS”), developed and exclusively owned by MSCI, Inc. and Standard & Poor’s Financial Services LLC. All GICS data is provided “as is” with no warranties. Note: The median values in the table above were calculated using the stock price changes of the constituents in the Russell 3000 Growth Index as of June 30, 2022 from their individual peaks over the period from December 31, 2021 to June 30, 2022. Individual stock peaks have occurred on different dates during the period. Source: FactSet, FTSE Russell, and BAMCO. |
We have referred to this type of market price action as throwing the baby out with the bathwater. This is a tough environment for stock pickers in small-cap growth. It is compounded for our style of investing when more cyclically oriented sectors like Energy and Materials are in favor during inflationary environments. We avoid the latter sectors as we look to invest in secular growth stories rather than cyclical companies, and we have minimal weightings there. However, we truly believe that over the medium term to long term we will continue to provide meaningful outperformance to our investors.
So why are we so confident? Well for one reason, the price action shown above has led to historically huge valuation differentials between small-cap growth stocks and large-cap stocks. Below are forward looking valuation metrics comparing the Russell 2000 Growth Index, the Fund’s primary benchmark, to the S&P 500 Index. The time frame goes back to the late 1990s. In the left set of charts, current forward price to earnings (P/E) multiples of the Benchmark can be seen to be almost at parity with S&P 500 Index multiples.
This has not happened since the burst of the dot com bubble in 2000 (coupled with 9/11). The right set of charts shows another forward valuation measure (Enterprise Value to Sales). Again, they are fast approaching levels not seen in many years. The historical data leads us to believe that either the S&P 500 Index has much further to fall, or that the Benchmark could rebound from current levels. In either case, we believe that the odds are starting to favor small-capitalization growth stocks as an asset class.
Russell 2000 Growth Index vs. S&P 500 Index
Historical Valuation Comparison using Rolling FY1 Estimates
Source: FactSet PA, FTSE Russell, S&P Global, and BAMCO.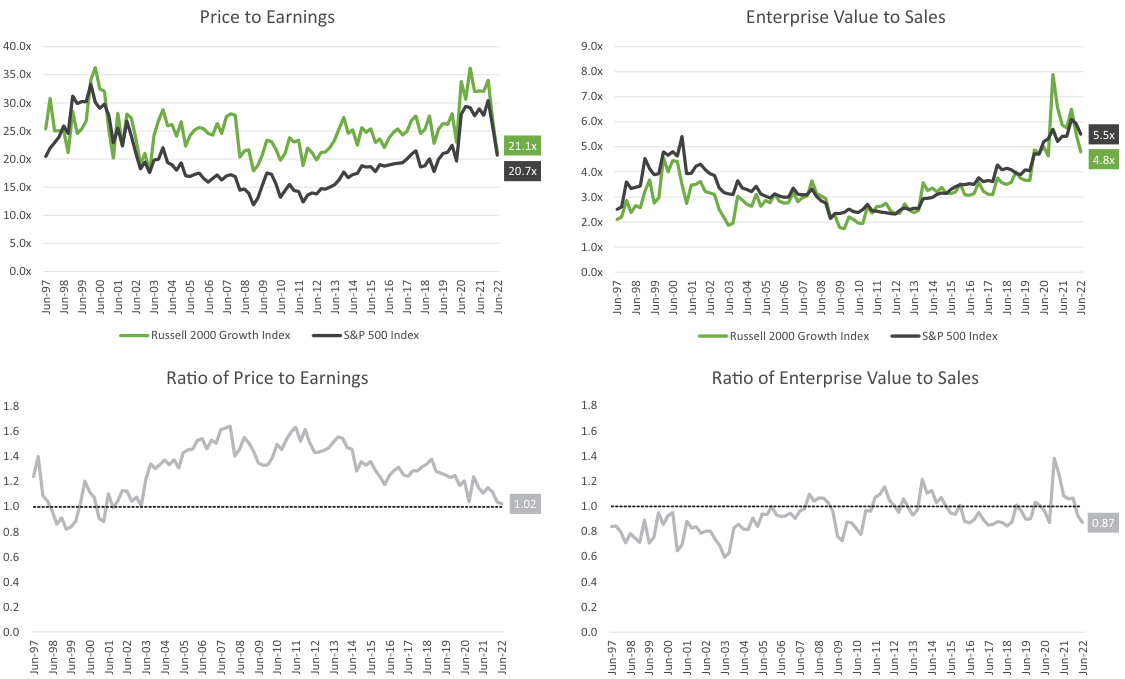
On an absolute valuation basis, we believe our individual investments are inexpensive. We recently hosted a quarterly investor call on May 11, 2022. The theme of the call was “What’s priced into stocks?” We made the case for a number of individual secular growth companies that were trading at valuations we have not seen in over a decade. We were not making a macroeconomic prediction, or a trading call. Rather, we were pointing out that given our experience we felt that the probability of medium- to long- term upside from these investments was very, very high.
Our portfolio has 62 such investments, with stocks trading today at very similar levels to what they were in early May. We spoke about our largest investment, Mercury Systems, Inc. (MRCY), which was trading at 14 times this year’s adjusted cash flow, near the historic low point for this market-leading defense electronics contractor. If our estimates are correct, Mercury is trading at under 9 times our 2026 cash flow estimates, meaning that shares should double over the forecast period assuming normalized valuations for the company.
Dynatrace Holdings LLC (DT), a software company that provides the ability to observe network and application activity to optimize performance, was trading at 18 times next year’s free cash flow and only 9 times our 2026 estimates. For a company growing cash flow at a 30% rate, this means we could see a double or even a triple over our forecast period.
Advanced Energy Industries, Inc. (AEIS) is a designer and manufacturer of power components that ensure precision power delivery for end-market applications including semiconductor manufacturing, medical procedures, and data center equipment. At May 11, 2022, Advanced Energy was trading for only 9 times 2022 and 6 times 2023 cash flow for a high-quality industrial company growing 7% to 10% on a normalized basis, without including accretive mergers and acquisitions.
It is trading at only 3 times our 2026 estimates, so we think it truly has the possibility of being a multi-bagger winner over the next four to five years. Why is it so cheap? Because it is having trouble (for now) getting $2 controller chips. It looks like that constraint is waning, and this will unlock huge profitability growth when Advanced Energy Industries sells its mostly finished inventory, which has extremely high end-market demand.
Inogen, Inc. (INGN), a medical device company that manufactures portable oxygen concentrators for patients with breathing issues, is a market leader, but like Advanced Energy, is constrained by chip supply so it is dramatically under earning versus the demand it is seeing for its products. We believe Inogen is trading at only 16 times next year’s adjusted cash flow (at lower-than-normal margins), and it is trading at only 2 times our out year cash flow estimates. Again, this is a potential multi-bagger investment over our longer-term investment horizon.
Another reason we are excited about the portfolio going forward is that we have been taking advantage of the current market dislocation to upgrade the quality of the portfolio. During the past two quarters, we have been able to purchase quality companies that were previously out of our reach due to market capitalization limitations. Because the whole market sold off to such a great extent, there were some high-quality “babies” that got thrown out with the “bathwater.”
We are happy to provide a “caring home” for them! In the past two quarters these purchases have included GitLab Inc. (GTLB), one of the market-leading software companies for software development tools, and ASGN Incorporated (ASGN), a market-leading technology staffing and technology services consultant trading for single-digit multiples of future cash flow. These stocks are both levered to the huge secular theme of scarcity of talent in IT personnel, which requires finding great tech people, applying the skillset, and/or making your software development team more efficient.
Other quality finds include Axon Enterprise, Inc. (AXON), a secular growth story with 85% recurring revenues, fulfilling the need for products that help law enforcement perform its mission and to do it more in harmony with their communities; Chart Industries, Inc. (GTLS), a supplier of industrial gas to liquid conversion equipment levered to natural gas and hydrogen markets; Guidewire Software, Inc. (GWRE), a provider of software solutions for the property and casualty insurance sector; and Ceridian HCM Holding Inc. (CDAY), a developer of human capital management software.
We wrote about GitLab, Chart, and Axon in detail in our first quarter letter (available on the www.baronfunds.com website), and the others are described below.
Conversely, we sold some of our lower conviction ideas (small, earlier stage companies) like Seer, Inc. (SEER), Olink Holding AB (OLK), and Recursion Pharmaceuticals, Inc. (RXRX); some companies that had reached long-term valuation levels we believed were full such as Inspire Medical Systems, Inc. (INSP) and Cryoport, Inc. (CYRX); and we even had some companies acquired in the quarter – SailPoint Technologies Holdings, Inc. (SAIL) and American Campus Communities, Inc. – the latter of which we just purchased in the first quarter of 2022!).
In short, we have pared down our number of investments from 69 at the end of the first quarter to 62 at the end of the second quarter, and we have lowered our weighted average market capitalization of the portfolio to about $3.8 billion from $4.3 billion at the end of the first quarter. This compares to the current weighted average market capitalization of the Russell 2000 Growth Index (our bogey) of about $2.8 billion (down from $3.6 billion just three months ago).
An additional quality measure is the low percentage of Fund assets invested in companies that are not yet cash flow positive. At June 30, 2022, about 22% of the portfolio was invested in companies that are not yet cash flow positive. In every instance we believe that the balance sheets of these companies, coupled with expected growth, will be sufficient to get the businesses to positive cash flow. In other words, there will be no capital raises needed for any of our portfolio companies.
About 71% of our assets are invested in companies that are already cash flow positive (4.1% are breakeven). We believe that this is a high-quality mix for a small-cap growth portfolio.
Table II: Top contributors to performance for the quarter ended June 30, 2022
|
Percent Impact |
|
|
SailPoint Technologies Holdings, Inc. (SAIL) |
0.49% |
|
American Campus Communities, Inc. |
0.27 |
|
GitLab Inc. (GTLB) |
0.23 |
|
Definitive Healthcare Corp. (DH) |
0.16 |
|
Alkami Technology Inc. (ALKT) |
0.13 |
SailPoint Technologies Holdings,Inc.is a cybersecurity vendor in the identity governance space. It is a complementary technology to our investments in Ping Identity Corporation (PING) and ForgeRock, Inc. (FORG, which are software solutions that grant access to networks and systems based on identity). SailPoint differs in that it helps companies govern the constantly changing privileges of employee access to the appropriate applications and systems in its networks.
On April 11, 2022, private equity firm Thoma Bravo announced an agreement to acquire the company for about $6.9 billion. Thoma Bravo knows SailPoint well, as it owned the company prior to taking it public in November 2017. By our estimates, this valuation represents 13 times SailPoint’s enterprise value to sales for 2022, and 11 times that measure for 2023. Enterprise value is basically the market value of a company less net cash on the balance sheet (or plus net debt).
In other words, it would be the cost to fully purchase the company including paying off its debt (or pocketing its cash). Many times, early-stage growth companies are valued on sales multiples rather than multiples of cash flow as they are currently spending capital to enhance high-return growth at the expense of margins. SailPoint is a market-leading company growing revenues at about 20%. The purchase numbers seem somewhat heady now, but were not far out of line at the time of the agreement, and were low compared to the past couple of years.
The buyer is sophisticated and knows the asset and the industry extremely well. The purchase puts into perspective how much valuations have fallen in the software space during the span of the recent quarter, and why we are excited about our investments in the space. Some examples in the Fund include:
- Couchbase, Inc. (a subscription database software company) growing 25% and trading at 3.7 times and 3.1 times sales estimates for 2022 and 2023;
- Varonis Systems, Inc. (a cybersecurity software company specializing in data protection and governance) growing 25% and trading at 6.3 times and 5.2 times;
- Qualys, Inc. (a cybersecurity software company specializing in endpoint protection) growing 20% with 40% cash flow margins and trading at 10 times and 8.5 times (the higher valuations reflect significant real free cash flow generation), and
- Ping Identity (identity access software) growing over 20% and trading at 5 times and 4.3 times these numbers.
American Campus Communities, Inc. was a contributor in the quarter as the company agreed to be acquired by Blackstone (BX) for $65.47 per share in an all cash deal. While an acquisition of the company was not the primary reason we had purchased the stock in the previous quarter, we were of the belief that it was a possible outcome given the discount at which it was trading to its net asset value.
GitLab Inc. is an end-to-end software development and IT operations (DevOps) platform that developers and IT teams use to create, test, secure, and deploy code. Shares appreciated after GitLab reported stellar first quarter financial results, where revenue growth accelerated to 75% year- over-year, while operating leverage led to better-than-expected margins.
Growth was driven by new customer wins (added a record 2,000-plus new base customers last quarter), healthy paid user expansion at existing customers, and upsells to GitLab’s higher-priced Ultimate Tier (which is growing over 160% as customers adopt advanced security and compliance features). We remain bullish on GitLab’s long-term prospects due to growing demand for integrated DevOps platforms that help companies build applications more effectively, GitLab’s continued market share gains from competitors’ point solution tools, and the company’s strong unit economics.
Definitive Healthcare Corp., a health care information database company, outperformed in the quarter. It announced earnings in early May that beat consensus for the first quarter, and raised its estimates for the full year of 2022 to levels that also beat consensus. We believe that Definitive has significant opportunities to increase its overall market share. We expect 2022 revenues of about $225 million versus a $10 billion market opportunity.
We also believe the company can continue to compound its growth by around 25% for years to come, and can continue to grow its adjusted cash flow margins from 29% this year to 40% in our later year estimates. We think investors are starting to understand the company’s potential, and we believe that its valuation is still compelling.
Shares of Alkami Technology Inc., a cloud-based digital banking platform, contributed to performance in the second quarter. The company continued its streak of solid earnings results showing strong sales activity. In addition, the company reaffirmed its plan to be adjusted cash flow breakeven by the end of 2023. While the near-term macro dynamics can create volatility in the stock, we retain our long-term conviction in Alkami and believe that the company is well positioned to grow revenue at a mid-20% or higher rate for the next several years with a well-defined path to profitability.
Table III: Top detractors from performance for the quarter ended June 30, 2022
|
Percent Impact |
|
|
Clearwater Analytics Holdings, Inc. (CWAN) |
–1.10% |
|
Rexford Industrial Realty, Inc. (REXR) |
–0.94 |
|
Progyny, Inc. (PGNY) |
–0.94 |
|
Endava plc (DAVA) |
–0.90 |
|
Montrose Environmental Group, Inc. (MEG) |
–0.82 |
Shares of Clearwater Analytics Holdings, Inc., a leading provider of software for investment accounting and reporting, detracted from performance. This is despite the fact we believe the underlying fundamentals of the company continue to be strong, and the most recent quarterly earnings report was above expectations.
It is our belief the stock underperformance is due to broader market weakness (especially in high- growth/high-multiple software stocks) and concerns that rising interest rates could negatively impact its clients’ assets under management (and thus be a headwind to Clearwater’s revenue growth as it is paid as a percentage of client assets under management).
We have factored in the latter concern into our expectations and, despite that, retain long-term conviction in Clearwater given its competitively advantaged product offering, a solid compounding growth profile, and strong profitability.
Rexford Industrial Realty, Inc., an owner and operator of industrial properties in Southern California, was a detractor in the second quarter. Despite a strong fundamental backdrop in Rexford’s core markets, the company’s stock was impacted by Amazon’s (AMZN) announcement that it was curtailing new warehouse construction and even considering sub-leasing a portion of its existing warehouse footprint due to excess fulfillment capacity.
This announcement led to a sharp correction in the stock prices of all industrial warehouse real estate companies (including Rexford), as investors grew concerned that a broader demand slowdown could develop and negatively impact industrial warehouse fundamentals. Our diligence suggests that the demand outlook for industrial warehouses in Rexford’s markets remains healthy, and we expect market fundamentals to remain supportive of rent and cash flow growth, even after factoring in less demand from Amazon.
It is also important to note that our expectations for Rexford’s growth in future periods do not rely on Amazon (Amazon currently represents less than 1% of Rexford’s rents).
Shares of Progyny, Inc., the U.S.’s leading provider of employer-sponsored fertility benefits, dropped in the second quarter, along with the broad sell-off in high-multiple growth stocks. Progyny is profitable and self- financing. The company delivered a beat and raise first quarter with optimistic management commentary regarding the early 2023 selling season. Nevertheless, investors seemed more focused on concerns of greater competition, the pace of post-COVID utilization, recession fears, and the possible ramifications of Roe vs. Wade being overturned. We believe these concerns are overdone.
We believe that the pace of employer-sponsored fertility benefit adoption is accelerating, and Progyny is differentiated by having the most comprehensive offering and broadest network in the market, and that its utilization is normalizing off the COVID trough. With regard to Roe, management has conservatively pegged only 3% of revenue exposed to states that have “trigger laws” which automatically restricted or banned abortions when Roe was overturned.
Texas has a trigger law, but actually mandates IVF coverage and has specific language in its laws that should allow doctors to continue to deliver IVF services without fear of legal exposure.
Shares of Endava plc, provider of consulting and outsourced software development for business customers, fell despite strong business momentum. It had 51% revenue growth and 43% earnings growth in the recent quarter and a more positive outlook for the fiscal year. The share price decline likely reflected concern about macroeconomic uncertainty weighing on client demand and the impact of currency depreciation given that two-thirds of its revenue comes from non-U.S. customers. We continue to own the stock because we believe Endava will continue gaining share in a large global market for IT services.
Montrose Environmental Group, Inc., an environmental services company, underperformed during the quarter. Despite reiterating guidance for 2022, Montrose underperformed as the market penalized high-growth companies generally. We continue to remain positive on the company’s prospects and ability to achieve or beat its long-term growth target of over 20% per year. We remain particularly excited about Montrose’s potential to benefit from increased government regulation around PFAS chemical contamination and methane emissions.
Portfolio Structure
Table IV: Top 10 holdings as of June 30, 2022
|
Year Acquired |
Quarter End Investment Value (millions) |
Percent of Net Assets |
|
|
Mercury Systems, Inc. (MRCY) |
2015 |
$58.9 |
5.2% |
|
Kinsale Capital Group, Inc. (KNSL) |
2016 |
57.4 |
5.0 |
|
Rexford Industrial Realty, Inc. (REXR) |
2019 |
37.4 |
3.3 |
|
Axonics, Inc. (AXNX) |
2020 |
36.2 |
3.2 |
|
Definitive Healthcare Corp. (DH) |
2021 |
33.4 |
2.9 |
|
Boyd Gaming Corporation (BYD) |
2021 |
32.3 |
2.8 |
|
Floor & Decor Holdings, Inc. (FND) |
2019 |
31.5 |
2.8 |
|
Advanced Energy Industries, Inc. (AEIS) |
2019 |
31.0 |
2.7 |
|
SiteOne Landscape Supply, Inc. (SITE) |
2016 |
27.9 |
2.4 |
|
Endava plc (DAVA) |
2018 |
26.5 |
2.3 |
Our top 10 holdings represented 32.6% of the portfolio versus 28.4% in the first quarter. Cash holdings were 2.9%. Our tax loss position as of June 30, 2022 was approximately negative $45 million. As always, we are attuned to the tax position of the portfolio. Our industry exposure is generally in line with the Russell 2000 Growth Index, although we are overweight IT (we see extreme valuation dislocations in the sector based on the secular growth models we have analyzed) as well as Industrials (which includes our 6.9% exposure to defense, which should be economically neutral and benefit from the tailwinds of increased defense spending).
We are underweight Energy, Materials, and Utilities as we believe these are cyclical and/or lower growth sectors that do not fit our secular growth strategy particularly well. While the underexposure to the latter categories can hurt our relative performance during periods like this one, we believe that such periods are more the exception and believe long-term performance favors exposure to secular growth.
Recent Activity
Table V: Top net purchases for the quarter ended June 30, 2022
|
Year Acquired |
Quarter End Market Cap (billions) |
Amount Purchased(millions) |
|
|
Guidewire Software, Inc. (GWRE) |
2022 |
$6.0 |
$23.5 |
|
ASGN Incorporated (ASGN) |
2022 |
4.6 |
21.6 |
|
Ceridian HCM Holding Inc. (CDAY) |
2022 |
7.2 |
19.1 |
|
GitLab Inc. (GTLB) |
2022 |
7.8 |
14.1 |
|
Establishment Labs Holdings Inc. (ESTA) |
2022 |
1.3 |
10.5 |
During the quarter, we purchased Guidewire Software, Inc., a leading provider of mission-critical software solutions for property and casualty insurance carriers. Guidewire addresses a large market opportunity (TAM is over $20 billion), and we think the company can expand this market over time by moving into adjacent areas. Guidewire is the clear market leader with almost triple the revenues of its closest competitor and 60% competitive win rates. We believe it is an opportunistic time to buy the company’s stock for two reasons:
First, over the last few years, the company has been undertaking the difficult transition from on-premise delivery of software to Cloud delivery. While this process has not been without challenges, we believe that the worst of the transition is behind it and that the company will exit this process much stronger financially. We are especially excited by the prospect of long-term high-teens revenue growth combined with 30% free cash flow margins.
Second, Guidewire’s stock has pulled back along with the overall market allowing us to purchase the company at what we believe is an attractive valuation. Our price target calls for more than a tripling of the stock in the next five years.
ASGN Incorporated is a leading provider of IT staffing and consulting services. We expect continued robust demand for ASGN’s solutions given its focus on staffing areas with strong secular growth, chronic shortages of skilled IT workers, and the ongoing digital transformation of U.S. businesses. ASGN is better insulated from economic headwinds than traditional staffing providers given its significant exposure to more stable, counter-cyclical government work and the mission-critical nature of its IT infrastructure work and longer-term consulting engagements.
Management is not seeing any change in tone from its clients, demand remains strong, and pipeline growth is still accelerating. Wage inflation is being offset by higher billing rates, which are being successfully passed through to customers. ASGN is rapidly expanding its solution capabilities, which in turn expands the scope of work for which it can compete and presents new cross-selling opportunities. The company is tracking ahead of its three-year $6 billion revenue target (including $4.9 billion organic revenue growth) which was set just this past September.
We believe investors do not appreciate ASGN’s differentiated positioning and remain optimistic about the outlook for the company. Trading at around 8.5 times 2023 adjusted cash flow, we think the shares are incredibly cheap.
We initiated a new position in Ceridian HCM Holding Inc., a developer of human capital management (“HCM”) software. The company’s solutions assist its clients in areas such as payroll processing, recruiting, and employee engagement. We believe that COVID has reshaped the traditional compact between employers and employees. Employers are rushing to recruit and retain employees by offering improved work-life balance, including remote or hybrid positions, and enhancements to training, benefits, and pay cycles.
We think this is driving an increase in demand for Ceridian’s innovative Dayforce payroll and HCM platform, which allows employers to deliver this innovation and flexibility at scale with a consumer-grade user experience. We are also more optimistic regarding the opportunity for theDayforce Wallet. Dayforce Wallet allows employees to request and be paid their earned wages at any point during a pay cycle, rather than having to provide this service due to the native integration of its pay and time modules, which enables the continuous calculation of wages and lets Ceridian generate legally compliant payrolls on demand.
Ceridian’s innovative approach to pricing has made Wallet free to employees and employers and lets companies maintain their traditional two-week funding cycle. Instead, Ceridian gets paid via interchange every time Wallet customers use their cards for a transaction. We think Ceridian has a long runway for additional innovation in Wallet, including a wide array of financial products and employment passporting. We think that Dayforce recurring revenue can compound at a 30% CAGR for many years.
We expect this growth rate to be driven by robust win rates in Ceridian’s core market, continued progress in targeting larger employers, growing success with cross-selling new functionality, and addressing a vastly underserved market outside of North America. We think that Wallet can effectively double Ceridian’s current revenue per employee, helping to drive growth that is additive to this target. Most excitingly, since Ceridian will be paid via interchange, it will effectively be 100% margin, causing each incremental revenue dollar to convert almost completely into free cash flow.
We added to our position in GitLab Inc. as we continue to believe that the company is undervalued given its substantial growth, great market positioning in what we believe will be a near duopoly going forward, and minimal penetration into its overall addressable market. With about $400 million in revenues this year it will only have a 1% share of what we believe is a $40 billion market for its programming tools software.
Establishment Labs Holdings Inc. is a medical technology company that sells silicone gel-filled breast implants, branded as Motiva Implants, in more than 80 countries outside of the U.S. The company’s breast implants are made with a unique, proprietary smooth surface technology which minimizes the immune response and has had low rates of adverse events, particularly capsular contracture (squeezing of the implant by surrounding tissue) and rupture.
The company has been gaining market share in its existing geographies, but it has not yet received regulatory clearance in the U.S., which represents roughly half of the $1.5 billion breast implant market. Establishment has been running a pivotal U.S. trial to support FDA approval in the U.S. and recently announced two-year follow-up results at a medical meeting. The data revealed low complication rates, which should position the company to receive FDA approval over the next 12 to 18 months.
China represents a fast-growing market and Establishment expects to receive regulatory approval there in the coming months. In addition, the company is developing a minimally invasive breast implant called Motiva Mia, which can be implanted in a 15-minute procedure in an outpatient setting without general anesthesia. The company estimates an addressable market for Motiva Mia of 1.9 million new patients equating to a $3 billion to $5 billion incremental revenue opportunity. We think Motiva Mia will expand the company’s market opportunity materially, adding to the company’s long runway for growth.
Table VI: Top net sales for the quarter ended June 30, 2022
|
Year Acquired |
Market Cap When Acquired (billions) |
Market Cap When Sold (billions) |
Amount Sold (millions) |
|
|
SailPoint Technologies Holdings, Inc. (SAIL) |
2020 |
$5.1 |
$6.0 |
$43.9 |
|
American Campus Communities, Inc. |
2022 |
7.7 |
9.0 |
37.1 |
|
UTZ Brands, Inc. (UTZ) |
2020 |
1.0 |
1.9 |
20.6 |
|
Inspire Medical Systems, Inc. (INSP) |
2019 |
1.3 |
4.6 |
9.9 |
|
Fevertree Drinks plc (OTCPK:FQVTF) |
2020 |
3.3 |
2.2 |
9.6 |
As we discussed above, we sold our investments in SailPoint Technologies Holdings, Inc. and American Campus Communities, Inc. after they agreed to be acquired. We sold our position in Inspire Medical Systems, Inc., which manufactures an implantable device that significantly improves outcomes for patients with sleep disorders. We continue to be huge fans of the company and its growth rate of over 45%, but we are wary of its current valuation.
We sold our positions in UTZ Brands, Inc. and Fevertree Drinks plc as a result of the inflationary pressures affecting the margins and earnings of both companies. Proceeds were used to purchase new ideas that we felt had greater long-term upside.
Outlook
Thank you again for investing in the Baron Discovery Fund. We believe in our process and we remain excited about the businesses we own, the quality of the portfolio, and the valuations at which we own our investments. The next few years should be very exciting for the Fund.
Randy Gwirtzman & Laird Bieger
Portfolio Managers
Editor’s Note: The summary bullets for this article were chosen by Seeking Alpha editors.
Be the first to comment