

metamorworks/iStock via Getty Images
Stockholm headquartered Assa Abloy (OTCPK:ASAZY) (OTCPK:ASAZF) was formed in 1994 through a merger of Swedish brand Assa, and Finnish Abloy. The roughly 50,000 employees have been led by CEO Nico Delvaux since 2018, and have operations in more than 70 countries. Their stated strategic direction is to lead the trend towards the world’s most innovative and well-designed access solutions.
The company can essentially be summarized a manufacturer of locks, entrance systems and secure access solutions. They have the largest installed base of these products in the world – which is important as they historically generate about 66% of their revenue from the aftermarket segment (renovations, upgrades, servicing etc.), with only the remaining 33% coming from new developments. These numbers have been fairly constant over the last few years, and provides the company with somewhat of a buffer against the cyclical nature of new developments and construction.
Revenue Breakdown (Company Website)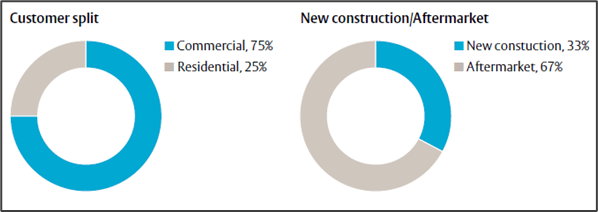
Sales can further be split into roughly 25% residential, and 75% commercial – also fairly constant through the years. Growth in the residential part of the business is to a large degree driven by smart locks and the smart home trend – things like smart access apps, which allow interconnectivity with smart home products like Google Assistant and Amazon Alexa etc.
Having the largest installed base is also meaningful given some of the drivers the company sees going forward. Traditional mechanical locks and keys are making way for more digital and electromechanical solutions, which could potentially drive higher margins and feature a SaaS type of revenue component – seeing that solutions are becoming more digital, more mobile, and more subscription based.
Consumers might not be familiar with the company, but will in all likelihood be using one of their brands on a fairly regular basis. This is because the company is a serial acquirer, having completed close to 300 acquisitions since 1994, (13 of those in 2021 alone) and the man on the street might be more familiar with some of their largest subsidiaries such as Yale (which has been around for 180 years) and has a larger focus on the residential part of the business or HID Global.
Brands (Company Website)
Acquisitions form an important part of their operating model, and in their internal models, M&A forms about 50% of their targeted growth over the business cycle. 2021 also featured the planned acquisition of the Hardware and Home Improvement (HHI) business unit from Spectrum Brands (SPB) for $4.3 billion in cash and new debt (this would be the largest in their history) and will assist them in further penetrating the north American residential segment, where Spectrum brands is a leading provider. Should the acquisition succeed, it would add about 15% to their top line.
Although the company has a fairly large geographical footprint – 83% of sales are driven by Europe and North America.
They have a diverse range of customers, including government institutions, airports, schools, private homes, private enterprise and hotels.
Breaking Down the Business
Assa’s operations can be broken down/characterized in a number of different ways. They mainly report using the following 5 divisions:
- Opening Solutions (1. EMEIA, 2. Americas, and 3. Asia Pacific)
- Global Technologies (Worldwide)
- Entrance Systems (Worldwide)
Revenue Breakdown by Division (Created by Author)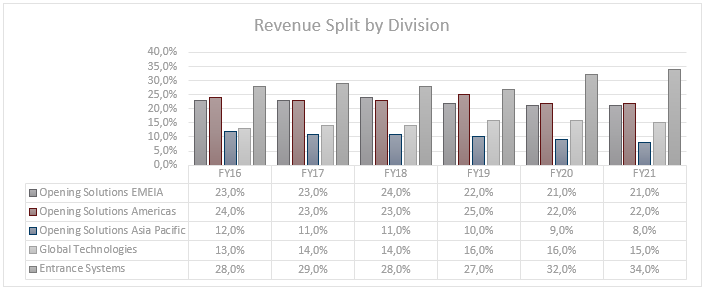
As can be seen above, opening solutions contributed around 58% of revenue in 2016. This declined to about 51% by 2021, with all 3 Opening Solution segments contributing less at the end of the period.
Global Technology and Entrance Systems have both increased their contribution over this period.
Operating Income by Division (Created by Author)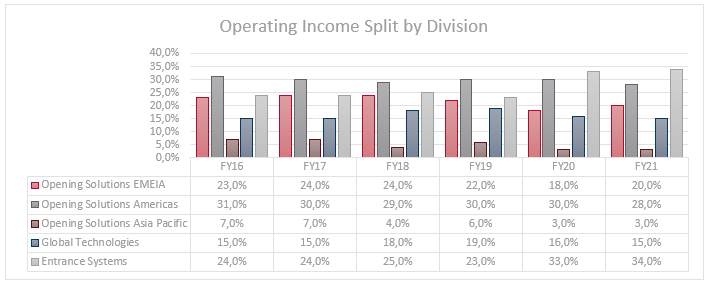
This trend holds true for the operating income produced by each segment as well. However here it is noteworthy that Entrance Systems has substantially increased its contribution over the last 2 years.
Sales can also be broken down into product groups as seen below for 2021.
Product breakdown (Company Website)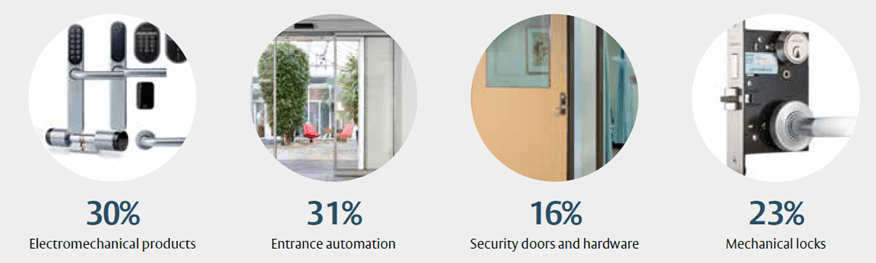
Opening Solutions:
Opening solutions primarily manufactures and sells mechanical and electromechanical locks, other hardware and security doors that are adapted to the standards of each local market and used in homes, businesses and institutions. The section is made up of a large group of companies that have strong local knowledge and brand recognition in their respective areas.
Opening Solutions EMEIA (incl. India)
- 21% of revenue;
- 20% of EBIT;
In the EMEIA segment sales in 2021 can be broken down as follows:
- Mechanical locks, lock systems and fittings: 48%
- Electromechanical and Electronic: 36%
- Security doors and hardware: 16%
Commercial is about 60% of the business with residential coming in at about 40%.
Opening Solutions: Americas
- 22% of revenue;
- 28% of EBIT
In the Americas segment sales in 2021 can be broken down as follows:
- Mechanical locks, lock systems and fittings: 42%
- Electromechanical and Electronic: 26%
- Security doors and hardware: 32%
Commercial is about 75% of the business with residential coming in at about 25%.
In North America, a slightly larger part of the business is generated by businesses, while South America is more focused on the residential side, but also busy growing the business side.
Opening Solutions: Asia Pacific (excl. India)
- 8% of revenue;
- 3% of EBIT
In the Asia Pacific segment sales in 2021 can be broken down as follows:
- Mechanical locks, lock systems and fittings: 49%
- Electromechanical and Electronic: 25%
- Security doors and hardware: 26%
This region does not quite follow the same trends as seen in the rest of the business, seeing that new construction accounts for almost 75% of sale.
In Australia and NZ, its more mature markets in the region, the trend seen in the rest of the business holds true, with more sales being generated by upgrades and renovations.
Global Technologies
15% of revenue; 15% of EBIT
This segment has a worldwide footprint. It focusses on areas such as secure access control systems.
- The bulk of this segment falls under the HID Global Brand, which accounts for about 70% of the total segment. HID has a focus on creating trusted identity solutions of people, places, and things. It provides solutions and access to things that can be accurately identified, verified and tracked – and the customer base is primarily on an institutional scale. Products include things like e-passports, ID Smart Cards (where they own the entire green card business in the US), Biometric access tech, and RFID tags and other mobile solutions.
Product Example (Company Website)
- Global solutions represent about 30% of the global technologies division. This part of the segments has eight verticals, namely 1. Hospitality, 2. Marine, 3. Senior Care, 4. Education, 5. Critical Infrastructure, 6. Construction, 7. Key and Asset Management, and 8. Self-Storage. Products in this segment includes things like electronic locks and safes, access management to rooms and areas etc.
Entrance Solutions
34% of revenue; 34% of EBIT
Entrance Solutions has four verticals:
- Pedestrian
- Industrial
- Residential
- Perimeter security.
Entrance Automation Verticals (Company Website)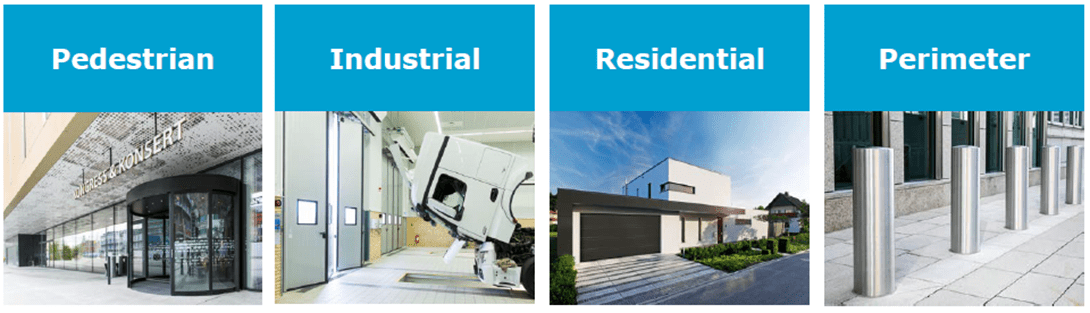
This division has experienced particularly strong growth over the last 10 years, growing at a CAGR >20% between 2010 and 2020.
About 80% is generated in the commercial and institutional settings, while the remainder is in the residential sector.
Products in this segment includes things like automatic & revolving doors, residential garage doors, loading dock equipment for factories, hangar doors etc., residential garage doors and perimeter security solutions.
Financial Snapshot
Like the rest of the market, Assa shares are down for the year. However, at -15%, they are more or less in line with major indices YTD. It has underperformed by a considerable margin compared to the SPX and ACWI over both 3- and 5-year periods, however over 10 years they are more or less in line with ACWI, but still trail the SPX by about 3% per annum.
They seem to have a fairly good grip on managing expenses, with profitability growing slightly faster than their top line over the last five years.
Over this period, they have managed the following CAGRs:
- Revenue: 5.9%
- Gross Profit: 7%
- Operating Profit: 8%
COVID and more recent supply chain issues would have impacted these numbers on various levels, so doing the same comparison over the 9-year period from 2010 – 2019 yields the following:
- Revenue: 11%
- Gross Profit: 10.9%
- Operating Profit: 10.2%
Thus, not managing expenses as effective as over the last 5 years, but still decent.
- Gross margins have been hovering just south of 40% for the last decade, after hitting low 40’s earlier.
- GAAP Operating margins typically hover in the mid-teens.
Assa is in a net debt position of about SEK 27 billion, however they appear to have excellent control of their debt load, with a debt/equity ratio of less than 0.5, and an interest coverage ratio constantly in excess of 15 times – so no concerns about their ability to service it efficiently.
In terms of returning money to shareholders, they have increased their dividend over this period by a fairly substantial 8% per annum, and the DPR is hovering around 40%, meaning there is room to potentially increase this going forward.
Despite delivering revenue and earnings beats in both Q1 and Q2 of 2022, there have been a number of significant cuts from sell-side analysts. These include: (All in SEK)
- Barclays: 330 to 280
- Bernstein: 319 to 212
- Société Generali: 300 to 270
- Citi: 305 to 245
This is likely due to fears of a market top in the industry given the fears of a recession in the near future, but it is also possible that a recent press release about the HHI acquisition could have caused this. Assa indicated that regulatory approval in the US was taking longer than anticipated, and it now looks possible that the deal could be pushed into 2023. They note however, that both parties remain committed to the acquisition.
SWOT Analysis
Strengths:
Strong R&D capabilities. Assa spends roughly 4% of revenue on its R&D efforts. This strategy seems to be working well for them, given that they have 9 500 registered patens, 500 of which were registered during the last 3 years. They also managed to launch 400 new products in the last year alone. Further evidence to the success of this strategy, is that for the last few years about 20-25% of sales were generated from products developed over the previous 3 years.
Assa’s R&D spend dwarfs that of their peers, ensuring they remain at the leading edge of innovation:
R&D Spend vs Peers (Barclays Research Paper)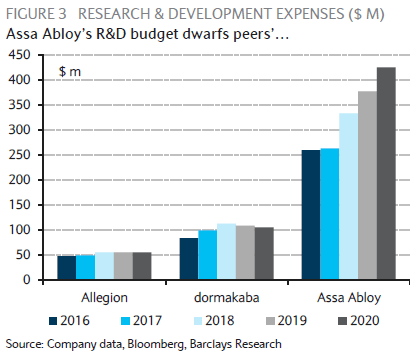
Largest installed base. This means Assa is able to generate a large portion (2/3) of their revenue from aftermarket sales and services. This provides them with some protection against macro-cyclicality which effects new developments.
Trusted brand. Assa’s stable of brands have strong recognition, which one should think is fairly important in an industry where safety and security is the main concern and objective. This provides them with a strong moat compared to smaller players or newcomers.
Cash return to shareholders. Assa has a strong history of dividend increases, and still has some more gas left in the tank should they decide to increase their pay-out ratio.
No share-based compensation. I quite like the fact that employees are not paid in massive amounts of shares, leading to a diluted share count and decreasing the value for investors. The number of shares outstanding has been constant for at least the last 6 years.
Weaknesses:
Organic growth. I believe it is quite difficult to drive organic growth (which accounts for about 50% of Assa’s total) in this industry – which would also be one of the reason’s Assa is so aggressive in their M&A endeavors. Should they, for whatever reason, start experiencing more difficulties in acquiring new brands, their growth targets could take a hit. Also related to organic growth, despite the much higher level of R&D spend by Assa compared to peers, over the last few years they have failed to deliver either superior organic growth or higher gross margins compared to main peer, Allegion (ALLE).
Mismatch in shareholding and voting power. There is a mismatch in the voting power of Assa’s largest shareholders, and their actual share of the company. The 2 largest shareholders have 9.5% and 3.1% of outstanding shares respectively, but they have > 40% of the voting power between them. Foreign shareholders account for about 67% of shares outstanding, but only 46% of the voting power.
Opportunities:
Continued Urbanization
The WHO estimates that in 2015, 54% of the global population lived in urban areas, up from 30% in 1950. And they expect it to increase to 50% of the global population by 2030 and to further increase to 70% by 2050 – that is an estimated 2.5 billion new urban dwellers. Urban areas require much more safety, security and access solutions, and thus this is a long-term positive growth driver for Assa’s industry. One would expect the largest proportion of this shift to occur in emerging markets where Assa generates only a fraction of their revenue. Thus, they would need to keep on expanding into these markets in order to capture the opportunity.
North American residential market
Assa has a weak spot in this market. The planned acquisition of HHI will provide them with a great foothold and significantly boost revenues.
Consolidation of the fragmented market. Industry reports seem to suggest that the market is still very fragmented, with some commentators suggesting that the top 3 players control less than 30% of the total market. The group states that its different segments have identified more than 900 potential targets globally – so there seems to be enough targets for further consolidation.
Shift from Mechanical to Electromechanical
Before modern tech, locks consisted mostly of normal turnkey mechanical solutions. Assa’s sales by product group over the last decade has evolved as per the below table:
|
2010 |
2021 |
|
|
Mechanical locks, lock systems, fittings |
42% |
23% |
|
Entrance Automation |
11% |
31% |
|
Electromechanical and electronic locks |
25% |
30% |
|
Security Doors and Hardware |
22% |
16% |
From the above it is clear that there is a strong trend away from mechanical (-19%) towards more advanced systems. Given that Assa has the biggest installed base, they are certainly in the inside lane when it comes to upgrading that base with new tech. It is also estimated that mechanical locks have a lifespan of about 15-40 years, while electromechanical only has a lifespan of 7-15 years. Thus, older products are being replaced by newer products, which likely have higher margins, and need replacing more often.
Recurring Revenues. As mentioned above, Assa believes that the software component that is becoming part of modern-day secure access solutions will provide them with an opportunity to increase their portion of recurring revenue. SaaS revenues currently represent about 5% of total revenues, but it saw growth of about 45% in 2021 – much faster than any other segments in the business. Given the likely amount of software license, service agreements, and identity management that will be required in the future, it is quite easy to see this number increase substantially.
Threats:
Risks related to M&A
Assa has a good track record in terms of successfully merging new acquisitions, but at the pace they seem to be doing it, there is always a risk in terms of integrating and trimming the new company successfully and efficiently. There has, as an example, been a Chinese company that was acquired, and subsequently it was found to have overstated its revenues.
Antitrust issues
At the rate Assa is acquiring, one might think that sooner or later they will start to run into some antitrust issues. This might also force them to look for new areas of growth outside of their main areas of expertise, i.e., secure entrance systems and hardware. They might have to go looking outside of their natural hunting ground as any further acquisitions in their staple of doors, locks and entrance systems could lead to regulators taking a negative view on such moves.
Valuation
Stated Targets
Assa guides towards revenue growth of 10% per year through the cycle. (5% organic and 5% acquisitions), while achieving an operating margin of between 16 and 17%.
The following targets have also been announced:
- Revenue by 2026: 150 billion SEK (vs 154 in my base case)
- Operating Profit by 2026: 25 billion SEK (vs 25.6 in my base case)
Growth Assumptions
I would be surprised to see major changes in Assa’s growth trajectory. The drivers at play are slow and steady forces, not disruptive, industry shaking changes. Historically, they have achieved fairly constant growth of about 10% per annum in the decade pre-Covid, although there was some cyclicality in between.
In my base case, I grow each sector at the average CAGR achieved over the period of 2016 – 2019. This excludes 2020 COVID driven declines.
This leads to a revenue CAGR of 10.2% over the forecast period, in line with Assa’s stated targets.
In my bear and bull cases, I use the same average CAGR ± 1%.
Margin Assumption
I assume gross margin expansion of 70 bps over the next 5 years – pushing this to 40.5% vs 39.8% currently. I also model a decrease of about 60 bps operating expenses. This leads to an EBIT margin of 16.6%. (vs internal target of 16-17%). Both my gross and operating margin are in line with what has previously been achieved by Assa.
Tax Rate Assumption
The corporate tax rate in Sweden is 20.6%. However, Assa’s effective rate has averaged roughly 22.7% over the past 3 years. I have modelled for this rate to continue in all models.
Dividends and Share Buyback Assumption
The number of shares outstanding have been constant over the last 6 years. Dividends have grown at a CAGR of 8%. I have assumed both of these growth rates to continue over the forecast period.
Fair Value:
- Base Case: FV of 262 SEK, upside of 12%
- Bear Case: FV of 173 SEK, downside of 26%
- Bull Case: FV of 360 SEK, upside of 54%
Thus in summary – I believe Assa Abloy is currently reasonably valued by the market, however I do the possibility of outcomes is skewed towards the upside.
Relative
On a relative basis, Assa might currently look cheap when looking at the last 10 years, now trading at a forward P/E of 1x standard deviation below its mean.
Forward Price to Earnings Multiple (Bloomberg Terminal)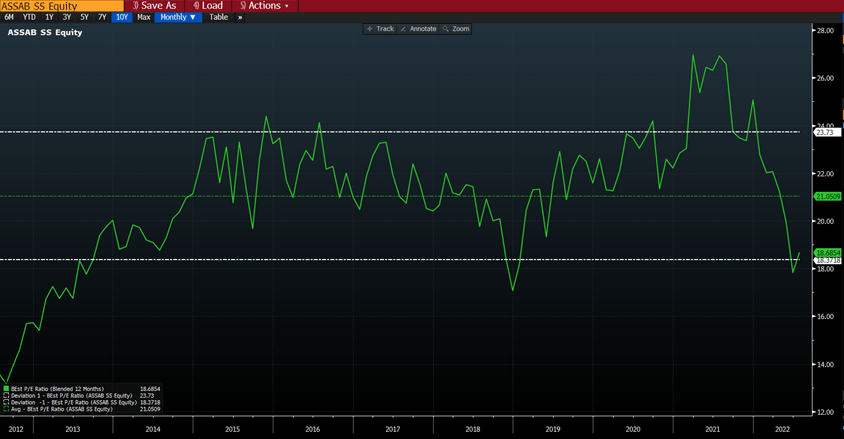
However, zooming out some more shows that this can be misleading, as over a longer period (± 17 years), Assa is still trading at a higher forward PE than its long-term average.
Forward Price to Earnings Multiple ext (Bloomberg Terminal)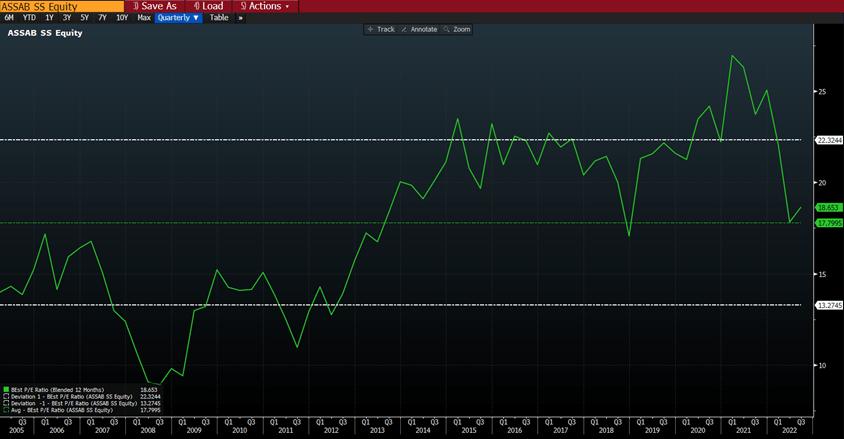
The share is also currently trading on a PEG Ratio in the region of 2 times, which certainly takes it out of the cheap category.
When considering historical P/Es and comparing with the S&P over the last 15 years, there seems to be a small dislocation at current levels, about 20% from the mean.
Spread between Assa PE and SPX PE (Bloomberg Terminal)
Conclusion
I believe Assa Abloy is a fantastic company, with a reasonably deep moat and products that will remain relevant for years to come – especially given its high level of R&D expenditure.
However, I also believe that the market has a fairly firm grasp of the company, and the upside from current levels is not substantial.
Be the first to comment