

Banco do Brasil (OTCPK:BDORY) is a bank headquartered in Brazil that provides banking products and services for individuals, companies, and public sectors domestically and internationally. Perhaps this stock deserves coverage from us because it is relatively obscure, compared to more significant bulge bracket banks in the US, and also numerous banks across Latin America. Looking into its financial statements, we think that the complex reporting of its assets and liabilities made it unloved for both investors and analysts to understand the intricacies behind the numbers. Nevertheless, our in-depth evaluation in this article will cover our investment theses on why we think that BDORY will continue to prosper against the current macroeconomic headwinds, coupled with our Dividend Discount Model that will display its enormous upside potential based on our conservative projections of its income streams and dividend payouts.
Investment Theses
“There Is No Alternative” Emerging Markets
For investors chasing high returns for their portfolios, investing in the BRICS markets would provide the best risk-adjusted returns in the past. However, all of these have changed in the span of these recent few years. The hostility between the two global superpowers has brought down high growth rates in China; not forgetting the most recent Russia-Ukraine war that saw financial companies writing off their investments in Russia. That leaves investors with three of the five original countries in the renowned acronym used to describe the major emerging markets. Since Saudi Arabia is mainly an oil exporting country, we feel that investing in the banking industry between India and Brazil, the latter has greater growth potential for a couple of reasons.
Firstly, despite both countries being cash-dependent economies, we continue to see high adoption of digital banking services in Brazil compared to India. The latter recorded a 97% increase while the former recorded a 74% increase in its M1 money supply for the past five years. We chose to compare the M1 money supply (cash, checking accounts, travelers’ checks, demand deposits, and other checkable deposits) for it is the closest proxy of the volume of cash circulating the economies at any point in time. As such, it is easier for Brazil to move towards a cashless society faster than India. Furthermore, the Central Bank in Brazil saw the need for instant electronic money transfers and created Pix, an instant payment platform with the goal of reducing transactions in paper currencies. Since its inception in November 2020, it was utilised by almost 71% of the population in Brazil, thus displaying a huge acceptance of an alternative to existing traditional payment instruments.
Next, the population of Brazil has a higher purchasing power compared to that of India. This could be shown by comparing the average median income in 2022. The former weighed in at 2585 BRL compared to the latter at 20,000 rupees. This means that Brazilians are earning almost twice as much as the Indians after converting to a common currency (US Dollar), which is important to note as this could affect the amount of disposable income the population has for spending on goods and services or saving. Even though the change in the Purchasing Power Parity (PPP) between Brazil and India over the past five years reflects a higher percentage change in the former than the latter, the Brazilians would still stand to gain more in terms of the material standard of living and increased savings as compared to the Indians after accounting for larger inflation.
Lastly, we prefer the fundamental mechanics of the Brazilian banking industry compared to that of India. Banks across both countries generate both interest and non-interest income in the same ways; either by lending money to consumers/financial institutions or providing financial-related services, or gains on their investments. The edge that Brazil has over India is that it is moving towards a sustainable financial model that enables the society at large to benefit from access to credit. Generally, banks in Brazil have been actively increasing their exposure to sustainable agribusinesses and social businesses by providing credit lines to segments with positive social-environmental impacts on the sectors of renewable energy, energy efficiency, construction, transport and sustainable tourism, water, fishing, forest, sustainable agriculture, waste management, education, health, and local and regional development. While India has also invested heavily in “green finance”, this transformative move would provide the necessary capital for the agricultural industry in Brazil to position itself as one of the leading producers of agricultural exports in the world, even with a declining share of the total employment. In addition, the loans provided to micro and small enterprises could further develop Brazil’s economy as it currently generates one-third of the country’s GDP in 2021 with more room for growth in the next decade or so to come. Compared to India’s micro and small enterprises, banks in India are less reluctant to provide credit despite accounting for nearly 27% of GDP in 2021. This has something that has got to do with their policies articulated perfectly here. As such, this reinforces our belief that by supporting the development of Brazil and building an increasingly sustainable future for society, the Brazilian banking industry is more lucrative than that of India.
Growth in Agricultural Industry
Our next investment thesis will extend on Brazilian’s agricultural strengths, which we briefly touched on in the paragraphs above, and will continue to discuss the BDORY’s strong positioning in the sector.
As the longevity of mankind increases with advances in technology and medical care, the human population is set to reach 8.5 billion by 2030. Thus, there would undoubtedly be an increasing demand for food and Brazilian agricultural exports that includes soybean, corn, wheat, poultry, beef, cocoa, cotton, tobacco, and sugar (just to list some examples). The Latin American country has been consistently producing either the largest or a large proportion of the products listed above.
Given the importance of the agricultural industry in Brazil to the world at large, the only way to expand agricultural production is to secure a credit line from financial institutions that would provide the necessary liquidity and capital to expand operations. Among its peers, BDORY is one of the largest providers of credit to private sectors, with a 21% exposure of its loans to corporations involved in the agricultural business in 2021.
Rmcarvalho/iStock Editorial via Getty Images
Peer Comps
To determine if BDORY is a better choice than its peers, we have to examine its profitability and credit quality. Compared to its peers, Banco do Brasil is more profitable than its peers as seen by a higher net income margin and LTM non-interest income-to-total revenue ratio than the median figure for its peer comps.
Peer Comps, LTM Non-Interest Income/Revenue and Net Interest Margin in % (Capital IQ )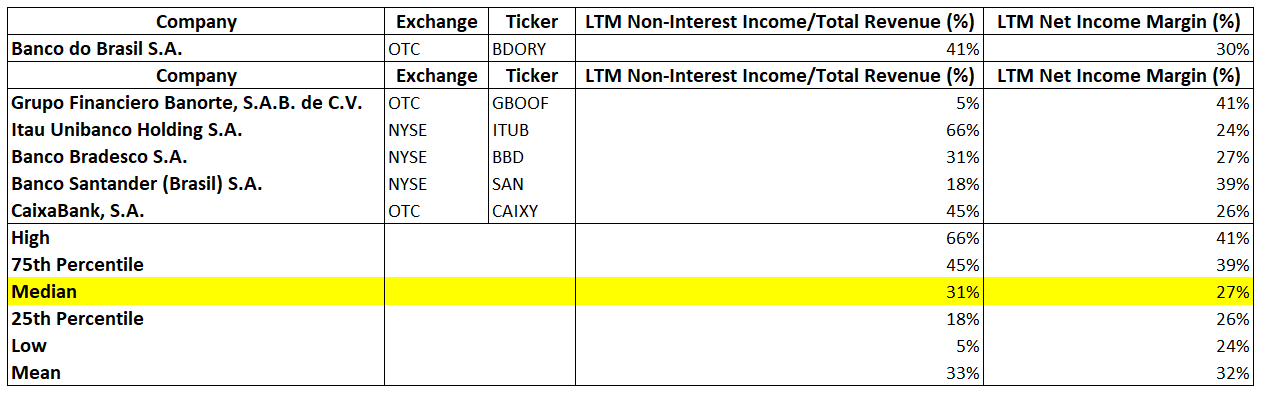
BDORY’s credit quality relative to its peers is exceptional as well. This is evident from the non-performing loans (NPL) ratio, which is the ratio of non-performing loans to the total loan portfolios of the respective banks. We identified those NPLs as loans that are delinquent by more than 90 days as they have a higher probability of default. From the NPL ratios below, it is evident that BDORY’s credit quality of borrowers is higher than most of its peers and even the Brazil Banking Industry’s average. It is also worth noting that BDORY’s non-performing loans grow at a much slower rate than its total loans compared to its peers, as seen from the gradient of the NPL ratio curves.
Peer Comps, NPL Ratio in % (Respective Company’s Investors Relations)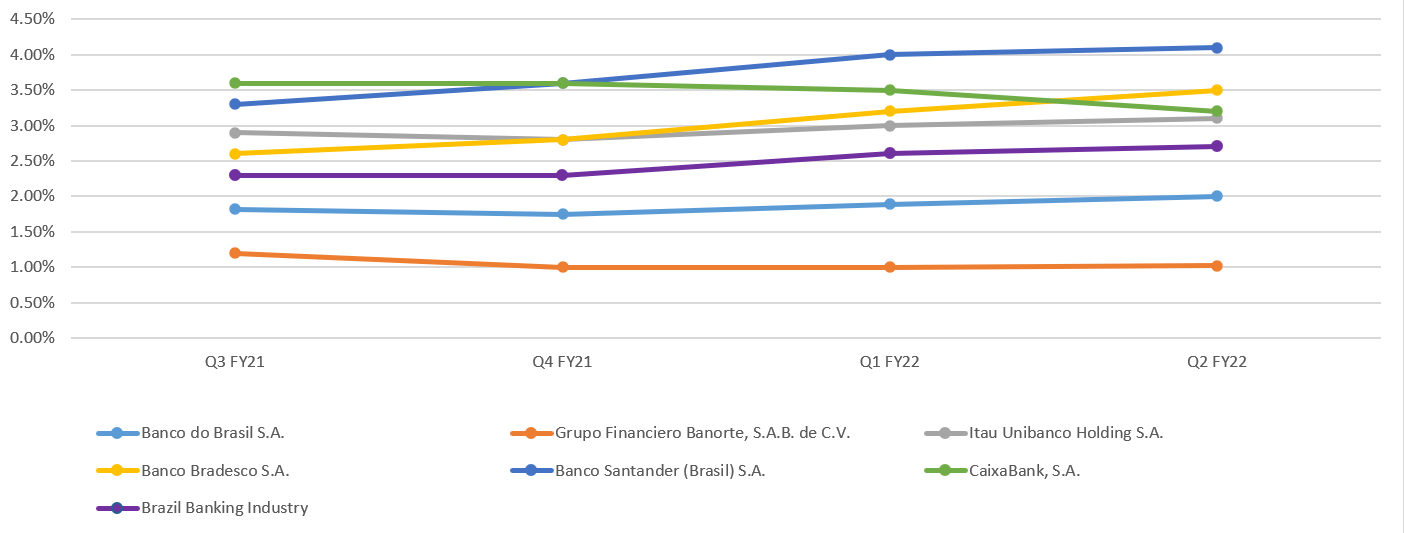
BDORY also has the best coverage ratio compared to its peers. Coverage ratio refers to the ratio of provisions/allowances for potential credit losses to non-performing loans. This reveals more about the bank’s financial stability by identifying non-performing loans covered by the respective provisions/allowances. From the decreasing gradient of the graph below, BDORY is also actively reducing its allowances for uncollectible debt despite NPLs increasing slightly. This signifies financial stability and strength for the bank as there is a significant increase in the recovery of write-offs, once again displaying BDORY’s excellent credit quality of borrowers.
Peer Comps, Coverage Ratio in % (Respective Company’s Investors Relations)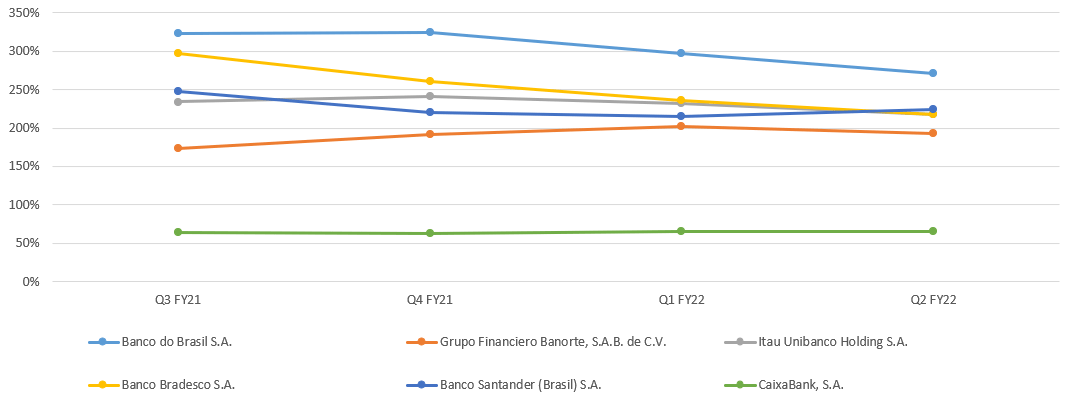
Last but not least, BDORY also has the lowest cost of risk relative to its peers. The cost of risk is the annualised ratio of provisions/allowances recognized by the bank to its loan portfolio. Similar to the coverage ratio, the cost of risk measures financial stability by charting estimated future losses against its loan portfolio. From the comparison, it is clear that BDORY makes a conscious effort in the TTM to protect itself from macroeconomic headwinds such as rate hikes that stress borrowers to make installments on their loans.
Peer Comps, Cost at Risk in % (Respective Company’s Investors Relations)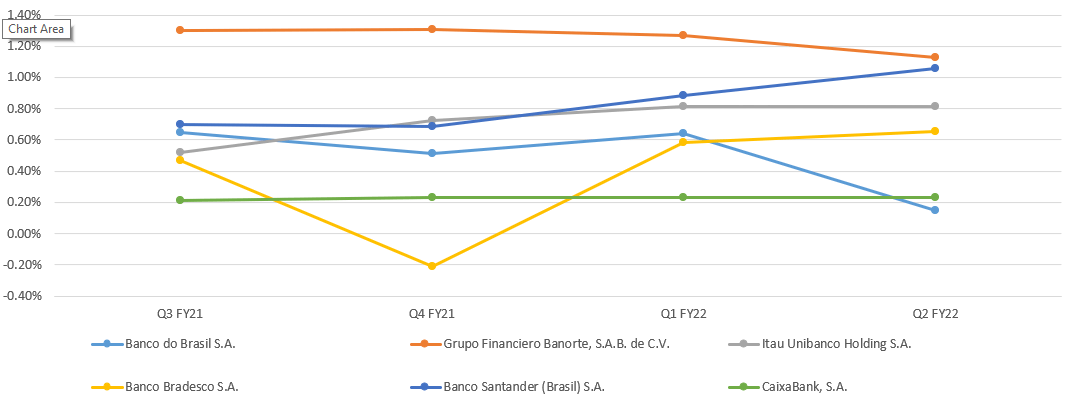
We also note that BDORY is trading at half of its peer comps for the price to tangible book value (P/BV), which is the book value of the company minus any intangible assets. Despite this presenting a value proposition for investors hoping for a reversion of P/BV back to the industry average, we believe that the bank is cheap for a reason. Looking at the LTM net debt to capital ratio, BDORY has a higher proportion of debt relative to its shareholders’ equity compared to its peers. As such, this poses a risk to the balance sheet as more profits would go to servicing the current portion of long-term debt, leaving lesser for the distribution to shareholders as dividends. Especially with persistent rate hikes, the cost of servicing these debts could keep on rising as well.
Peer Comps, P/B ratio and LTM Net Debt/Capital in % (Capital IQ)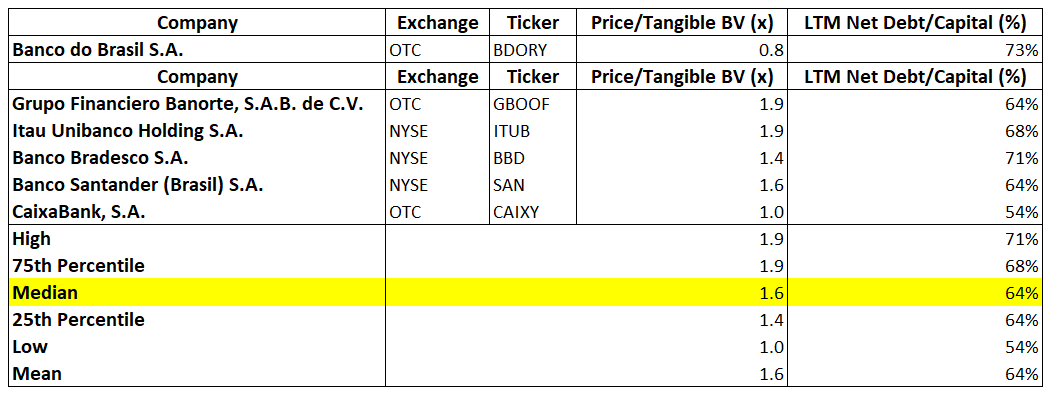
Valuation
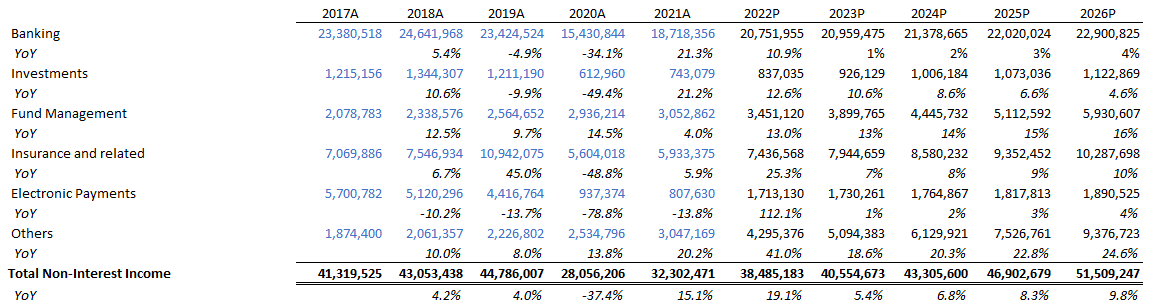
The company reports its earnings in 6 different segments and in accordance with the IFRS. We broke down our projections into interest income and non-interest income for the respective segments. Our assumption projects the net interest income growth at the lower range of the management’s projections, which is 13%, minus a few percentage points to be conservative in such times of bearish market sentiment. For the projections of non-interest income, we took the trailing 5Y average forecasting from FY23 onwards as we notice revenue segments did not change drastically and non-interest income constitutes a small portion of total net income. However, we projected a larger-than-expected growth in the non-interest income from electronic payments in FY23 to be congruent with our investment theses, subsequently tapering it down.
Interest Income Projections in Thousand Reals (Author’s Spreadsheet ) Non-Interest Income Projections in Thousand Reals (Author’s Spreadsheet )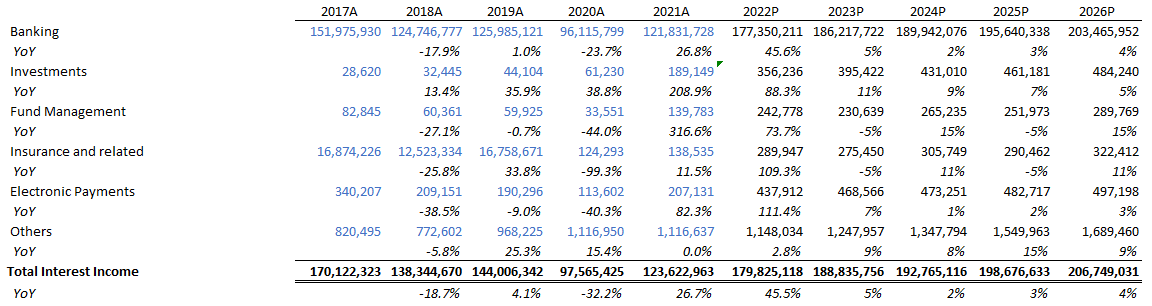
For the cost drivers, we continue to drive future costs as a long-term average of each component for both interest and non-interest expenses as we think that BDORY’s operating costs have gone up relatively in tandem with its long-term trend as it consolidates branches and increases the headcount of employees, as well as greater investment activity and larger deposits from both financial institutions and retail. As there are many liabilities from the issuance of securities maturing within our projected years, we decided to model a scenario where BDORY will issue securities at the same rate from 2017-2021. This would offset the liabilities that have matured throughout our projected years.
Interest and Non-Interest Expense Projections in Thousand Reais (Author’s Spreadsheet )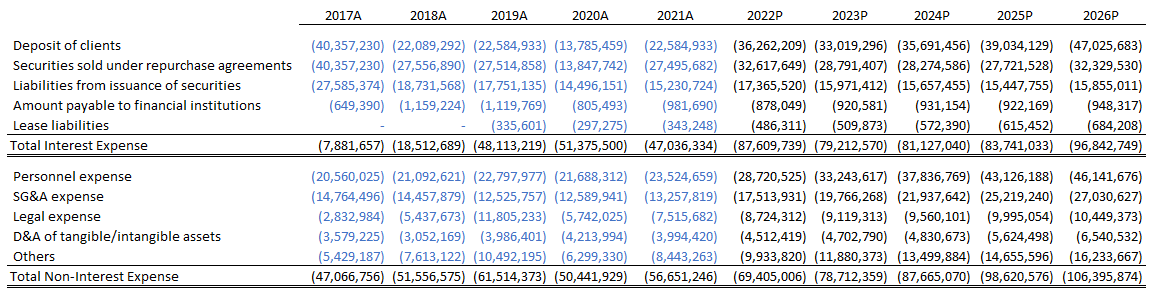
After generating the projections, we chose to build a dividend discount model as it is the most accurate way of deriving the present value of all its future dividends. The model below shows the breakdown of all the projections for income statement and dividend payout ratios. For the payout ratio, we assumed that its payout ratio will return back to its normal levels before 2020 by significantly tapering it down. Considering shareholders’ equity, we made sure that BDORY has managed to keep a minimum tier 1 ratio as required by regulations.
Dividend Discount Model (Author’s Spreadsheet)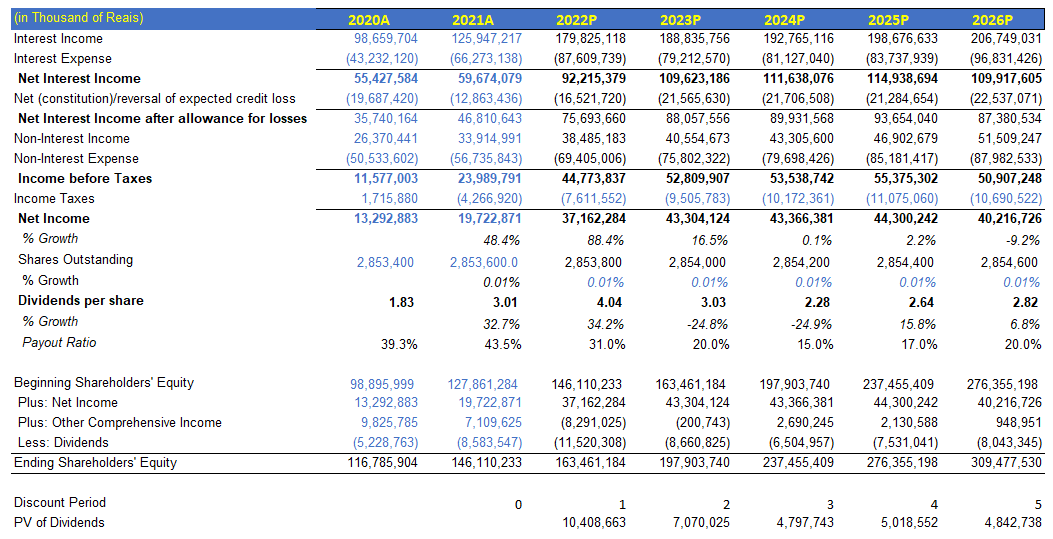
This brings us to calculate the present value of the terminal value using the shareholders’ equity using BDORY’s current P/BV as our exit multiple. The reason being BDORY would most likely remain below P/BV of one in the next five years, even after recovering to pre-pandemic levels from previous financial years. We took the sum of the present value of all projected dividends and its terminal value, divided by its projected diluted shares outstanding at a 0.01% increase year-on-year (trend from previous years). This brings us to an implied valuation of USD11.91, which is a 62.3% upside from the current prices.
DDM Calculation (Author’s Spreadsheet)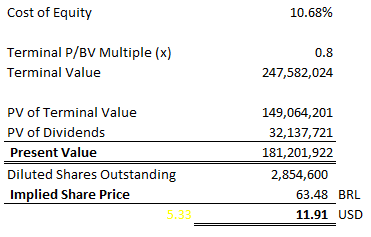
To check the sensitivity of our projections, we conducted a sensitivity analysis with the cost of equity against its terminal P/BV value. All the values on the table are significantly higher than the current price of BDORY’s stock, despite a wide standard deviation of values.
Sensitivity Analysis (Author’s Spreadsheet)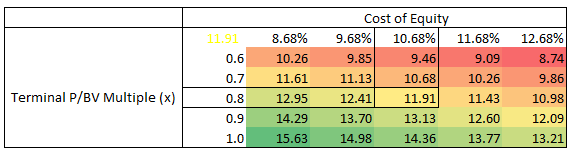
Risk
A risk that is pertinent to our valuation is the risk of dividends being cut excessively. BDORY’s current dividend yield is at 7.54% which is almost double the median of the banking sector of 3.26%. Based on historical data, BDORY had inconsistent dividend payouts for the past ten years. If BDORY reduces its dividends despite its stock price being up YTD, it could potentially affect the price based on our dividend discount model. We think that there could be a high chance that the bank reduces its dividends but increase its share buybacks to return value to its investors in a different approach.
Conclusion
Banco do Brasil is rated as the top of its industry class for a reason. Not only is the bank exposed to the agricultural industry in Brazil with growing importance in the world, but it is also well positioned for enormous growth as part of the emerging markets. By conducting a simple valuation model, our conservative and realistic estimates show double-digit upsides in all scenarios. Hence, BDORY remains a top pick for us for investors looking to position their portfolios for the long run against the current macroeconomic headwinds and ride the wave of growth for emerging markets.
Be the first to comment