


andresr
Overview
In an October 7, 2021 article on AutoZone (NYSE:NYSE:AZO), O’Reilly (NASDAQ:NASDAQ:ORLY), and other auto part retailers, I articulated my key thesis, which I have summarized and updated in the table below.
|
Thesis |
Update |
|
1. Even though growth in the auto industry has been tepid, leading auto part retailers have consistently delivered attractive growth due to superb execution and market share gains |
O’Reilly and AutoZone have continued to execute well through positive comp store sales and opening new stores. => Thesis 1 continues to hold true |
|
2. Revenue growth accelerated following the COVID-19 outbreak as consumers spent more time and stimulus money on their cars and chose to drive in lieu of taking public transport |
Thesis 2 continues to hold true. However, the COVID-19 outbreak also led to supply chain disruptions and semi-conductor shortages, which together with the Federal Reserve’s actions to increase money supply to stave off a deep recession, has resulted in sharp cost inflation in the auto parts sector => Auto parts retailers have been able to pass on the price increases to customers. However, real (inflation-adjusted) revenue growth appears to be plateauing, and the sector’s growth is likely to slow down as inflation moderates in response to the Fed’s recent aggressive rate hikes |
|
3. The slowdown in new car production resulting from the semiconductor chip shortage is causing consumers to purchase used cars and drive them longer |
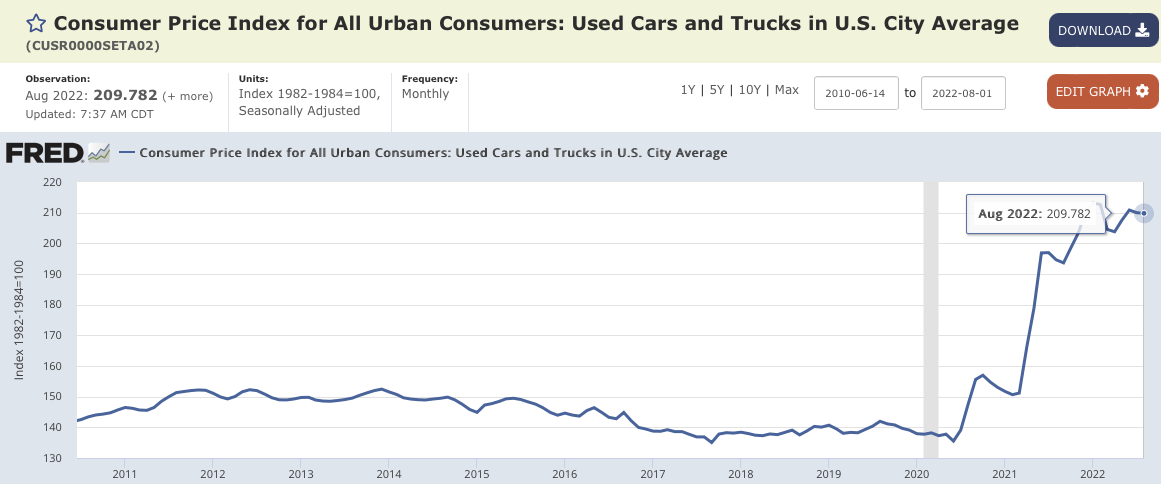
The number of vehicle miles driven in the US has returned to near pre-pandemic levels. However, the number of new vehicles sold has remained weak and remains well below 1999-2007 and 2012-2019 levels, while the consumer price index of used cars is 50% above pre-COVID highs => The number of miles driven has recovered but the new car sales have not, which indicates that existing cars are kept longer and driven further, which is positive for replacement auto part retailers |
1. Update on auto retailer growth
Store count growth
AutoZone and O’Reilly have both continued to steadily grow their store counts (figure 1).
Figure 1: Store count
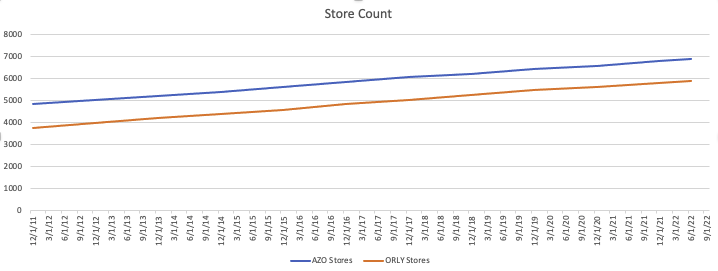
Created by author using publicly available financial data
Comp store growth
The comparable store sales of AutoZone, O’Reilly, and Advanced Auto (AAP) surged following the COVID-19 outbreak but are returning to historical levels (figure 2).
Figure 2: Comparable store growth

Created by author using publicly available financial data
Revenue growth
Driven by strong positive comp store sales and growing store counts, revenues have accelerated over the last 2 years (figure 3). As a result, AutoZone and O’Reilly’s trailing twelve-month (TTM) per-share revenues have more than doubled since 2017 (figure 4, green and orange lines) and out-grown competitor Advanced Auto (blue line).
Figure 3: Actual TTM Revenues
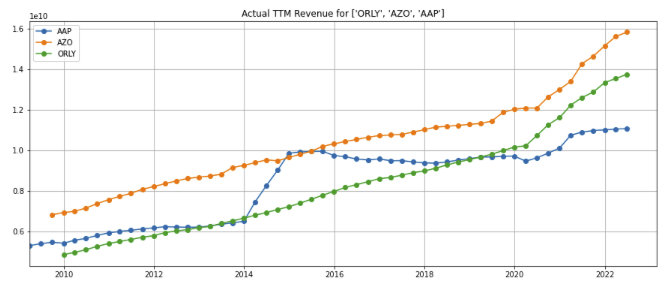
Created by author using publicly available financial data
Figure 4: Actual TTM Revenues, indexed to 2016-12-31
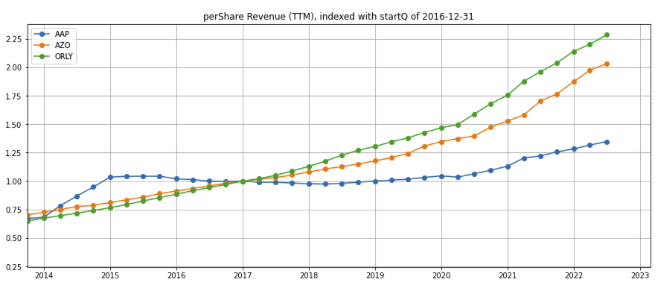
Created by author using publicly available financial data
Gross margins
Over the last eight years, gross margins for AutoZone and O’Reilly have been markedly higher than Advanced Auto’s. Gross margins have stayed within a 2 percent band for all three companies, indicating that industry participants have some level of pricing power (figure 5).
Figure 5: Gross profit margin comparison

Created by author using publicly available financial data
Operating leverage
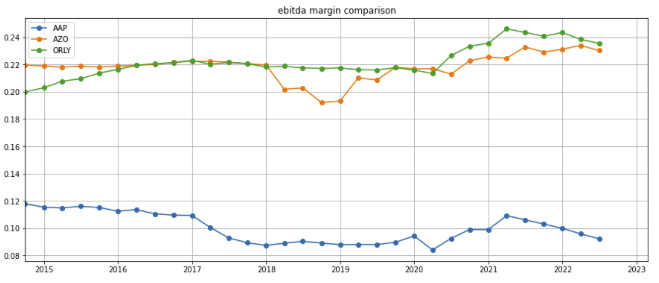
Overhead selling, general, and administrative (SG&A) expenses as a percentage of revenues have declined for AutoZone and O’Reilly as their revenues accelerated (figure 6, orange and green line), resulting in long term operating leverage that has driven up their EBITDA margins (figure 7, orange and green lines). In contrast, Advanced Auto appears not to have benefited as much from operating leverage (figures 6 and 7, blue lines)
Figure 6: Selling, General and Administrative expense margin comparison
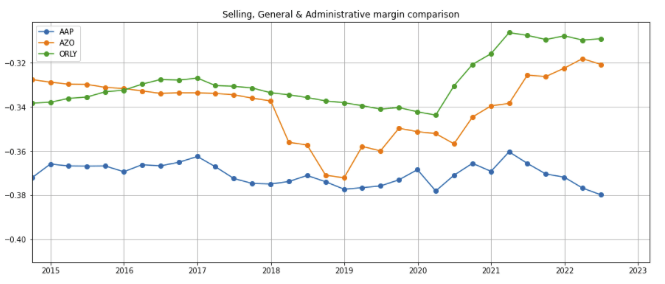
Created by author using publicly available financial data
Figure 7: EBITDA margin comparison
Created by author using publicly available financial data
Stock price growth
As a consequence of the strong revenue growth and EBITDA margin expansion, the stock prices of AutoZone and O’Reilly (figure 8, orange and green lines) have both increased by more than 2.5x since 2017 and outperformed the S&P 500 index (pink line) as well as Advanced Auto (blue line).
Figure 8: Stock price comparison

Created by author using publicly available stock price data
2. The effect of inflation
Effect on revenues
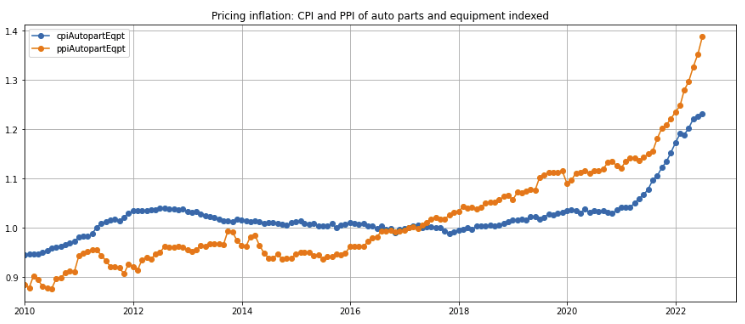
Per-share revenues of AutoZone and O’Reilly have increased by 2x and 2.5x respectively since 2017 (figure 4 above). However, a non-trivial portion of the companies’ revenue growth was driven by the price inflation of auto parts and equipment which, according to the Bureau of Labor Statistics (BLS) data, has accelerated since 2021 (Figure 9).
Figure 9: Pricing inflation of auto parts and equipment
Federal Reserve FRED
Even though AutoZone’s reported revenue has increased by 40% since the COVID-19 outbreak (figure 10, blue line), its real, inflation-adjusted revenue has grown by less than 20% over the last two years (orange and green lines).
Figure 10: AutoZone revenues: nominal and inflation adjusted, indexed
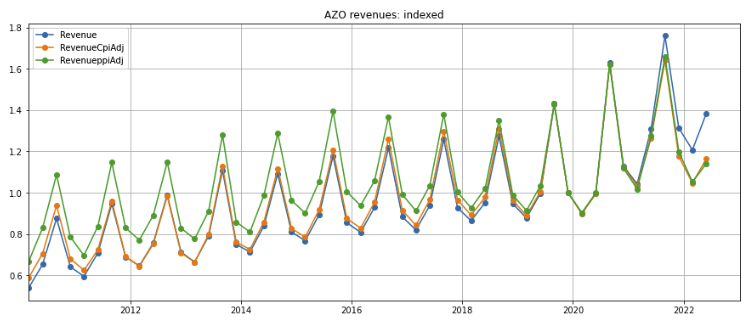
Created by author using publicly available financial data, Federal Reserve FRED
Similarly, even though O’Reilly’s revenue has expanded by over 40% since Q1 2020 (figure 11, blue line), its real, inflation-adjusted revenue appears to be plateauing (orange and green lines).
Figure 11: O’Reilly revenues: nominal and inflation adjusted, indexed

Created by author using publicly available financial data, Federal Reserve FRED
Based on the chart shown in figure 5 above, the gross margins of AutoZone and O’Reilly have been reasonably stable over a long period of time, indicating that unlike deep discounters such as Ross Stores, both have been able to pass on cost increases to their customers and benefited from inflation thus far. However, I do not believe auto part retailers can raise prices faster than inflation. Unless demand for auto parts continues to accelerate going forward, the nominal revenue growth of both companies will moderate when inflation moderates with the Federal Reserve’s aggressive rate hikes.
Effect on inventory
Both companies have managed their inventories well and unlike what we have seen in other industries, there has been no indication of over-stocking so far. On the contrary, AutoZone’s days of inventory held (defined as nominal inventory / quarterly cost of goods sold * 90) has dropped to 8-year lows while O’Reilly’s days of inventory is at an all-time low (figures 12 and 13, blue lines). The inflation-adjusted inventory days are even lower (orange and green lines).
Figure 12: AutoZone inventory days: nominal and inflation adjusted, indexed

Created by author using publicly available financial data, Federal Reserve FRED
Figure 13: O’Reilly inventory days: nominal and inflation adjusted, indexed

Created by author using publicly available financial data, Federal Reserve FRED
(For the accounting geeks amongst us: both companies use the last-in, first-out (LIFO) method to determine inventory cost — AutoZone’s LIFO cost is less than 10% above replacement cost while O’Reilly has a LIFO value in excess of replacement value, i.e., their inventory values are not understated)
3. Leading indicators of auto parts demand
I believe a high number of vehicle miles driven and lower sales of new cars are good leading indicators of strong future demand for auto parts.
Total vehicle miles traveled
The number of total vehicle miles traveled has almost recovered to the levels set before the COVID-19 pandemic outbreak (figure 14).
Figure 14: Moving 12-month total vehicle miles traveled

Federal Reserve FRED
Total new vehicle sales
However, total new vehicle sales of 13.6 million for the twelve months ended August 2022 remains under 75% of the pre-COVID peak of over 18 million (figure 15) as manufacturing output was depressed by semi-conductor chip and OEM part shortages.
Figure 15: Total new vehicle sales
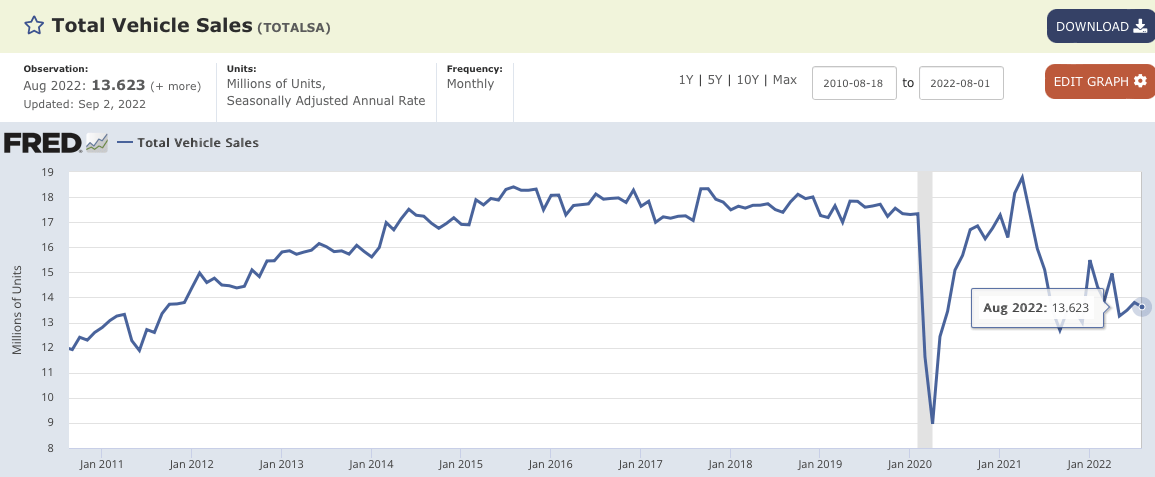
Federal Reserve FRED
Used car prices
Prices for used cars and trucks hover at 50% above pre-COVID levels, indicating strong demand for used vehicles and the likelihood that these vehicles will be used longer. This portends increased demand for auto parts.
Figure 16: Consumer price index for used cars and trucks
Federal Reserve FRED
4. Leverage
Based on their interest and debt coverage ratios, both companies are conservatively capitalized and have limited financing risk.
Figure 17: AutoZone debt statistics
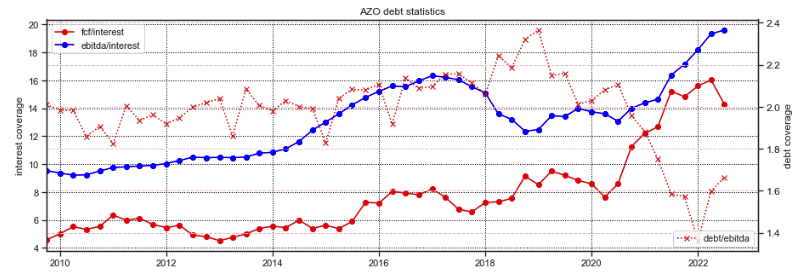
Created by author using publicly available financial data
Figure 18: O’Reilly debt statistics
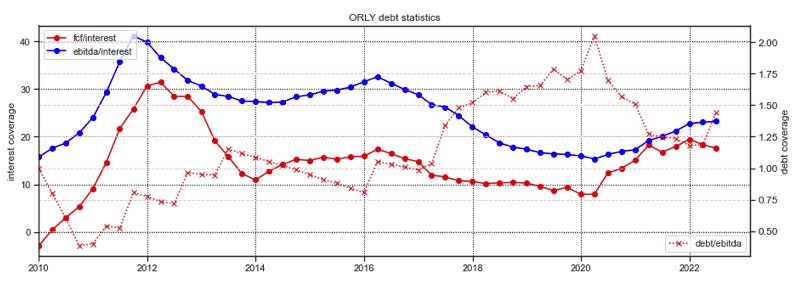
Created by author using publicly available financial data
Valuation
AutoZone and O’Reilly both trade at around a 6% free cash flow yield (figure 19, orange and blue lines), near the high end of but within their 7-year historical ranges.
Figure 19: Free cash flow yields
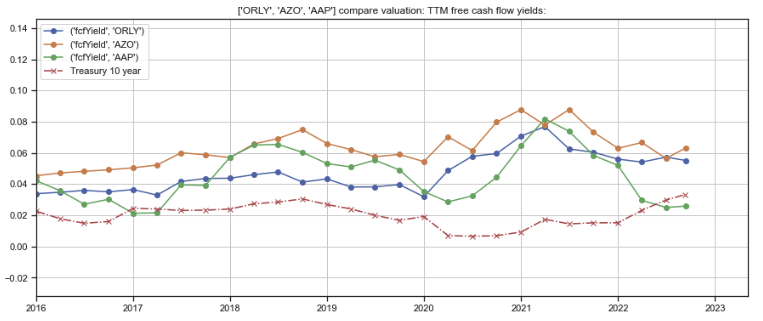
Created by author using publicly available financial and stock price data
On an earnings yield (1 / price earnings ratio) basis, AutoZone trades slightly cheaper than O’Reilly (figure 20, orange vs blue line), and both trade closer to the middle of their 7-year historical ranges.
Figure 20: Earnings yields

Created by author using publicly available financial and stock price data
Main Concern
As a long term buy and hold investor, I am concerned that the increase in the share of electric vehicles, which require far fewer parts than combustion engine vehicles, could erode the value of the traditional auto part retailers. According to the International Energy Agency (IEA), global sales of electric cars hit 6.6 million in 2021, more than tripling its market share from two years ago and now represent 9% of the global market (Figure 21).
Figure 21: Sales and share of electric cars

International Energy Agency (IEA)
Source: IEA
Even though US electric car registrations lag and auto part sales continue to grow steadily, the erosion of value could occur within the timeframe of my intended 10+ year holding period.
Summary
My long-term thesis that leading auto part retailers will continue to deliver attractive growth due to superb execution and market share gain despite tepid growth in the auto industry continues to hold.
Growth in AutoZone and O’Reilly’s revenues after the COVID-19 outbreak were boosted by auto part price inflation due to supply chain distortions, semi-conductor shortages, and the Federal Reserve’s easy money policies have boosted. This growth will moderate as inflation recedes.
Even though the number of miles driven in the US has returned to near pre-pandemic levels, new vehicles sales remain weak. This indicates that existing cars will be kept and driven longer, which is positive for replacement auto part retailers.
Valuations of both companies have remained well within historical range.
I intend to hold onto my position but will be keeping a close watch on the long-term risk that the share growth of electrical vehicles, which require fewer parts, may reduce the value of traditional auto part retailers.
Be the first to comment