

JHVEPhoto
Based in California, Autodesk, Inc (NASDAQ:ADSK) is a software company specializing in CAD software. We analyzed the company as its average revenue growth had accelerated in the past 5 years from 7.91% (10-year average) to 17.2%. We looked into its revenue breakdown by its product families, geography and distribution channels to determine which segment (which has greater than 10% of revenue) had driven its growth.
Products Revenue Growth Driven By AutoCAD and AEC Segment
|
Autodesk Revenue By Product Family ($ mln) |
2017 |
2018 |
2019 |
2020 |
2021 |
2022 |
Q1 2023 (YoY) |
Average |
|
Architecture, Engineering and Construction (‘AEC’) |
881 |
867 |
1,022 |
1,377 |
1,649 |
1,960 |
518 |
|
|
Growth % |
-1.6% |
17.9% |
34.8% |
19.7% |
18.9% |
17% |
17.8% |
|
|
Manufacturing |
626 |
589 |
616 |
726 |
799 |
876 |
225 |
|
|
Growth % |
-5.8% |
4.6% |
17.8% |
10.0% |
9.7% |
14% |
8.4% |
|
|
AutoCAD and AutoCAD LT |
327 |
401 |
732 |
948 |
1,099 |
1,253 |
346 |
|
|
Growth % |
22.9% |
82.3% |
29.6% |
15.9% |
14.0% |
21% |
30.9% |
|
|
Media and Entertainment |
138.9 |
152 |
182 |
199.2 |
219.4 |
258.9 |
68 |
|
|
Growth % |
9.4% |
19.7% |
9.5% |
10.1% |
18.0% |
24% |
15.1% |
|
|
Other |
58.7 |
47.5 |
18.2 |
23.7 |
24.4 |
38.6 |
13 |
|
|
Growth % |
-19.1% |
-61.7% |
30.2% |
3.0% |
58.2% |
44% |
9.1% |
|
|
Total net revenue |
2,031 |
2,057 |
2,570 |
3,274 |
3,790 |
4,386 |
1,170 |
|
|
Growth % |
1.3% |
25.0% |
27.4% |
15.8% |
15.7% |
18% |
17.2% |
Source: Autodesk, Khaveen Investments
Based on its revenue breakdown, its largest product family is Architecture, Engineering and Construction (AEC) which represented 45% of its revenues in FY2022 and had an average growth of 17.8% which was above its total company average of 17.2%. According to management in its latest earnings briefing, the company had extended its partnerships with existing customers such as AECOM, a Fortune 500 consulting firm involved in design, planning and construction management, for its AEC segment with a renewed enterprise business arrangement (EBA) with Autodesk. Moreover, the company also announced new features including Bridge to enable greater collaboration between construction teams.
However, its second-largest product family is AutoCAD which represented 29% of revenue but had a superior average growth of 30.9% in the past 5 years including Q1 2023 and well above its total revenue average growth of 17.2%. That said, its revenue growth was skewed upwards by the surge in growth of 82.3% in 2019 but its average growth excluding 2019 is 20.7% which still makes it the fastest growing segment. The company continued to focus on its AutoCAD products with product enhancements. For example, it recently released a set of new features for its 2023 software version.
On the other hand, its other segments’ growth including Manufacturing (8.4%) consistently had below-average growth in the past 5 years. In contrast, its Media and Entertainment segment’s growth accelerated in 2022 and continued to grow by 24% in Q1 2023 but only accounted for 6% of total revenue while its other revenue growth had been volatile with an average of 9.1%.
Thus, we expect its revenue growth to be driven by both its AutoCAD and AEC segments as these segments had been its fastest growing segments at 30.9% and 17.8% respectively, and were the only segments with above company average growth (17.2%) as well as taking into consideration the company’s focus on improving its AutoCAD and AEC products with new features and extended partnerships with large enterprise customers.
Revenue Growth Supported By Expansion In The Asia Pacific
|
Autodesk Revenue By Geographic Region ($ mln) |
2017 |
2018 |
2019 |
2020 |
2021 |
2022 |
Q1 2023 |
Average |
|
U.S. |
742 |
740 |
875 |
1109 |
1282 |
1457 |
398 |
|
|
Growth % |
-0.2% |
18.1% |
26.8% |
15.6% |
13.6% |
23% |
16.2% |
|
|
Other Americas |
130 |
131 |
175 |
227 |
261 |
309 |
86 |
|
|
Growth % |
0.7% |
34.1% |
29.4% |
14.9% |
18.4% |
28% |
20.9% |
|
|
Total Americas |
872 |
871 |
1050 |
1336 |
1542 |
1765 |
484 |
|
|
Growth % |
-0.1% |
20.5% |
27.2% |
15.5% |
14.4% |
24% |
16.9% |
|
|
Europe, Middle East and Africa |
800 |
815 |
1034 |
1304 |
1473 |
1700 |
449 |
|
|
Growth % |
1.9% |
26.8% |
26.0% |
13.0% |
15.5% |
17% |
16.7% |
|
|
Asia Pacific |
359 |
370 |
486 |
635 |
775 |
921 |
237 |
|
|
Growth % |
3.2% |
31.2% |
30.8% |
22.1% |
18.8% |
10% |
19.3% |
|
|
Total net revenue |
2031 |
2057 |
2570 |
3274 |
3790 |
4386 |
1,170 |
|
|
Growth % |
1.3% |
25.0% |
27.4% |
15.8% |
15.7% |
18% |
17.2% |
Source: Autodesk, Khaveen Investments
Based on the table above, its revenue geography is split across the Americas (the US and other Americas), EMEA and the Asia Pacific. The Americas accounted for its largest revenue in 2022 (40.2%) followed by EMEA (38.8%) and lastly Asia Pacific as its smallest (21%). That said, its average revenue growth from the total Americas (16.9%) had been slightly below its total company average (17.2%) as its US segment average growth was lower at only 16.2%. Notwithstanding, its total Americas growth had accelerated in Q1 2023 at 24% YoY as both US and other Americas growth increased. On the other hand, its EMEA and the Asia Pacific had a 5-year average growth of 16.7% and 19.3% respectively. For the Asia Pacific segment, its growth had been above its total average in the past 5 years but slowed down in Q1 2023. However, we believe this slowdown is attributable to the increased Covid-19 lockdowns in China this year and is likely to recover beyond 2022.
Based on its Investor Day 2021 presentation, the company highlighted the increase of the penetration rate of Building Information Modeling (BIM) tools by 15% in Japan from FY2020 to FY2022 compared to the US where it increased by 9% to 36%, which indicates the growing demand for its software products in the region. Moreover, the company also recently in May announced its Autodesk Construction Cloud launch in APAC, highlighted by management in its latest earnings briefing.
Autodesk Construction Cloud reported its best-ever new business growth quarter, with an increasing proportion of that growth coming from EMEA and APAC and growing contract size and renewal rates. – Andrew Anagnost, Chief Executive Officer
Thus, we expect the company’s revenue growth to be driven by its exposure to the Asia Pacific, despite the slowdown in Q1 2023, with its superior average revenue growth to its total Americas and EMEA segments and increase in penetration rates for BIM tools as well as the company continues to expand into the region such as its launch of its Construction Cloud.
Shift Towards Higher Growth Direct Sales Channel
|
Autodesk Revenue By Sales Channel ($ mln) |
2017 |
2018 |
2019 |
2020 |
2021 |
2022 |
Q1 2023 |
Average |
|
Indirect |
1,462 |
1,440 |
1,831 |
2,282 |
2,600 |
2,849 |
769 |
|
|
Growth |
-1.6% |
27.2% |
24.7% |
13.9% |
9.6% |
16% |
15.0% |
|
|
Direct |
569 |
617 |
739 |
992 |
1,190 |
1,537 |
401 |
|
|
Growth |
8.5% |
19.8% |
34.2% |
20.0% |
29.1% |
22% |
22.3% |
|
|
Total net revenue |
2,031 |
2,057 |
2,570 |
3,274 |
3,790 |
4,386 |
1,170 |
|
|
Growth |
1.3% |
25.0% |
27.4% |
15.8% |
15.7% |
18% |
17.2% |
Source: Autodesk, Khaveen Investments
Based on its revenue breakdown by sales channel, its indirect sales channel is larger than its direct sales channel accounting for 65% of revenue in 2022. According to its annual report, its indirect channel depends on resellers and distributors of its software products. On the other hand, its direct sales channel relies on enterprise business arrangements (EBAs) and its own branded online store based on its annual report.
However, its direct sales channel had outpaced its indirect sales channel growth at 22.3% compared to 15% based on its 5-year average as the company expanded its EBA and e-commerce footprint. In Q1 2023, the company’s direct sales channel growth of 22% was in line with its 5-year average whereas its indirect growth increased to 16% but was still below its total company growth of 18%. Based on its annual report, the company expects to continue to shift towards its direct channel in the following quote.
We anticipate that our channel mix will continue to change, particularly as we scale our online Autodesk branded store business and our largest accounts shift towards direct-only business models – Autodesk Annual Report
Moreover, from its company’s earnings briefing, it highlighted its second-largest EBA ever which included its Innovyze and Autodesk Build products. Therefore, we expect its direct channel revenue to continue driving its growth as it focuses on expanding its direct channel.
Risk: Growth Headwinds
Based on its latest earnings presentation, the company guided its FY2023 revenues to grow between 13% to 15% for FY2023, which is lower compared to its 5-year average of 17%. According to management in its earnings briefing, it expected its caution on geopolitical, macroeconomic, and policy environments and provided an impact of $40 mln (3% of revenue) in Q1 2023 from its decision to halt business in Russia.
Valuation
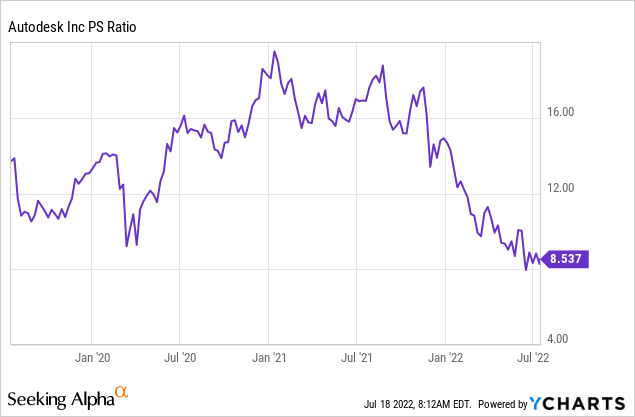
For the valuation of the company, we used its historical P/S ratio with a 3-year average of 13.56x (data from Macrotrends) on analyst revenue consensus in FY2025 to obtain a price target of $406.33. Based on this, we derived our FY2023 price target by prorating our 2025 upside back to 2023 to obtain a price target of $232.80 with an upside of 32.1%. We expect its P/S ratio to linearly increase from 8.36x (current P/S) to its 3-year average of 13.56x.
|
P/S |
Average |
|
1-year |
11.78x |
|
2-year |
14.00x |
|
3-year |
13.56x |
Source: Macrotrends, Khaveen Investments
|
Valuation |
2023F |
2024F |
2025F |
|
Revenue (Analyst Consensus) ($ mln) |
5,015 |
5,720 |
6,509 |
|
Growth % |
14.33% |
14.05% |
13.81% |
|
P/S Ratio |
10.09x |
11.68x |
13.56x |
|
Valuation ($ mln) |
50,581 |
66,824 |
88,284 |
|
Shares Outstanding (‘mln’) |
217.3 |
217.3 |
217.3 |
|
Price Target |
$ 232.80 |
$ 307.56 |
$ 406.33 |
|
Current Price |
$ 176.21 |
$ 176.21 |
$ 176.21 |
|
Upside |
32.1% |
74.5% |
130.6% |
Source: Khaveen Investments
Verdict
To conclude, we analyzed the company’s revenue growth had been driven by 3 factors which had the highest growth rate based on its revenue breakdown by product family, geographic region and sales channel, namely:
- AutoCAD and AEC product family growth
- Strong Asia Pacific geographic region growth/other Americas
- Shift towards its Direct Sales Channel
|
Growth Factor |
Average Revenue Growth % |
Revenue ($ mln) |
|
AEC Segment (Product Family) |
17.8% |
1,960 |
|
AutoCAD Segment (Product Family) |
20.7%* |
1,253 |
|
Expansion in Asia Pacific Segment (Geographic) |
19.3% |
921 |
|
Direct Sales Channel (Sales Channel) |
22.3% |
1,537 |
*Excluding 2019
Source: Autodesk, Khaveen Investments
Going forward, we expect its revenue growth to remain driven by these factors due to its product enhancements with new features and extended partnerships with customers, commitment to expanding in the Asia Pacific with its Autodesk Construction Cloud launch as well as its continued focus on the transition toward its direct sales channels through its online stores and EBAs. Out of these factors, we expect its most important growth driver to be its transition towards its direct channel as it had the highest revenue growth average of 22.3% out of all 3 factors and its direct sales only accounted for 34% of the total sales in Q1 2023. Overall, we valued the company based on its historical P/S ratio and obtain an upside of 32.1% for the company with a target price of $232.80 in FY2023. In comparison, our valuation is in line with analyst consensus which has an average target price of $247.88 which is an upside of 37.8% as the company’s stock price had declined by 39.8% YTD.
Be the first to comment