

Australian Dollar Talking Points
AUD/USD continues to trade within the opening range for January as the US Dollar Index (DXY)remains within the confines of a broader bearish formation, but Australia’s Employment report may trigger a bullish reaction in the Australian Dollar as the updated figures are expected to show a further improvement in the labor market.
AUD/USD Monthly Opening Range Intact Ahead of Australia Jobs Report
AUD/USD appears to be stuck in a defined range after taking out the April 2018 high (0.7813), but the correction from the monthly high (0.7820) may turn out to be an exhaustion in the bullish price action rather than a change in trend like the behavior seen in the second half of 2020.
As a result, Australia’s Employment report may fuel the recent series of higher highs and lows in AUD/USD as the economy is projected to add 50.0K jobs in December, and a positive development may keep the Reserve Bank of Australia (RBA) on the sidelines at its first meeting for 2021 as the “Board does not expect to increase the cash rate for at least 3 years.”
It seems as though the RBA will rely on its current tools to support the Australian economy after announcing plans to purchase “$100 billion of government bonds of maturities of around 5 to 10 years over the next six months” in November, and it remains to be seen if Governor Philip Lowe and Co. will extend the quantitative easing (QE) program beyond the current deadline as “members agreed to keep the size of the bond purchase program under review.”
In turn, key market themes may continue to sway AUD/USD as the RBA acknowledges that “the improvement in risk sentiment has also been associated with a depreciation of the US dollar and an appreciation of the Australian dollar,” and the tilt in retail sentiment also may also persist as traders have been net-short the pair since November.
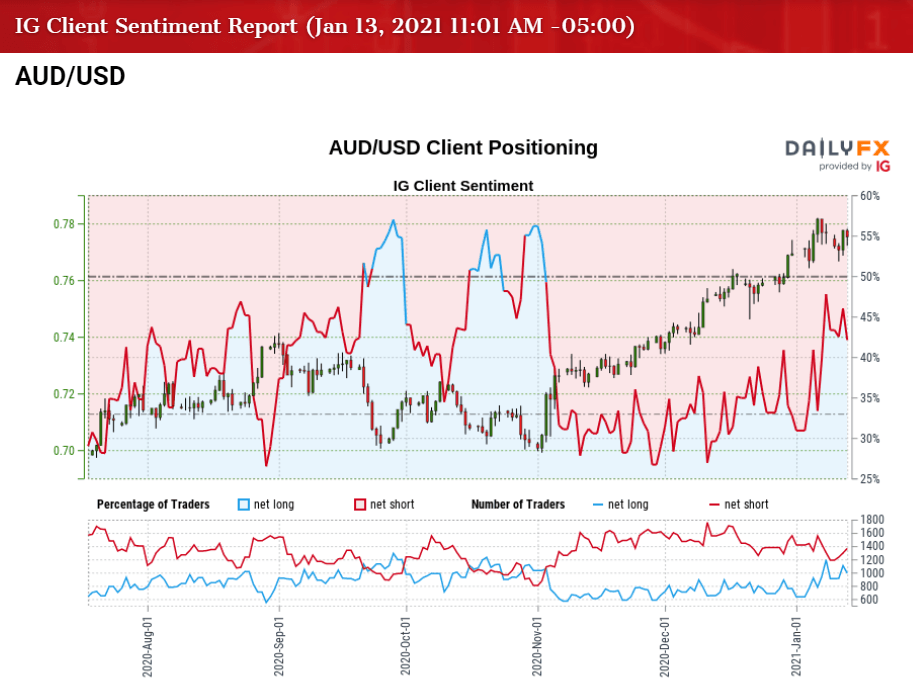
The IG Client Sentiment report shows 48.61% of traders are net-long AUD/USD, with the ratio of traders short to long standing at 1.06 to 1. The number of traders net-long is 0.08% lower than yesterday and 17.32% higher from last week, while the number of traders net-short is 7.09% higher than yesterday and 2.43% higher from last week.
The jump in net-long interest has helped to alleviate the crowding behavior in AUD/USD as 45.23% of traders were net-long during the previous week, but the tilt in retail sentiment looks poised to persist amid the rise in net-short interest.
With that said, key market trends may keep AUD/USD afloat as it continues to track the opening range for January, but the Relative Strength Index (RSI) continues to deviate with price as the indicator no longer tracks the upward trend established in November.

Recommended by David Song
Learn More About the IG Client Sentiment Report
AUD/USD Rate Daily Chart

Source: Trading View
- Keep in mind, the AUD/USD correction from the September high (0.7414) proved to be an exhaustion in the bullish trend rather than a change in behavior as the exchange rate cleared the October high (0.7243) in November, with the pair trading to fresh yearly highs throughout December.
- At the same time, developments in the Relative Strength Index (RSI)showed the bullish momentum gathering pace as the indicator pushed into overbought territory for the first time since September, with the break above 70 accompanied by a further appreciation in AUD/USD like the behavior seen in the first half of 2020.
- However, a textbook RSI sell signal emerged following the failed attempt to test the March 2018 high (0.7916), with the oscillator still diverging with price as the indicator establishes a downward trend in January.
- Nevertheless, AUD/USD appears to be stuck in a defined range following the string of failed attempts to test the monthly low (0.7642), with the exchange rate climbing back above the Fibonacci overlap around 0.7720 (78.6% expansion) to 0.7740 (61.8% expansion) as it initiates a series of higher highs and lows.
- Need a close above the Fibonacci overlap around 0.7720 (78.6% expansion) to 0.7740 (61.8% expansion) to bring the monthly high (0.7820) on the radar, with the next area of interest coming in around 0.7890 (100% expansion) followed by the March 2018 high (0.7916).

Recommended by David Song
Traits of Successful Traders
— Written by David Song, Currency Strategist
Follow me on Twitter at @DavidJSong
Be the first to comment