

AUD/USD started a fresh increase from the 0.7085 zone. NZD/USD is also rising and there was a clear move above the 0.6680 resistance.
Important Takeaways for AUD/USD and NZD/USD
· The Aussie Dollar started a fresh increase after it cleared 0.7100 against the US Dollar.
· There is a key bullish trend line forming with support near 0.7180 on the hourly chart of AUD/USD.
· NZD/USD also climbed higher after forming a base above the 0.6600 level.
· There is a major bullish trend line forming with support near 0.6695 on the hourly chart of NZD/USD.
AUD/USD Technical Analysis
The Aussie Dollar found support near the 0.7080 zone against the US Dollar. The AUD/USD pair traded as low as 0.7086 on FXOpen before it started a fresh increase.
There was a clear move above the 0.7100 and 0.7120 resistance levels. The pair surged above the 0.7180 level and the 50 hourly simple moving average. During the increase, there was a clear move above the 50% Fib retracement level of the downward move from the 0.7248 swing high to 0.7086 low.
Besides, there is a key bullish trend line forming with support near 0.7180 on the hourly chart of AUD/USD. The pair is now facing resistance near the 0.7210 level.
The 76.4% Fib retracement level of the downward move from the 0.7248 swing high to 0.7086 low is also near the 0.7210 level. The next major resistance is near the 0.7250 level. A close above the 0.7250 level could start a steady increase in the near term.
The next major resistance could be 0.7300. On the downside, an initial support is near the 0.7180 level and the 50 hourly simple moving average.
The next support is near the 0.7165. If there is a downside break below the 0.7165 support, the pair could extend its decline towards the 0.7120 level. Any more downsides might send the pair toward the 0.7080 level.
NZD/USD Technical Analysis
The New Zealand Dollar also followed a similar path from the 0.6590 zone against the US Dollar. The NZD/USD pair gained pace above the 0.6620 resistance zone to move into a positive zone.
The pair even traded above the 0.6680 level and the 50 hourly simple moving average. There was a clear move above the 50% Fib retracement level of the key decline from the 0.6732 swing high to 0.6592 low.
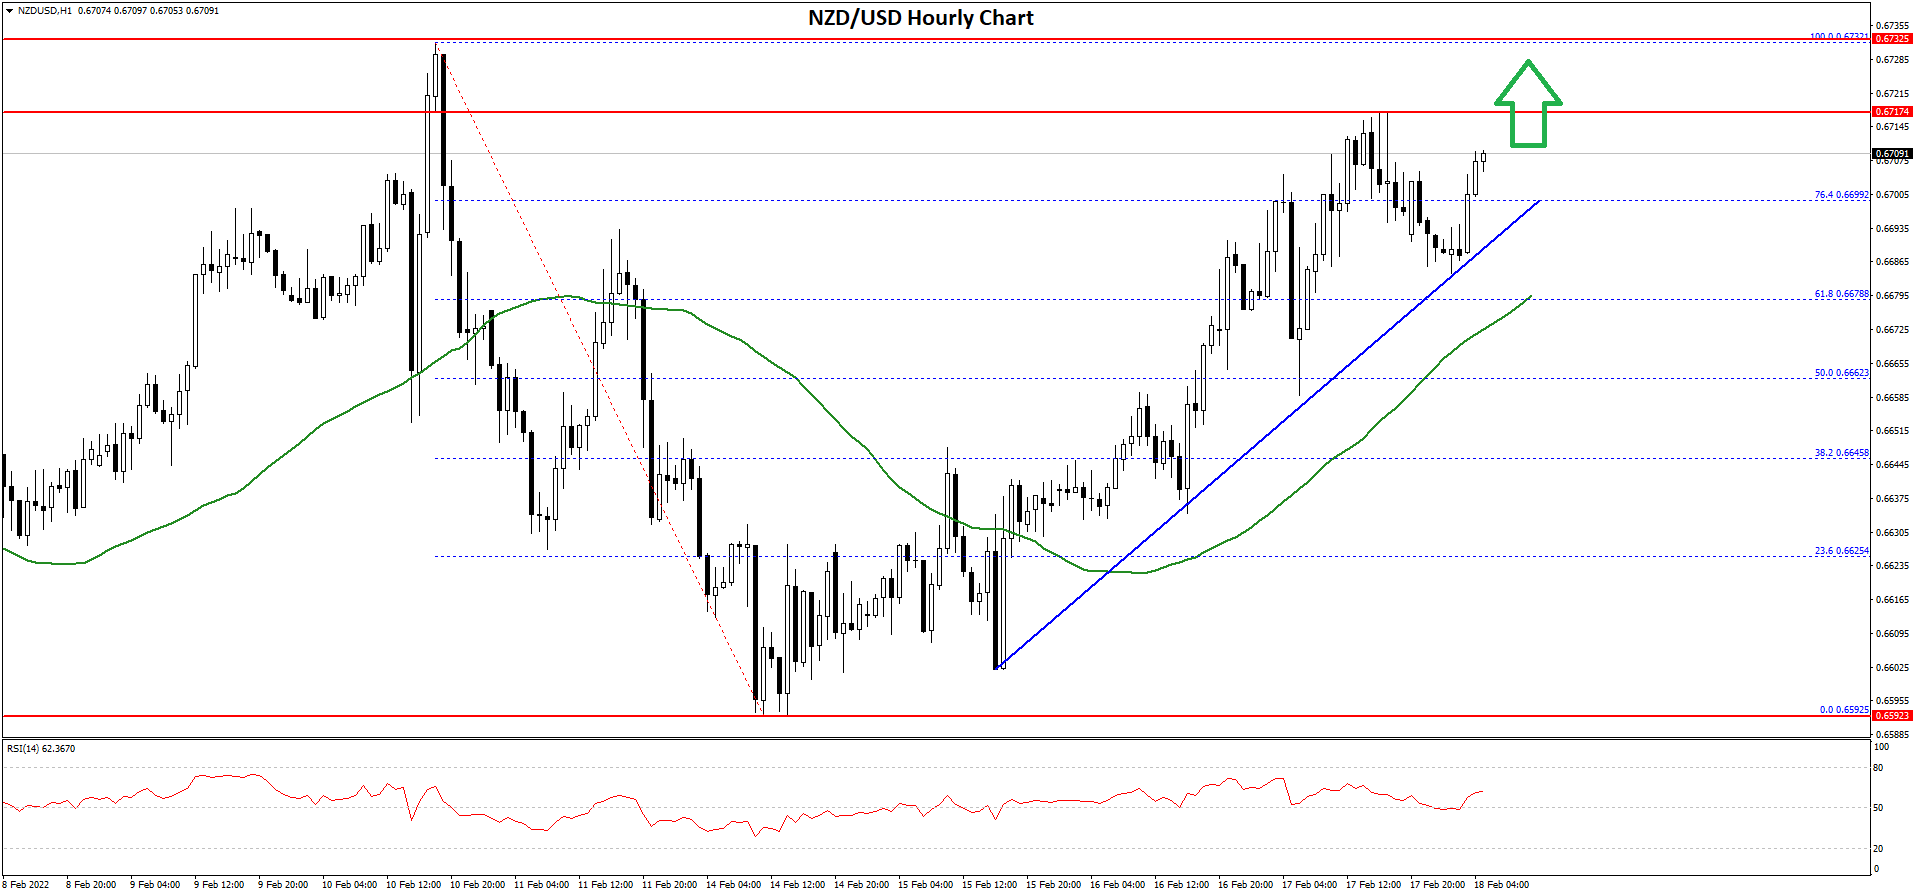
It is now trading above the 0.6700 level and the 76.4% Fib retracement level of the key decline from the 0.6732 swing high to 0.6592 low. An immediate resistance is near the 0.6715 level. The first key resistance is near the 0.6730 level.
The next major resistance is near the 0.6750 level. A clear move above the 0.6750 level might even push the pair towards the 0.6800 level.
On the downside, an initial support is near the 0.6700 level. There is a major bullish trend line forming with support near 0.6695 on the hourly chart of NZD/USD. The first key support is near the 0.6680 level and the 50 hourly SMA, below which the pair could extend losses. The next major support is near the 0.6635 level.
This forecast represents FXOpen Markets Limited opinion only, it should not be construed as an offer, invitation or recommendation in respect to FXOpen Markets Limited products and services or as financial advice.

Be the first to comment