

jetcityimage
I have been wrong about AT&T (NYSE:T) for years, as the stock continues to decline into uncharted territory. I wish I could say it’s a toss-up for the most hated large cap between International Business Machines (IBM) and T, but it’s not even close. T’s stock makes IBM look attractive, and if I took a poll as to the most hated large cap, there is a good chance T would take the top spot. The bears and bulls have argued the points from T’s massive debt load, failed acquisitions, and poor allocations of capital to their massive Free cash Flow [FCF], ability to service debt, and core portfolio strength, but in the end, the ticker tape is the ultimate judge. Over the past year, shares of T have declined -30.38% from their $21.53 highs; over the previous 5-years T has declined -44.37%, and over the past decade, shares have fallen -43.79%. While T has always supported a large dividend, negative growth over the past decade is hard to swallow. Going back to November of 1992, which is a span of 3 decades, shares of T have appreciated by 24.4%. In my opinion, T has become the undisputed champion when it comes to being the most hated large-cap as its fell -44.37% compared to -14.57% for IBM over the past 5-years. I believe the decline is unjustified, but in the end, it may not matter, and T could remain dead money due to the inability to change the market’s perception of the company.
Seeking Alpha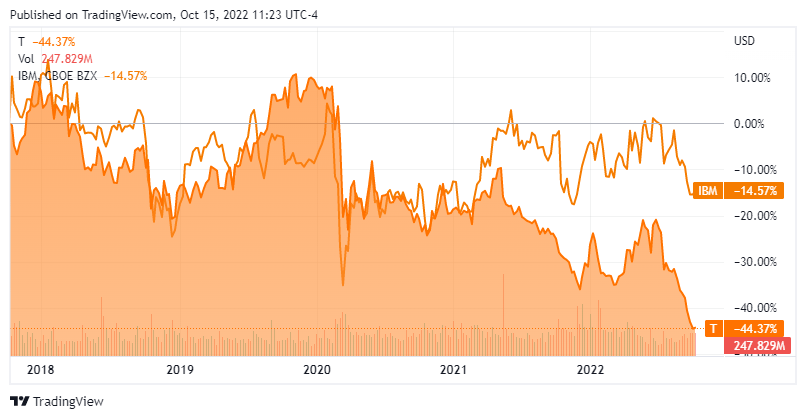
I believe AT&T’s current valuation is unjustified compared to its peers
There is no debate as to the market’s sentiment regarding T. The questions that I present are could how the market and the investment community view T be incorrect, and is there a chance that shares of T are a salvageable investment? Many investors, including myself, have experienced nothing but capital destruction investing in T, but I remain optimistic based on the numbers. In many cases, the market isn’t rational, as companies appreciate to unthinkable levels while others decline to levels investors would have never anticipated. Putting market and investor sentiment aside, the numbers are the numbers, as $1 of revenue and $1 of Free Cash flow [FCF] equals $1 of revenue and $1 of FCF regardless of the company’s name or sector it does business in. It doesn’t matter if the company focuses on building farming equipment or is the latest SaaS company, if they both go from generating $1 billion of FCF to $2 billion of FCF in a year, they are both generating $2 billion of FCF and have an FCF growth rate of 100% YoY. Due to market perception and many other factors, these two companies will be valued differently even though they produce the same amount of FCF with the same growth rate. T has been the quintessential stock to stay fearful when others are fearful instead of utilizing Warren Buffett’s mentality of being greedy when others are fearful, but maybe the market has been too harsh on shares of T, and it could be time to get greedy.
T only has 2 main competitors, Verizon (VZ) and T-Mobile (TMUS). While some could classify Lumen Technologies (LUMN) in that group, I am not because wirelines aren’t T’s main business. In T’s Q2 2022 report, they provided a financial outlook update which indicated that its FCF would come in lower than expected in the $14 billion range compared to $16 billion for 2022. I will be using the $14 billion number as T’s FCF since standalone T hasn’t been operating over the previous 12 months, so I am unable to create a TTM figure. I want to look at how the market is valuing T, compared to VZ and TMUS.
AT&T Steven Fiorillo, Seeking Alpha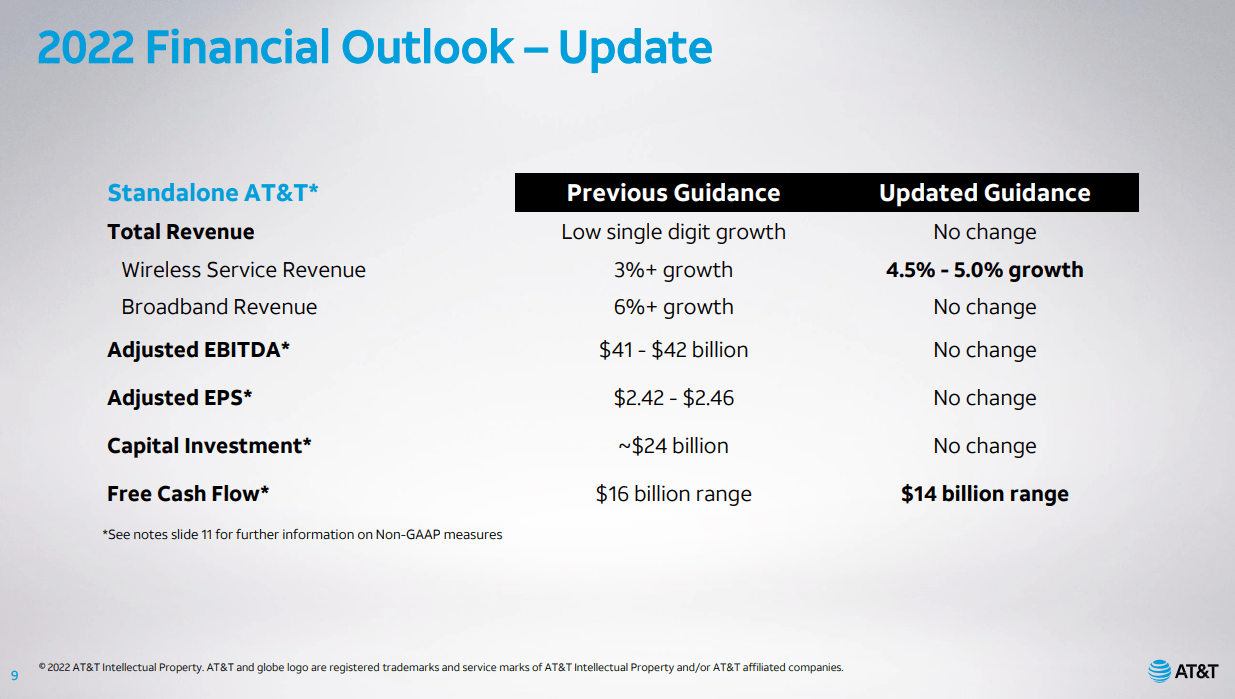

Based on the valuation Mr. Market has placed on TMUS, both VZ and T look drastically undervalued. Currently VZ has a market cap of $152.87 billion, which is -9.17% smaller than TMUS as its market cap is $166.89 billion. VZ generates more than double the cash from operations that TMUS produces and 762.46% more FCF ($13 billion) than TMUS. TMUS generates $1.71 billion of FCF and trades at a 97.88x price to FCF multiple. TMUS has a forward EPS number of $2.03, placing its P/E ratio at 64.79. VZ generates $14.7 billion in FCF and trades at a 10.40x price to FCF multiple while having a $5.17 forward EPS number placing its P/E ratio at 7.04. There is no reason for TMUS to have a larger valuation than VZ. Hypothetically, if TMUS grew its FCF by 100% in 2023 then another 100% in 2024, it would generate $6.82 billion in FCF. If the share prices for VZ and TMUS stayed the same through 2024, and TMUS grew its FCF YoY by 100%, and VZ’s growth was flat, VZ would still trade at a price to FCF multiple of 10.40x while TMUS would trade at a 24.47x multiple. Yes, TMUS would have experienced 100% YoY growth for 2 consecutive years, but it would still generate less than half of the FCF that VZ produced, and over a 3 year period, VZ would have produced $44.12 billion in FCF compared to $11.94 billion for TMUS. As of today, there isn’t a good reason why TMUS has a larger market cap than VZ.
I wanted to look at VZ compared to TMUS first so I could establish a point of reference and an additional example. Looking at T compared to TMUS is a more egregious injustice, in my opinion. T has a market cap of $107.74 billion, which is $59.15 billion, smaller than TMUS’s at $166.89 billion. TMUS has a market cap that is 54.9% larger than T’s, yet just like with VZ, it generates significantly less FCF. T is projected to generate $14 billion of FCF for the 2022 fiscal year. Based on $14 billion of FCF, its current price-to-FCF multiple is 7.7x. TMUS trades at a 97.88x price to FCF valuation. T has a forward projected EPS is $2.55, which places its P/E at 5.88 compared to 64.79 for TMUS.
It’s the same logic as the VZ example as it’s simply based on math. If a large investment firm wanted to own a communication company, which would be the better buy today, T or TMUS? There is no reason to buy a company for $166.89 billion that generates $1.71 billion of FCF at a 97.88 price to FCF multiple when you can buy a competitor for $107.74 billion that is generating $14 billion of FCF at a 7.7x price to FCF multiple.
With every investment an investor makes, they are paying the present value for a company’s current and future cash flow. Some would speculate that T and VZ should trade around the same price to FCF multiple since they produce similar amounts of FCF, and T could generate more than $14 billion as they said $14 billion range for 2022. If T traded at the same price to FCF multiple as VZ, it would have a $145.54 billion market cap which is a 35.09% increase from its current level, and if it traded at a 9.5x FCF multiple, placing a small premium on VZ, it would trade at a $133 billion price to FCF multiple which is a 23.45% increase from today’s level.
Maybe Communications isn’t an exciting sector, as it’s more of a utility today, but the FCF it produces puts them right up there with the largest companies of today. I wanted to expand how I compare VZ, T, and TMUS, and I will look at them against the following companies:
- Apple (AAPL)
- Microsoft (MSFT)
- Alphabet (GOOGL)
- Amazon (AMZN)
- Meta Platforms (META)
- Tesla (TSLA)
- Kimberly-Clark (KMB)
- Procter & Gamble (PG)
- The Coca-Cola Company (KO)
- PepsiCo (PEP)
|
Price to Free Cash Flow |
|||
|
Ticker |
Market Cap |
Total Free Cash Flow |
Price to Free Cash Flow Multiple |
|
AMZN |
$1,089,049,110,544.00 |
-$29,784,000,000.00 |
-36.56 |
|
T |
$107,740,000,000.00 |
$14,000,000,000.00 |
7.70 |
|
META |
$340,673,590,221.00 |
$35,830,000,000.00 |
9.51 |
|
VZ |
$152,870,000,000.00 |
$14,705,000,000.00 |
10.40 |
|
AAPL |
$2,223,870,463,470.00 |
$107,582,000,000.00 |
20.67 |
|
GOOGL |
$1,264,041,822,440.00 |
$60,697,000,000.00 |
20.83 |
|
KMB |
$38,222,208,952.00 |
$1,810,000,000.00 |
21.12 |
|
PG |
$298,378,219,287.00 |
$13,567,000,000.00 |
21.99 |
|
KO |
$237,768,045,460.00 |
$10,242,000,000.00 |
23.22 |
|
MSFT |
$1,704,575,548,752.00 |
$65,149,000,000.00 |
26.16 |
|
PEP |
$234,876,669,519.00 |
$6,338,000,000.00 |
37.06 |
|
TSLA |
$642,330,032,512.00 |
$6,937,000,000.00 |
92.59 |
|
TMUS |
$166,890,000,000.00 |
$1,705,000,000.00 |
97.88 |
Now the questions I propose are should TMUS have a larger price to FCF multiple than TSLA, and should T trade at such a large discount to companies such as PG, and KO? While there are other factors that come into play, it’s hard to justify how KMB can trade at a 21.12x price to FCF multiple, PG at 21.99x, and KO at 23.22x, and then Mr. Market turns around and places a 7.7x multiple on shares of T. I think shares of T have been on the outs long enough, and at some point, Mr. Market and the investment community need to start looking at T as an investment, not as a broken company. T has become a diamond in the rough, and at some point, the numbers should change the perception.
Steven Fiorillo, Seeking Alpha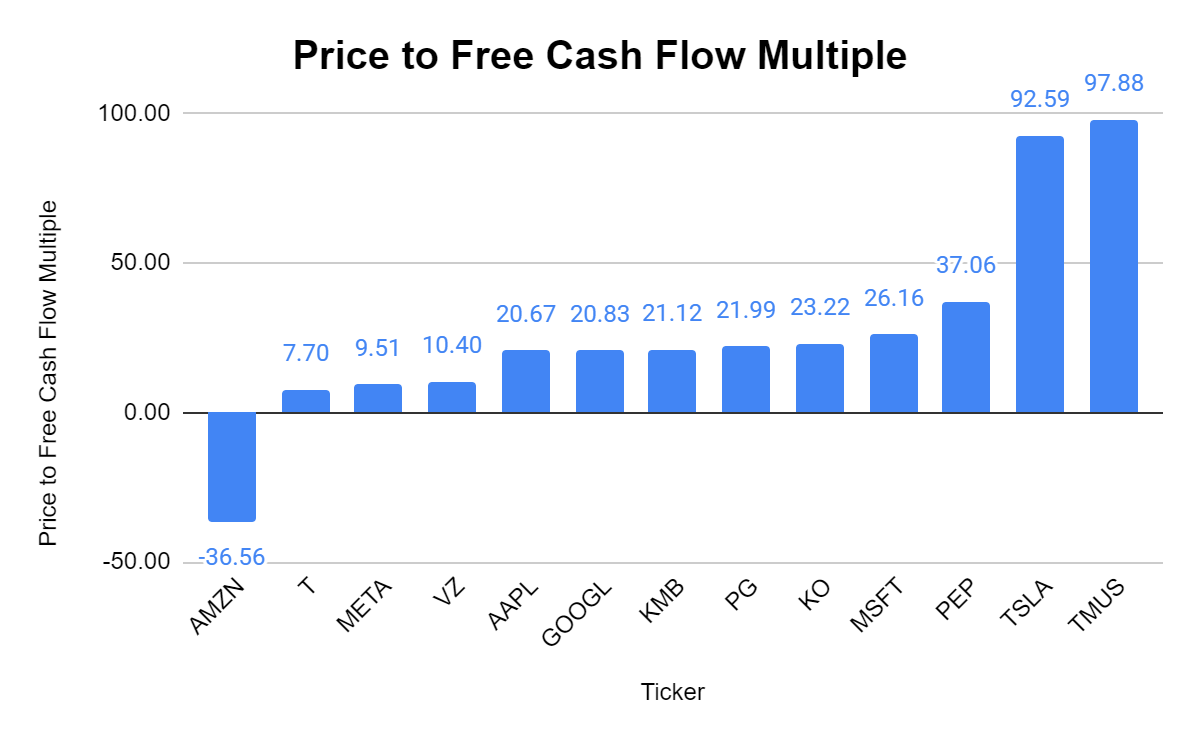
Changing the perception of AT&T
The main point of contention is T’s debt load. Sure, there are failed acquisitions and poor capital allocation choices, but those are in the past. Investors aren’t paying for the company T used to be, they are paying for the company T currently is. As debt is the major sticking point, what will occur when debt is no longer the issue that it currently is? I believe that debt is only an issue if there is a problem servicing the debt, and T doesn’t have a problem in this area.
AT&T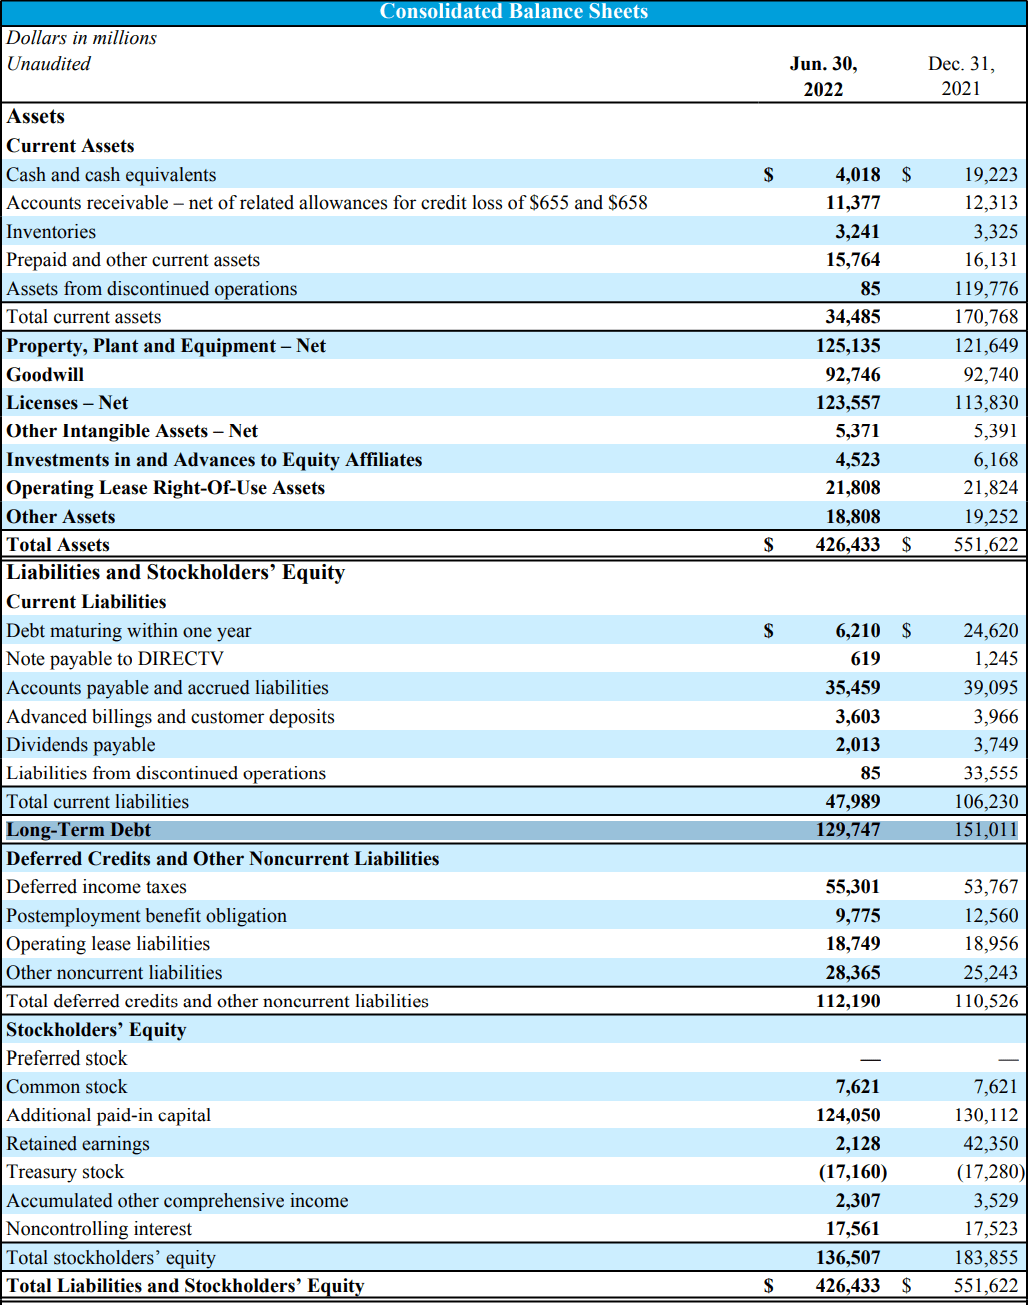
There are two line items to look at, debt maturing within one year under current liabilities and long-term debt. Between these two line items, T had $175.63 billion in debt starting out in 2022. T eliminated $18.41 billion of debt maturing in one year (74.78%) and $21.26 billion (14.08%) of its long-term debt in the 1st half of 2022. T’s debt load has decreased by $39.67 billion (22.59%), going from $175.63 billion to $135.96 billion. T has 7.13 billion shares outstanding, so they are allocating $7.9 billion of FCF toward its dividend ($1.11 * 7.13 billion). In 2022 they will be left with $6.1 billion in FCF after the dividends are paid. Originally, T had projected $16 billion of FCF in 2022 and $20 billion in 2023. The $2 billion impact has been indicated as a 1-time occurrence. If T does generate $20 billion of FCF in 2023 and doesn’t provide investors with a dividend increase, they will be left with $12 billion of FCF. T is generating more than enough FCF to continue repaying billions annually on its debt load. If T was to allocate $5 billion annually toward debt service, they would repay every dollar in 21.19 years. I don’t know when the investment community will look past the debt load, but at some point, T’s debt should become a nonissue.
Conclusion
Shares of T are trading at $14.99 and have a market cap of $107.74 billion. This has pushed T’s dividend yield to 7.4%. There is no question that the market’s perception of T is unfavorable, but I refuse to throw in the towel due to the actual numbers. I have been incorrect for years on T, but I believe my investment premise remains intact as it’s strictly based on math. T trades at a price to FCF multiple of 7.7x, while other companies that could be considered boring and low growth, such as PG and KO, trade at a price to FCF of 21.99x and 23.22x. Comparing T to its peers and others outside its peer group, the valuation looks inexpensive and as if T has become a diamond in the rough. I may be waiting for several years, but eventually, I believe the tide will turn, and I will continue collecting and reinvesting the dividends along the way.
Be the first to comment