

somethingway/E+ via Getty Images
Thesis
The dividend yield from the telecom sector is off the chart by its historical standard. Whenever something so out of whack happens, it gets our attention and we’d like to dig in.
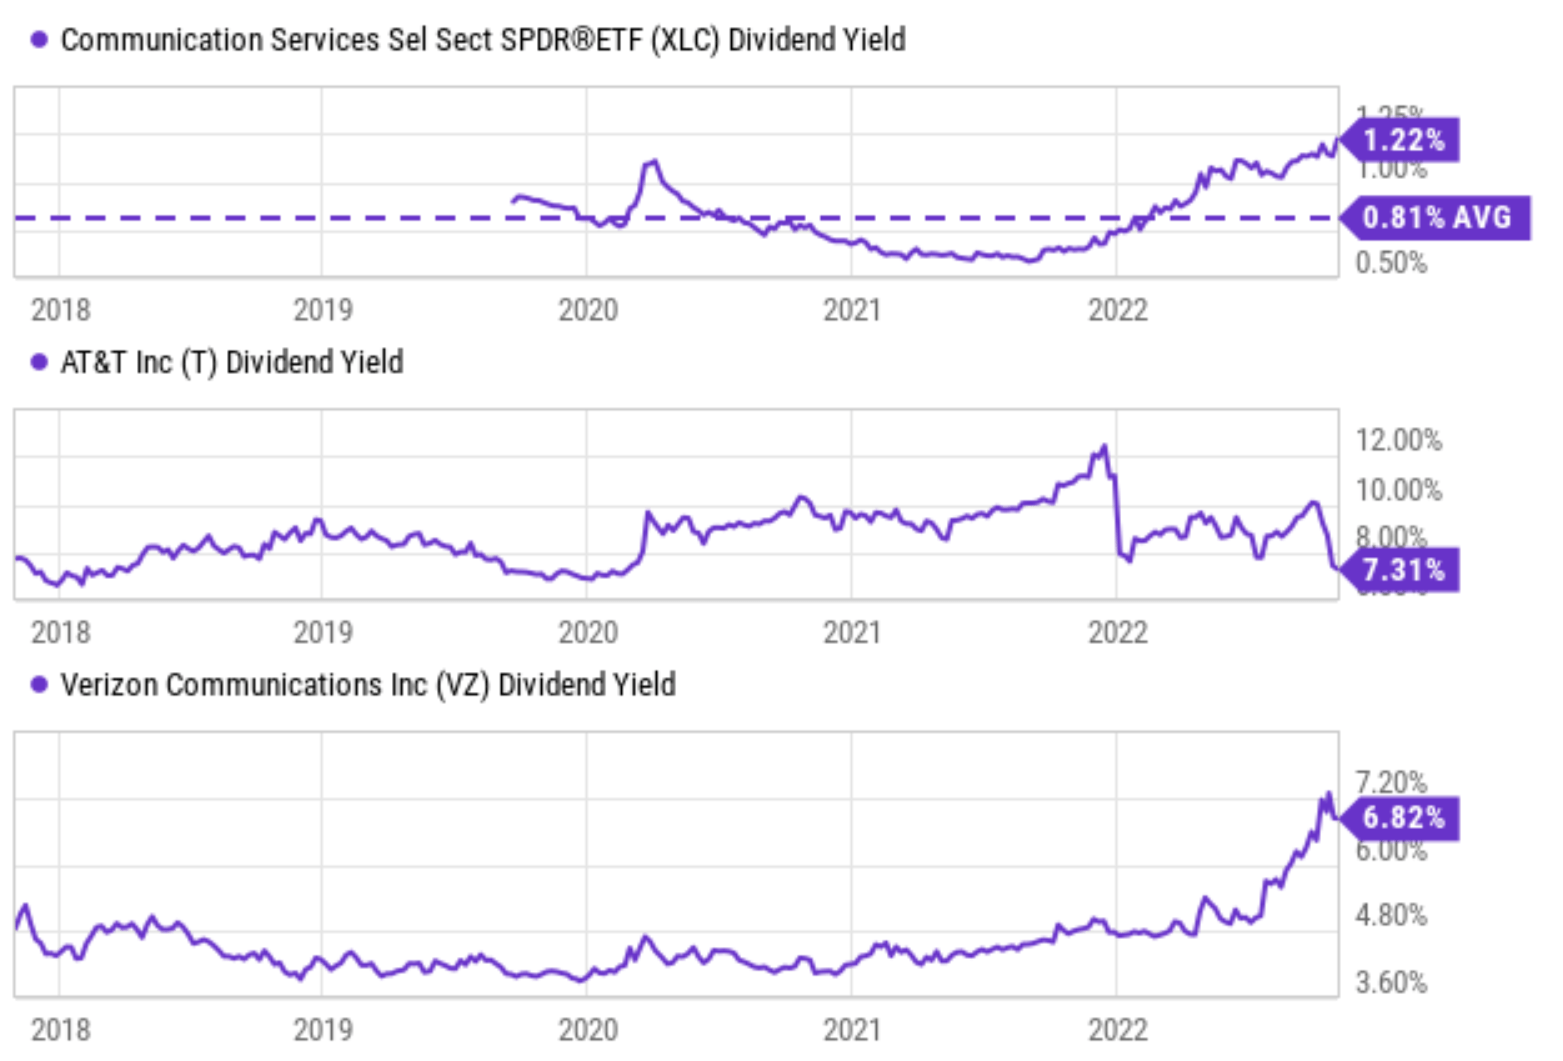
The following chart shows the price returns (with dividend excluded) and total returns (with dividend included) of the telecommunication service sector represented by the Communication Services Select Sector SPDR Fund (XLC). XLC’s price has changed very little over the past 5 years (it actually dropped by about 6.8%). And in terms of total return, investors almost broke even (losing a small -0.44%) thanks to the dividends. As a result of such little price movements, combined with dividend increases, XLC’s yield is now at 1.22% as you can see from the second chart below, not only far above its historical average of 0.81% but also at peak level since its inception.
Looking closer, two observations of the sector funds are worth noting. First, XLC only has a short history so far. And second, its top component stocks (META, NFLX, and GOOG) are not the traditional type of telecom stocks like AT&T (NYSE:T) (and they do not pay dividends). But XLC indeed holds many utility-type and dividend-paying telecom stocks too. Besides T, it also holds Verizon (VZ), Charter Communications (CHTR), and Comcast (CMCSA). So in the following charts, you can see two traditional utility-type telecom stocks, T and VZ, following approximately the same trend as the sector fund. And this leads me to the main thesis today.
Utility-type stocks like T typically let investors eat the cake now and don’t get to keep it. As seen, T has provided generous dividends in the past (on average about 9%) in the past 5 years. Don’t be alarmed by the fact that its current dividend yield of 7.3% is below its historical average. The reason was a dividend adjustment due to its WarnerMedia spinoff. All told, T has unfortunately suffered a price decline of -24.5% in the past 5 years. However, the dividends more than made up all the price declines and T investors received a total return of 8.13% in the past 5 years. The point is not to argue 8.13% return is a good return, but to show the dominating role of dividends in its total return in the past.
And next, you will see why I anticipate the future to be different. The remainder of this article will argue why I see its current dividend (generously at 7.3%) as only a fraction of its total return potential in the next 5 years.
Source: Seeking Alpha data Source: Seeking Alpha data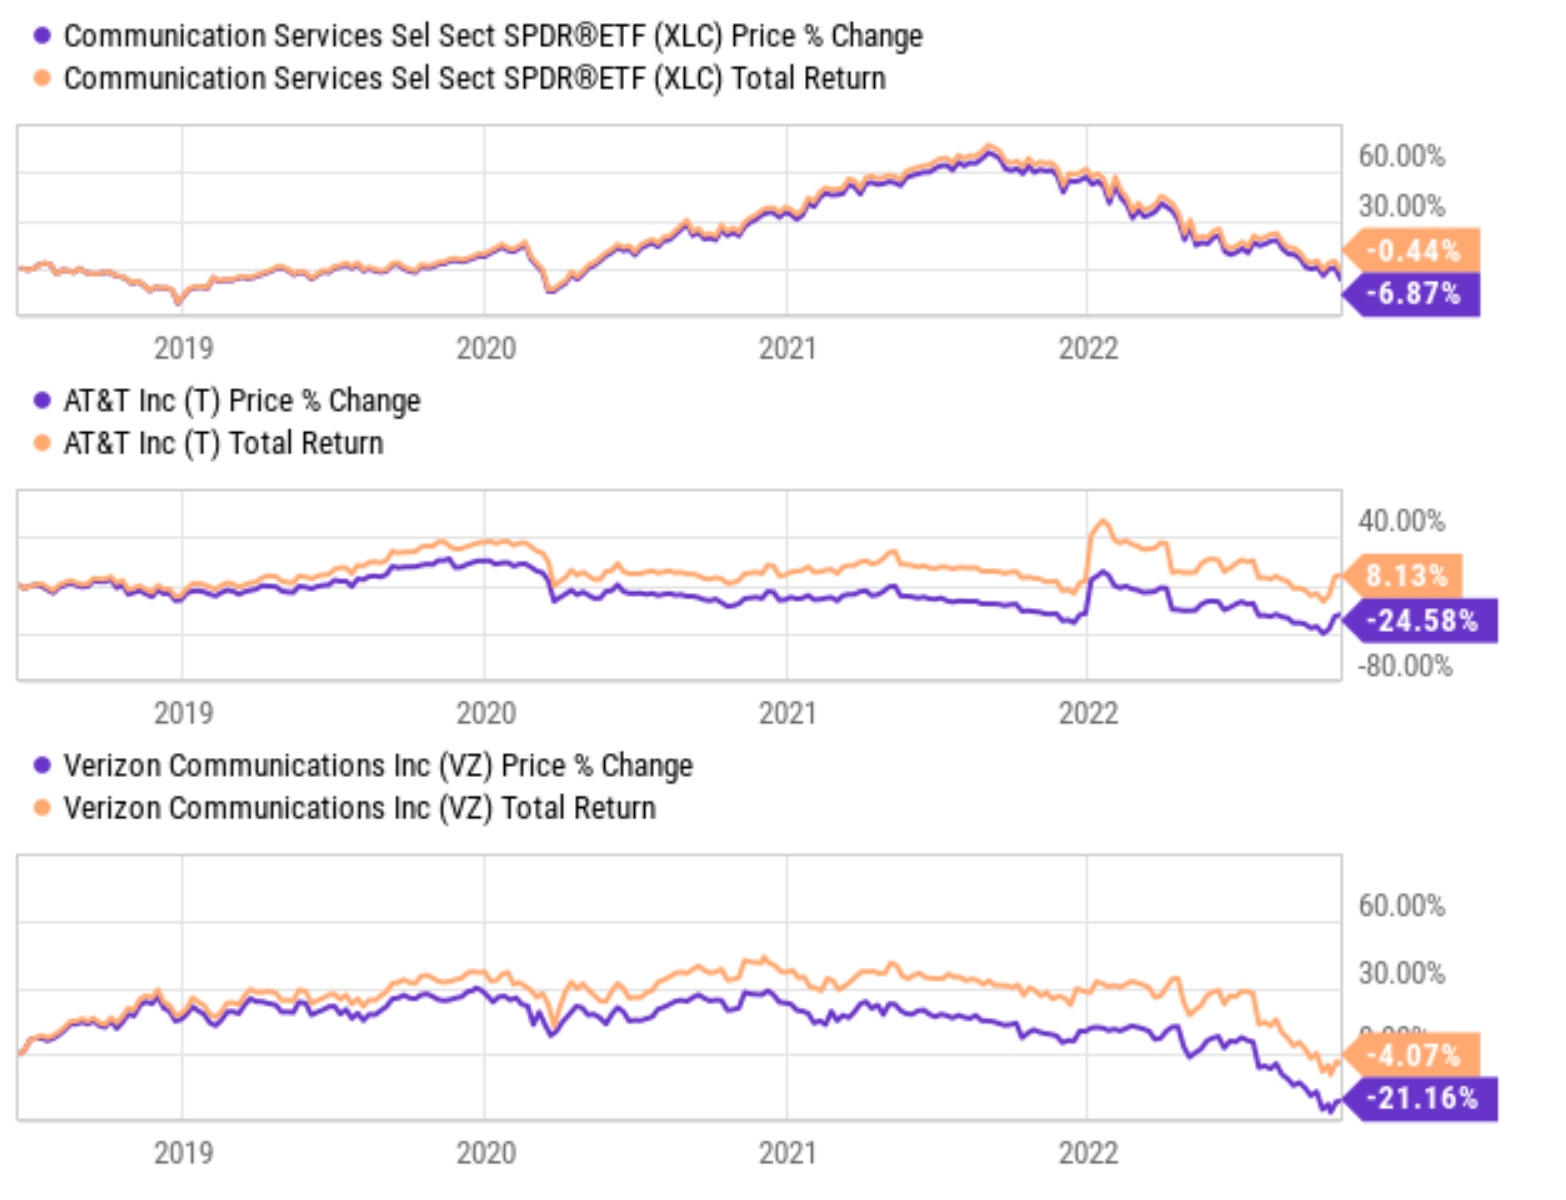
T’s share dilution issue
Before we move on further, let’s take a look at the concept of total shareholder yield first. As detailed in my earlier writings:
For investors who do not need current income yet (like myself), I prefer to look at the total shareholder yield instead of the dividend yields only. Total shareholder yield consists of cash dividend yield and also buyback yield. For readers new to the concept, the buyback yield is the amount spent on repurchases divided by the market cap of a company (just like dividend yield is the total amount of dividends paid divided by the market cap).
As you must be already aware, utility-type telecom companies tend to issue new shares to raise capital. And as a result, they dilute their share base and create a negative buyback yield. As you can see from the chart below, both T and VZ have been following this practice in the past. To wit, T has expanded its share base from 6.8B back in 2018 to the current 7.64B, an dilution rate of 2.3% CAGR. And VZ has expanded its share base from 4.08B back in 2018 to the current 4.20B, translating into a slower dilution rate of 0.73% CAGR. Therefore, their share dilution effectively canceled off a portion of their cash dividends mentioned above (by about 2.3% in T’s case).
With this back, the 1st reason why I think the future would be different is buybacks. After the Warner spinoff, T is in a much better position in terms of its debt burden, cash flow, and capital allocation. So I expect it to slow down its dilute rate going forward (say to VZ’s historical level of below 1%) or even reverse by starting a share repurchase program. In the long run, a repurchase would be extremely accreditive for shareholder returns when made at its currently very compressed valuations.
Source: Author based on Seeking Alpha data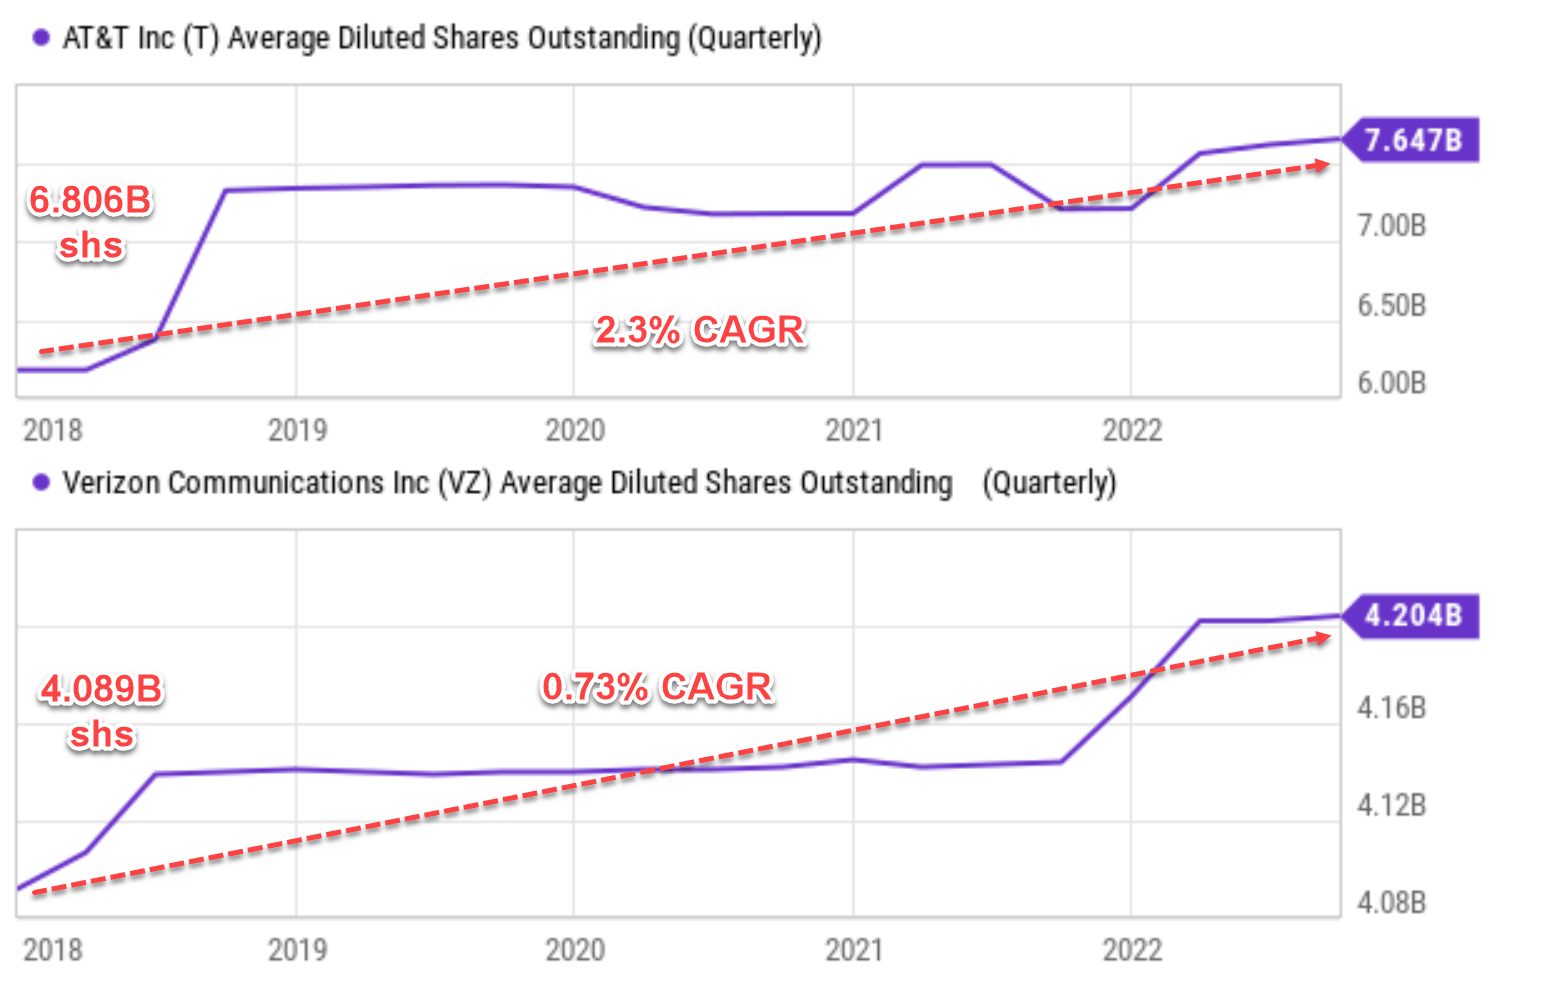
T’s dividends and reinvestment sustainability
Capital return, either in the form of different payments or share repurchases, ultimately depends on the profitability and investment opportunities available to the business.
The next chart shows the profitability of T in terms of ROE (return on equity). As seen, its ROE has been relatively stable within a range of 10% and 20% most of the time. Its long-term average is 10.8. Also, note that its average ROE is biased by several factors toward the lower end. First, the business suffered almost 2 years of miserable ROE due to the COVID pandemic (it even briefly dipped below 0%). And secondly, as detailed in my blog article, ROE does not accurately represent profitability because equity is usually not the capital actually required to run a business. In terms of ROCE (return on capital employed), T’s average ROCE has been on average 30.3% in the long-term, almost 3x higher than its ROE.
But by either metric, its dividend yield is lower than either its average ROE or its average ROCE by a good margin, illustrating good sustainability.
Source: Author based on Seeking Alpha data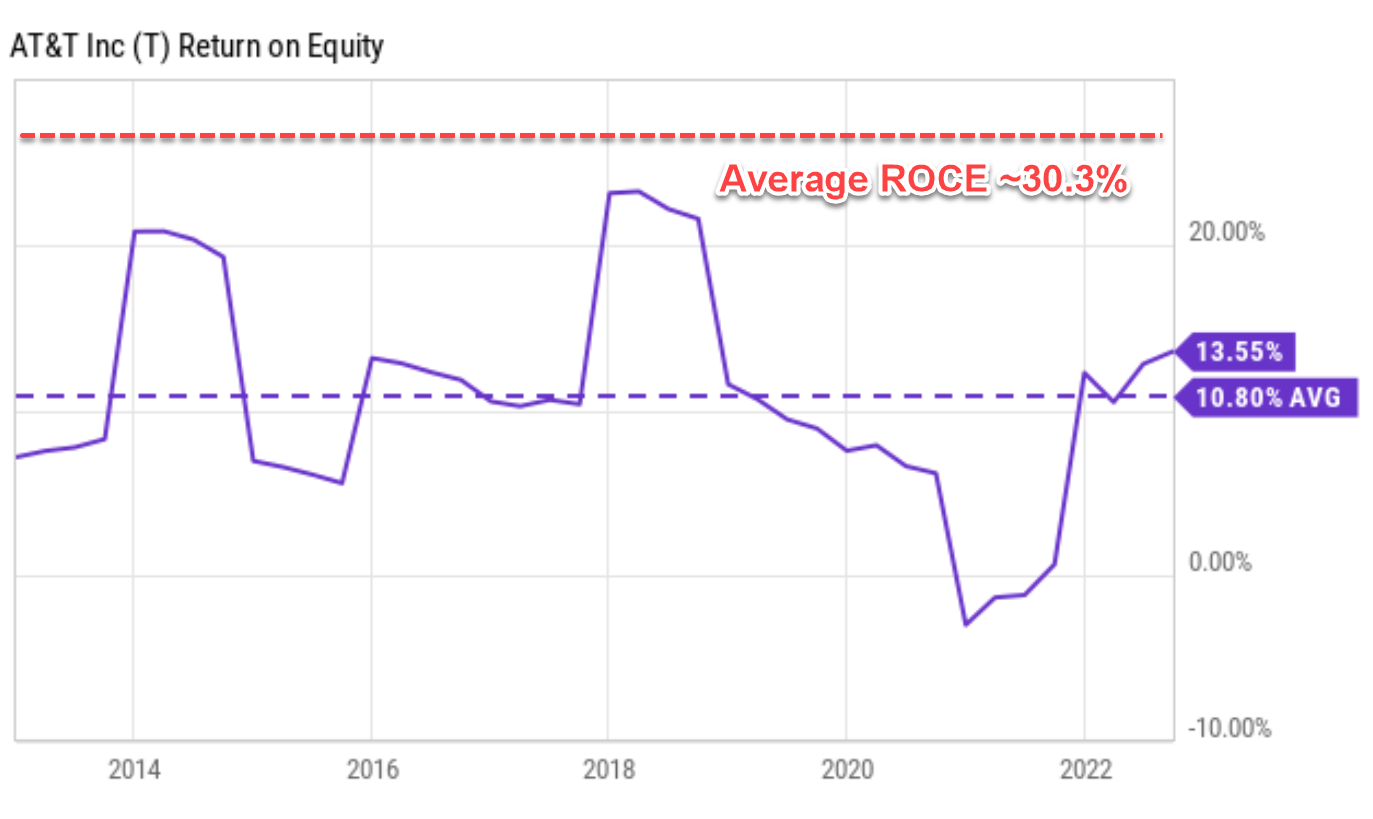
Besides providing sustainability to dividends, its healthy profitability and ROCE also provide organic growth potential. The chart below shows its capital allocation in recent years. Maintenance CAPEX represents about 54% of its OPC (operation cash flow) in the past few years since 2018. And dividends represent another 33%, and therefore these two items represent 87% of its total OPC. For the remainder 13%, I estimate that T has been maintaining a reinvestment rate of around 5% to 7.5% in recent years, and I see such a reinvestment rate as very sustainable too.
Source: Author based on Seeking Alpha data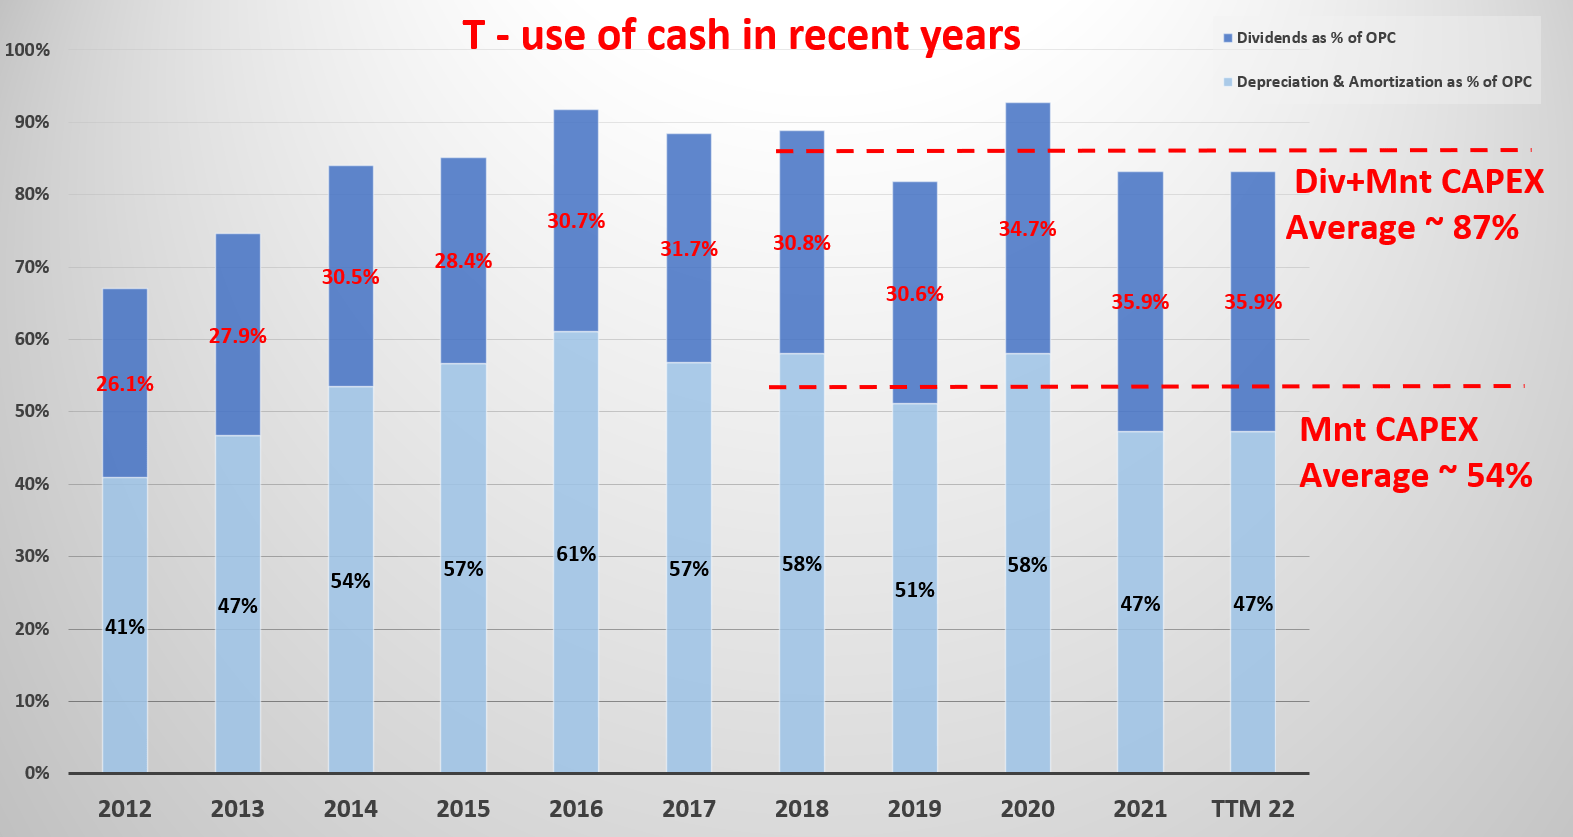
Growth potential, valuation, and projected returns
Onto to valuations. The organic growth potential analyzed above, when combined with its compressed valuation, provides an attractive total return potential. As the following table shows, T is currently heavily discounted. Its present P/Cash flow ratio is only about 3.5x, discounted from its historical average of 5.5x by 36%. Again, investors should not use its dividend yield as a valuation metric here due to the adjustment caused by its recent Warner spinoff as aforementioned.
With the above large valuation contraction, an outsized return potential can be expected even with a moderate growth rate. Here I am assuming a 4% growth rate. A ROCE of 30.3% combined with a reinvestment rate of 7.5% can drive 2.3% of real growth already (30.3% ROCE * 7.5% reinvestment rate = 2.3%). Adding a 2% inflation escalator would lead to a 4%+ nominal growth rate. Under this conservative assumption, for the next 3~5 years, the total return is projected to be in a range of 17% (the low-end projection) to about 84% (the high-end projection), translating into an annual return of 4.0%to 16.6%.
And again, note here that its current dividend yield of 7.3% only represents less than half of the total return potential in the bullish case.
Source: Author based on Seeking Alpha data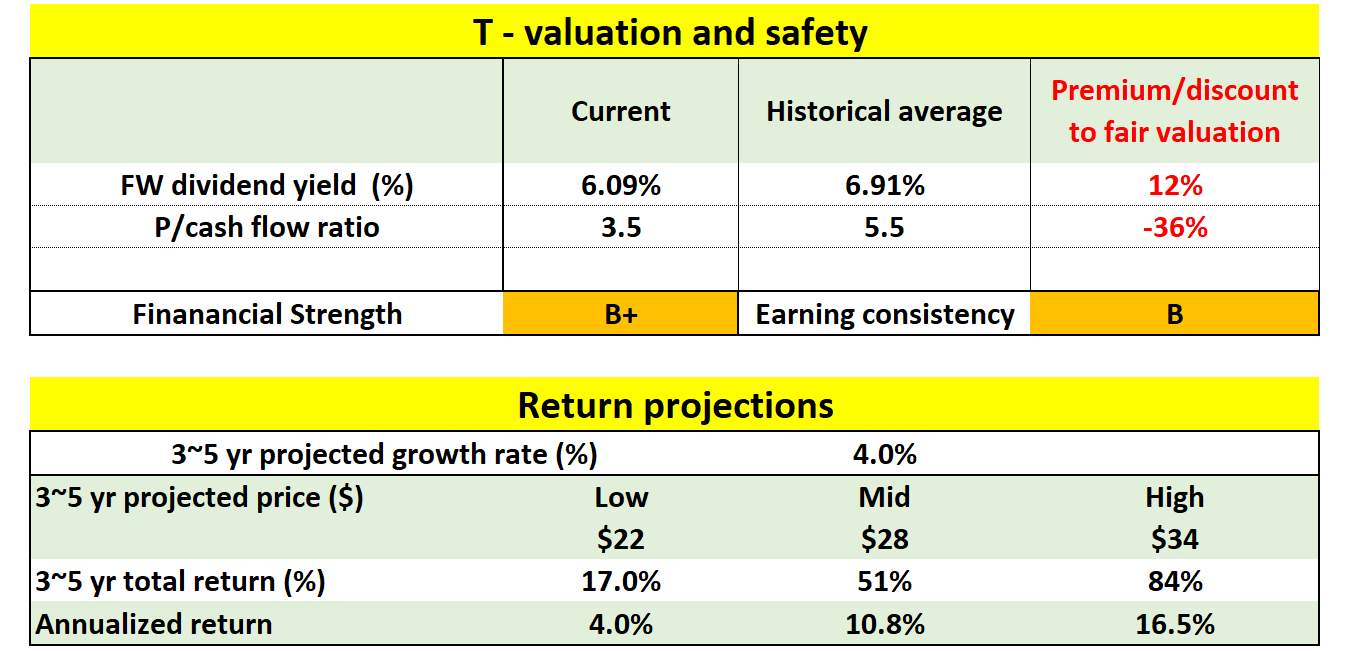
Risks and final thoughts
The risks surrounding T have been fully detailed in other SA articles (including some of our own articles). As a brief recap, these risks include interest rates risks given its relatively high leverage ratio, the heavy capital investment requirements for to continue its 5G and fiber layouts, and the need to compete against other players such as those mentioned earlier (VZ, CMCSA, et al). All these risks are reflected in its much higher volatilities as seen in the chart below. T’s beta in the past 24 months is 0.5, substantially higher than the XLC fund and almost 2x higher than VZ’s 0.28. The volatility for T is even large in the past 60 months (with a beta of 0.65).
Source: Seeking Alpha data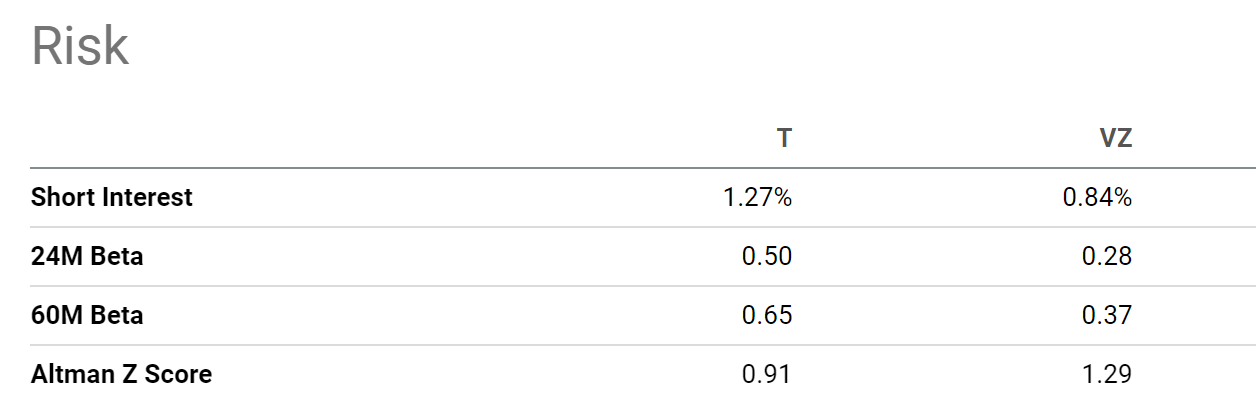
To conclude, current conditions have created an attractive setup for both the telecom service sector and especially T. The setup now provides BOTH high current dividends (7.3%) AND healthy prospects for price appreciation (total return potential could be as high as 16.5%). In the past, T’s total returns have largely come from its dividend yields. So, in a sense, investors can eat the cake now and also keep a good part of it under the current conditions. Finally, the possibility to lower new share issuance or even buy back shares at compressed valuation adds a tremendous upside potential to total shareholder returns in the long term.
Be the first to comment