Araya Doheny/Getty Images Entertainment
Asana (NYSE:ASAN) is a work management SaaS platform which helps enterprises organise, track, and manage their work projects. The business serves over 131,000 paid customers across 200+ countries and is led by Co-Founder and CEO Dustin Moskovitz, who owns more than 30% of outstanding shares and was the Co-Founder of Meta Platforms (NASDAQ:META).
It is among a growing list of public SaaS companies operating in the work management space, including the large incumbent, Atlassian (NASDAQ:TEAM), and monday.com (NASDAQ:MNDY).
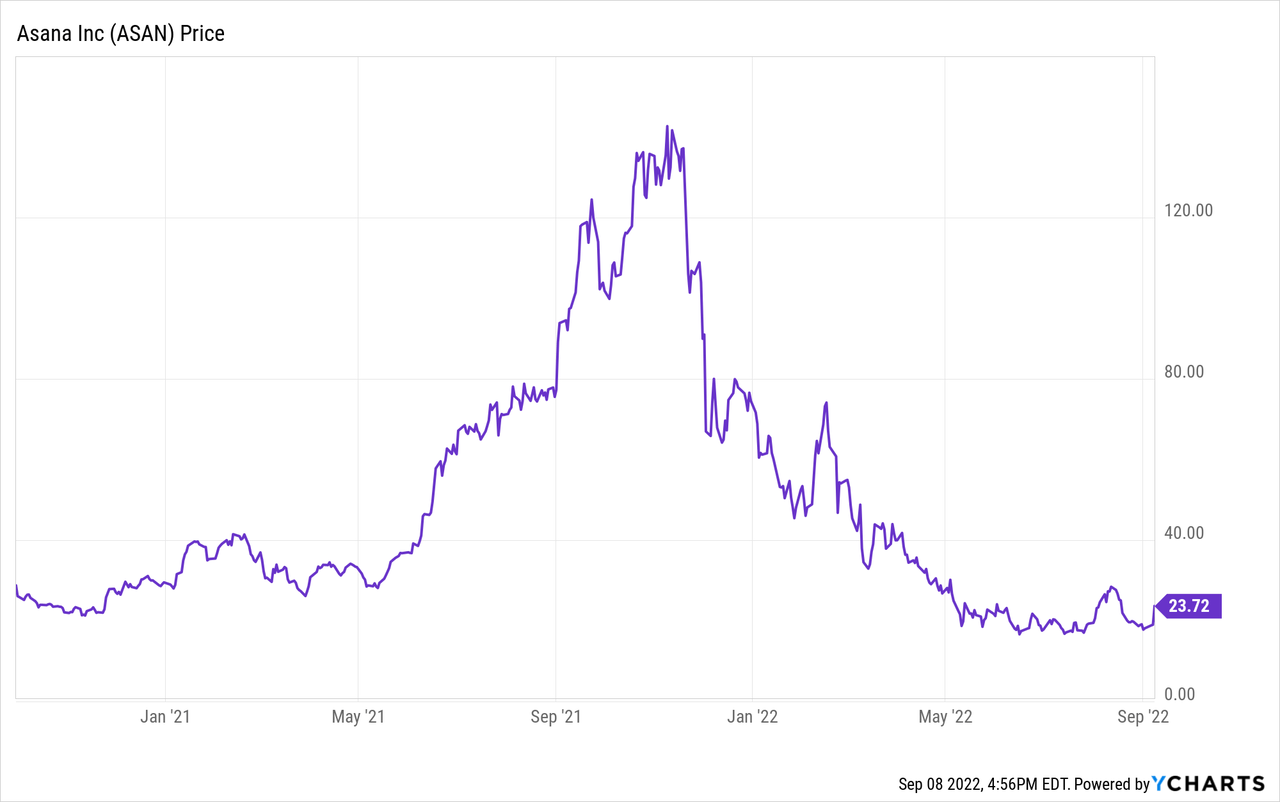
Asana has been on a wild ride since their direct listing in September 2020. At one stage, shares were up more than 450% from their listing price before crashing back down to earth with an 84% fall from their 52-week high in November 2021 (note: this includes the 25% pop in share price which occurred overnight).
In this article, I delve into Asana’s latest Q2 FY23 results, highlighting their strong revenue growth, net dollar retention rates, and gross margins, while also offering a critical evaluation of their lack of operating leverage and exorbitant stock-based compensation (SBC). Overall, I remain a holder (but not a buyer) of Asana and need to see more signs of operating leverage before adding to my position.
A ‘beat-and-raise’ quarter for revenue
Asana has a demonstrated track-record since entering the public markets of ‘under-promising and over-delivering’ and this quarter was no exception.
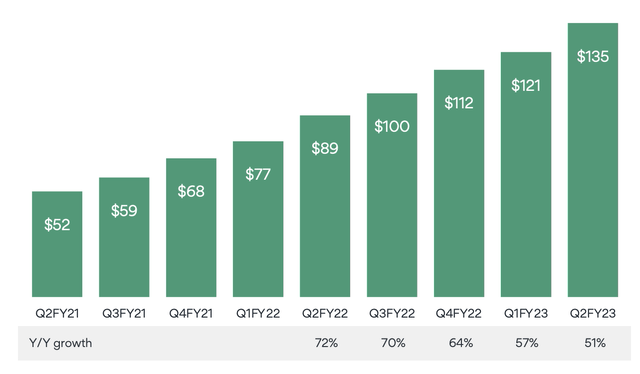
In Q2 FY23, Asana reported revenue of $134.9m (+12% QoQ; +51% YoY), which was well ahead of their guidance for revenue of $127-128m. In constant currency terms, Asana’s revenue growth was even stronger, coming in at 53% YoY. This impressive result was driven by 64% YoY revenue growth in customers spending >$5k annualised with Asana and 59% YoY revenue growth from US customers.
As a result, Asana raised their FY23 revenue guidance from $536-540m (42-43% YoY growth) to $544-547m (44-45% YoY growth). Raising FY23 revenue guidance in the midst of a global macroeconomic slowdown is a sign of strength and indicates management’s confidence in demand for their SaaS product, independent of macroeconomic factors.
This is what we look for as investors; secular growth companies operating in large markets which can weather economic storms and continue to chalk up impressive growth rates, despite broader macroeconomic forces.
Asana Revenue Chart (Asana Q2 FY23 Investor Presentation)
Asana’s strong Q2 revenue growth was the result of both expansion with existing customers (more on this below) but also adding new customers. Indeed, the number of customers spending >$5k annualised with Asana increased 41% YoY to 18,040.
These growth rates become even more impressive when assessing larger enterprise customers. In Q2, Asana reported 91% and 105% YoY growth in the number of customers spending >$50k and >$100k annualised with Asana, respectively.
Asana is positioning themselves as the go-to work management software platform for large, complex enterprises working in cross-functional teams. Indeed, Asana works with over 80% of Fortune 100 companies, demonstrating their high penetration among the largest US enterprises.
We recently performed an analysis of how our enterprise customers get value from Asana and found that the vast majority are using it for cross-functional collaboration. I share this with you because this is truly how we are most differentiated from other work management software. These tools make it easy to track single projects for single teams. In contrast, more than half of all work tracked in Asana is cross-functional in nature. This number jumps to over 60% for customers spending more than $100,000, and we see an even higher proportion of this cross-functional collaboration in the features we’ve built as we’ve moved up market, including Goals & Portfolios. (CEO Dustin Moskovitz, Q2 FY23 Earnings Call)
Net revenue retention remains strong
One of the most attractive elements of Asana’s business is the recurring nature of their SaaS model and their high retention rates once a customer is onboarded. Once a customer begins using the platform, Asana can upsell to these existing customers through: (1) adding new seats as more users within the enterprise begin using Asana to manage their workflow and (2) cross-selling new products and features and higher-tier plans. As a result, customers tend to spend more with Asana over time, creating a powerful organic growth engine independent of the need to acquire new customers.
In Q2, Asana reported another quarter of exceptional net revenue retention rates with >120% net revenue retention across their entire customer base (includes lots of SMEs which tend to have higher churn and less room to expand the number of seats within their organisation) and >145% net revenue retention across their largest enterprise customers.
These reported net retention rates were unchanged from the prior three quarters; a strong sign given the significant changes in macroeconomic conditions (e.g., higher inflation, rising interest rates, declining GDP, etc.) over this time period.
Asana Dollar-Based Net Revenue Retention (Asana Q2 FY23 Investor Presentation)
High gross margins create the conditions for operating leverage
One of the most attractive characteristics of the SaaS business model is that there are minimal direct costs (i.e., cost of sales) associated with rolling out software to new customers. Once the software is built (which requires significant upfront investment), it can be scaled and delivered to thousands of customers with negligible incremental direct costs. As such, SaaS companies often boast 80%+ gross margins and Asana’s gross margins are among the highest of US-listed public SaaS businesses.
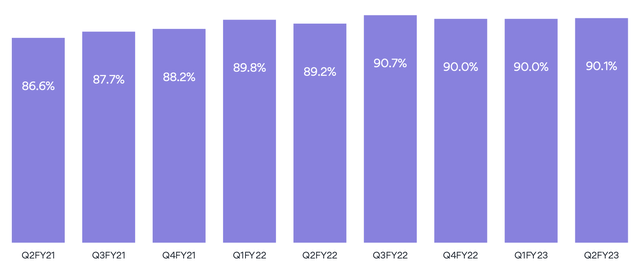
As is shown below, Asana’s gross margins have remained in the 89-90% range since Q1 FY22. Note that these are non-GAAP gross margins, but are almost identical to Asana’s GAAP gross margins. As an example, Asana’s non-GAAP gross margin in Q2 FY23 was 90.1%, while their GAAP gross margin was 89.8%.
Having a capital-efficient business model with 90% gross margins creates the conditions for powerful operating leverage as revenue growth outpaces expense growth, leading to rapid margin expansion. Asana is a business with the potential to generate 30%+ operating margins at scale, but this has not materialised so far.
Asana Non-GAAP Gross Margins (Asana Q2 FY23 Investor Presentation)
Dustin, where is the operating leverage?
As a SaaS business reaches scale, one would expect to see signs of operating leverage and margin expansion. However, to date, none of Asana’s strong revenue growth has translated to improvements in the bottom line.
Throughout this section, I’m going to be referring to GAAP figures which includes SBC. One of my gripes with Asana management has been their incessant reporting of non-GAAP measures (which excludes SBC) in both their financial reports and earnings calls. SBC in lieu of salary is a genuine expense and has a real cost in terms of dilution for investors, so ignoring it obscures the true financial performance of a business.
Operating margins
In the below table, I’ve calculated Asana’s operating margin over the past eight quarters as the business has scaled from $236m in annualised revenue (ARR) in Q3 FY21 to $540m ARR in the latest quarter.
| Quarter | Operating loss ($) | Operating margin (%) |
| Q3 FY21 | ($61.9m) | (105%) |
| Q4 FY21 | ($51.0m) | (75%) |
| Q1 FY22 | ($50.0m) | (65%) |
| Q2 FY22 | ($60.1m) | (67%) |
| Q3 FY22 | ($68.1m) | (68%) |
| Q4 FY22 | ($87.1m) | (78%) |
| Q1 FY23 | ($96.2m) | (80%) |
| Q2 FY23 | ($111.3m) | (82%) |
Where is the operating leverage? Nowhere to be seen.
In reality, operating margins have gotten worse each quarter since Q1 FY22. This is understandable for a small start-up that still needs to invest significant amounts to build out their software and hire an initial enterprise sales team, but is much less forgivable for a mature SaaS business that has been operating for 14 years, has a $4.5b market cap, and is operating at a $540m ARR.
Let’s break down the two biggest drivers of Asana’s operating losses: sales and marketing (S&M) and research and development (R&D).
Sales and marketing
| Quarter | S&M spend ($) | S&M as a % of revenue |
| Q3 FY21 | $48.0m | 82% |
| Q4 FY21 | $53.5m | 78% |
| Q1 FY22 | $56.8m | 74% |
| Q2 FY22 | $63.9m | 71% |
| Q3 FY22 | $73.3m | 73% |
| Q4 FY22 | $88.9m | 79% |
| Q1 FY23 | $96.1m | 80% |
| Q2 FY23 | $110.4m | 82% |
The fact that Asana’s sales and marketing spend as a percentage of revenue is rising with increasing scale suggests a poor return on their marketing dollars. Indeed, growth in sales and marketing spend has consistently outpaced revenue growth over the past few quarters.
Theoretically, if the lifetime value of a customer (LTV) exceeds the cost to acquire that customer (CaC), these sales and marketing investments are justified if one takes a medium-to-long-term perspective. However, to date, we’ve seen no evidence of operating leverage or that Asana is able to effectively acquire customers without spending unsustainable amounts on a bloated enterprise sales team.
Such high sales and marketing spend suggests there is either: (1) poor awareness of the benefits of work management software among large enterprises, requiring substantial time to convince them to use the product or (2) high competition in the work management space between Asana and other rivals, like Atlassian or Monday.com.
To become profitable and free cash flow positive, Asana will need to reduce sales and marketing spend to around 30-40% of revenue. At this stage, it is debatable whether Asana’s unit economics are strong enough to continue to post strong revenue growth rates while pulling back on sales and marketing spend.
Research and development
Let’s now take a look at Asana’s research and development spend, which is used to build out new product features and enhance their customer experience.
| Quarter | R&D spend ($) | R&D as a % of revenue |
| Q3 FY21 | $33.0m | 56% |
| Q4 FY21 | $39.8m | 58% |
| Q1 FY22 | $40.0m | 52% |
| Q2 FY22 | $48.5m | 54% |
| Q3 FY22 | $53.8m | 54% |
| Q4 FY22 | $60.9m | 54% |
| Q1 FY23 | $65.2m | 54% |
| Q2 FY23 | $75.2m | 56% |
Again, where is the operating leverage?
Research and development spend – almost uncannily as if management have set specific targets around the 55% of revenue mark – has hovered between 52-58% of revenue over the past eight quarters.
I am not opposed to high research and development spend as improving their product should theoretically make it easier for Asana to acquire new customers, retain existing customers, and enhance their long-term competitive position.
However, consistently spending >50% of revenue on research and development suggests that the industry is so competitive that Asana needs to continually invest in product development to retain their competitive position. As such, it might be difficult for Asana to scale down their research and development spend over time to reach positive operating margins without competitors like Atlassian and Monday.com taking substantial market share.
Exorbitant stock-based compensation (SBC) is a major concern
Asana has a track record of issuing egregious levels of SBC to their employees. Perhaps this accounts for their almost perfect employee satisfaction ratings on Glassdoor?
Most SaaS companies report large spikes in SBC around the time of going public, but SBC as a percentage of revenue generally decreases as the business scales over time.
Asana is showing the opposite pattern. If we track Asana’s SBC as a percentage of revenue over the past eight quarters, it has more than doubled from 15% in Q3 FY21 to 36% in Q2 FY23 (note: Asana also includes related employer payroll tax associated with employee stock options to calculate SBC).
As such, Asana’s basic and diluted share count has increased from 113m in Q3 FY21 to 191m in Q2 FY23, substantially reducing the ownership stake of existing shareholders.
| Quarter | SBC ($) | SBC as a % of revenue |
| Q3 FY21 | $8.9m | 15% |
| Q4 FY21 | $15.9m | 23% |
| Q1 FY22 | $16.7m | 22% |
| Q2 FY22 | $21.5m | 24% |
| Q3 FY22 | $26.8m | 27% |
| Q4 FY22 | $43.2m | 39% |
| Q1 FY23 | $41.5m | 34% |
| Q2 FY23 | $48.7m | 36% |
Dustin Moskovitz to the rescue with a $350m capital injection
At the end of July 2022, Asana had $148.5m in cash and cash equivalents and $90.5m in marketable securities on their balance sheet. For a business with a market cap of $4.5b and cash burn of $90.4m over the prior two quarters, this cash balance was not sufficient to last until the business becomes profitable.
As such, the board decided that it was appropriate for CEO Dustin Moskovitz who has a net worth >$5b to cover a $350m private placement out of his own pocket.
This move has a number of benefits for shareholders and is likely a major contributor to the 25% pop in share price overnight. In short, it: (1) reduces the amount that Asana needs to spend on lawyer/banker fees for the capital raising, (2) allows senior management to continue focusing on running with the business without needing to divert their attention to the capital raise, (3) avoided raising capital at a large discount to the recent trading price for Asana shares which often happens when companies are forced to raise capital in a bad market due to insolvency risk, and (4) increases Dustin’s ownership of Asana and his skin in the game.
In addition, as you have seen in today’s press release, we announced a private placement by our CEO. Dustin purchased approximately 19 million shares of Class A common stock at $18.16 per share, which was the closing trading price of our Class A common stock on Friday, September 2, 2022. This investment of $350 million will increase our cash balance to over $585 million in total.
We believe that this additional capital will provide sufficient funding to execute on our current strategies and for us to achieve positive free cash flow, which we are targeting before the end of calendar year 2024. (CFO Tim Wan, Q2 FY23 Earnings Call)
In short, Asana now has enough cash to fund operations through to their stated goal of generating positive free cash flow before the end of CY24.
CEO Dustin Moskovitz to the rescue! Maybe he can use his war chest to buy the entire company at a large premium to the current share price and bail out shareholders?
Asana’s revenue multiple is beginning to look more palatable
Asana has experienced the highs and lows of being a public company since their direct listing in September 2020.
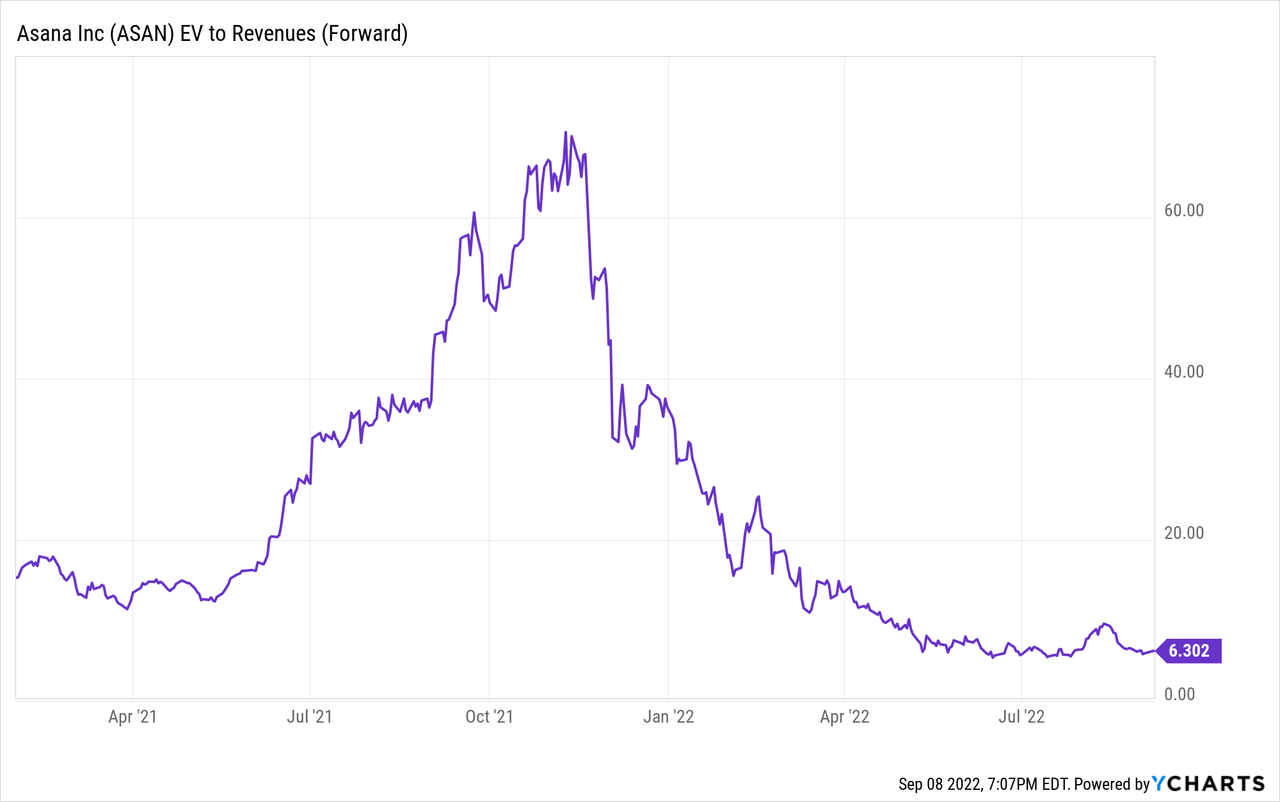
The business went public at a valuation of around 15x forward revenue and shot up to a nosebleed valuation of around 70x forward revenue in November 2021. Since that 52-week high, Asana’s share price has cratered 84% and its multiple has decreased to a much more palatable 6.3x forward revenue (note: it often takes a while for analyst estimates to be updated in YCharts so add some margin for error to this number).

Asana’s current revenue multiple is broadly in line with the median revenue multiple for US-listed SaaS stocks, despite having a higher YoY revenue growth rate, world-class gross margins, and a management team with significant inside ownership. On a surface level, Asana’s revenue multiple seems reasonable.
However, it is difficult to forecast Asana’s share price performance without a clear grasp on their path to profitability or expected long-term margins. CEO Dustin Moskovitz mentioned in the Q2 earnings call that Asana is aiming to become free cash flow positive by the end of 2024, but the CFO was sparse on the specific levers Asana would pull to improve margins:
So, what I would say is we’re incredibly focused on gaining efficiencies across all — across the whole organizations. I think where you’ll first kind of see where gains inefficiencies in the operating income statement is G&A and R&D. And then over time that you can expect us to see improvement in sales and marketing as we kind of focus and divert our attention of moving upmarket. (CFO Tim Wan, Q2 FY23 Earnings Call)
Given Asana’s questionable return on marketing spend and high research and development spend needed to stave off competition, Asana’s path to operating leverage could prove more challenging than I expected even 12 months ago.
Conclusion
Asana is a tough business to analyse. It has all the hallmarks of a world-class SaaS business: (1) strong revenue growth rates, (2) 90% gross margins, (3) an enormous $50b+ TAM, and (4) phenomenal net revenue retention rates, particularly for their largest enterprise customers. However, unit economics appear quite weak, SBC is out of control, and the business shows no signs of operating leverage, despite its increasing scale and penetration within enterprises.
While I gain some comfort from CEO Dustin Moskovitz continuing to add shares at these depressed share price levels, it will take a clear roadmap of their path to profitability and/or signs of operating leverage in upcoming quarters to convince me to purchase more Asana shares and make it a meaningful part of my portfolio. Until then, it’ll remain a small part of my portfolio (<1%).


Be the first to comment