

deberarr/iStock via Getty Images
I first looked at mid-cap asset manager Artisan Partners (NYSE:APAM) in January 2022 and found the staff to be well aligned with shareholder interests and the stock to be a compelling long-term opportunity for income-oriented investors. APAM typically distributes all of its free cash flow in the form of quarterly dividends and a special dividend in February. I discussed various aspects underlying APAM’s dividend in my follow-up article in late March. In my last article from late April, I commented on the company’s performance in the first quarter of 2022 and its growth initiatives. In the meantime, I have added to my position on several occasions.
The stock market has performed quite poorly in the first half of 2022, although I believe a correction was definitely needed at some point after an exuberant 2021 – notwithstanding the significant rise in inflation, the Federal Reserve’s tightening of monetary policy, the hot war in Ukraine, and the resulting energy crisis. In this article, I will discuss APAM’s performance during market downturns, and that of its five largest funds in particular (as measured by assets under management, AUM), and explain why I believe the stock remains a good investment for long-term investors.
Artisan Partners Only Went Public In 2013 – How Can We Safely Assess Whether It Can Weather A Recession?
Particularly with cyclical companies – and as an equity-oriented asset manager, APAM is certainly very cyclical – I always examine the company’s performance during the Great Recession. Having been formed in the mid-1990s, APAM obviously navigated the 2000 and 2008/09 recessions successfully. However, performance during these periods cannot be examined as APAM did not go public until early 2013. As a result, its earnings history as a public company should be seen in the context of one of the strongest bull markets in recent history. Notable exceptions were the sell-off in late 2018 and, of course, the very brief recession in early 2020.
Looking at quarter-end AUM is not particularly accurate, but in the absence of more detailed data, serves as a good proxy for evaluating the company’s performance over these periods. Between September 30, 2018 and December 31, 2018, APAM’s AUM declined 21.2%, while the S&P 500 declined 16.7%. During this period, APAM’s clients withdrew a net $4.9 billion, accounting for 24% of the AUM decline and explaining the difference relatively well. At the end of June 2019, APAM’s assets under management returned to September 2018 levels, while client cash flows were relatively balanced during this period.
The decline, attributed to client outflows at the end of 2018, is concerning because APAM is a small company that manages the majority of assets for institutional clients, which are typically considered “strong hands”. According to APAM’s 2021 10-K, only 4% of AUM came from retail investors. About two-thirds of APAM’s assets come from institutional channels and are associated with, for example, U.S.-registered mutual funds, non-U.S. funds, state and local governments, and employee benefit plans. It is possible that some of the risk management of the portfolios is based on value-at-risk methods, i.e., selling transactions are triggered during periods of increased volatility. However, institutional clients generally do not withdraw their money unless they are no longer satisfied with the services provided or have found a more suitable alternative.
In this context, it should be noted that during the much more severe sell-off in early 2020, APAM’s AUM declined 27.1% (compared to 24.9% for the S&P 500), while the company saw only $0.5 billion in net outflows. Since then, APAM recorded net inflows each quarter ($10 billion in total), with the exception of Q3 2021 (net outflows of $0.8 billion). I consider this a great performance, especially when compared to larger competitors such as T. Rowe Price (TROW) and Franklin Resources (BEN), which I covered previously in March and January, respectively. Especially BEN is struggling with continued outflows (see Figure 3 in my comparative analysis). Of course, it could be argued that a smaller asset manager like APAM benefits from stronger, more personalized customer relationships, but this is certainly a double-edged sword especially during times of continued underperformance. In the following, I will therefore discuss the performance of APAM’s five largest funds.
Figure 1: Artisan Partners’ AUM at the end of each quarter, compared to the price of the S&P 500 at the end of each quarter, using SPY as a proxy (own work, based on the company’s 10-Q and 10-K statements, the June 9, 2022 8-K, and the quarterly closing price of SPY)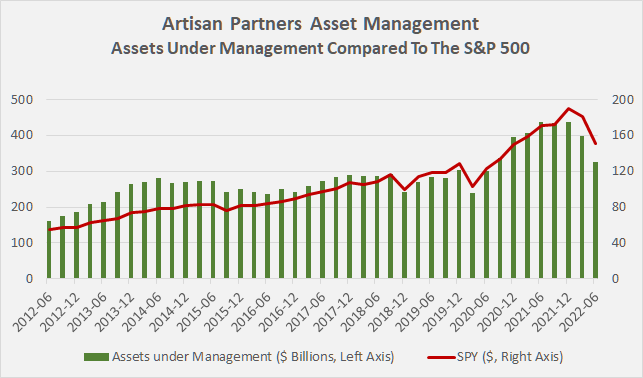
Performance Of Artisan Partners’ Five Largest Funds
APAM offers a diversified fund range, with a focus on growth, value, or growth at a reasonable price. Other funds focus on emerging market equities or debt, with the latter currently a priority, being part of the newly formed EMsights Capital Group investment team. The Emerging Markets Debt Opportunities fund was just launched in early April 2022 and had AUM of $21 million (i.e., 0.02% of total AUM) at the end of the six-month period.
Figure 2 shows the fund-specific AUM for the five largest APAM funds and the remaining smaller funds (green) in $ values. Figure 3 shows the portfolio distribution normalized to 100% of AUM.
Figure 2: Fund-specific AUM of Artisan Partners’ five largest funds and the collective of smaller funds (own work, based on the company’s 8-Ks announcing end-of-month AUM) Figure 3: Fund-specific AUM of Artisan Partners’ five largest funds and the collective of smaller funds, normalized to 100% (own work, based on the company’s 8-Ks announcing end-of-month AUM)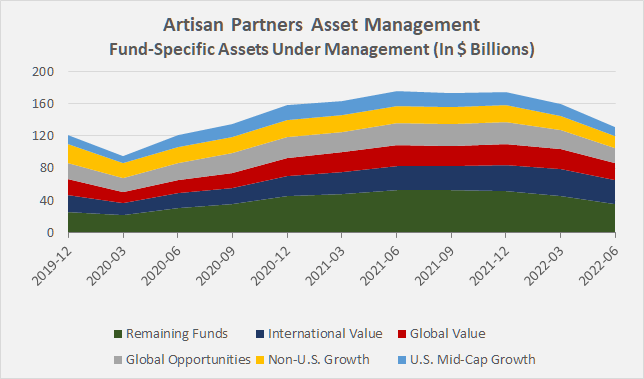
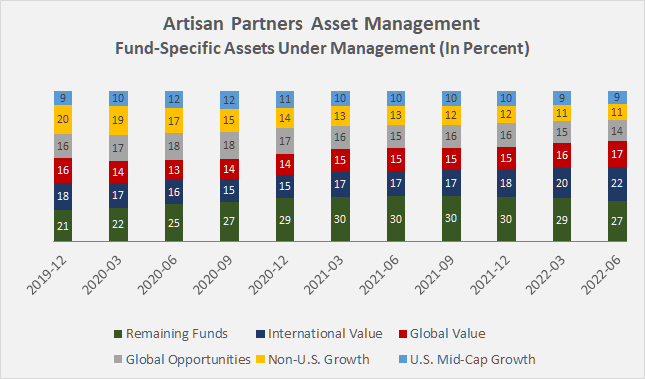
The following five funds are APAM’s largest and accounted for nearly 73% of the company’s total AUM at the end of June 2022:
- International Value: This equity fund focuses on value investing principles (i.e., companies with strong free cash flow, high returns on capital, strong competitive positions, and solid balance sheets). With $29.4 billion in assets under management as of June 30, 2022, it is APAM’s largest fund (up approximately 85% since the end of the first quarter of 2020). The fund currently has a five-star overall rating and a silver analyst rating from Morningstar. It is heavily invested in European equities (>55% of portfolio securities, albeit with a focus on Switzerland and the U.K.). At the end of June 2022, 13.8% of the portfolio was invested in U.S. equities. The emphasis on “safe havens” (in terms of currency) explains the fund’s strong performance: year-to-date (YTD), the fund has outperformed its benchmark MSCI Europe, Australasia and Far East (EAFE) by 6.4%, but is still down 13.2%. Since its inception in September 2002 (Investor Class), the fund has outperformed its benchmark by an average of 443 basis points per year, making its expense ratio of 118 basis points (Semi-Annual Report March 31, 2022) quite reasonable. The fund is currently closed to most new investors. Current investors do not appear to have withdrawn funds, as evidenced by the decline in assets under management of approximately 10% YTD.
- Global Value – APAM’s second largest fund by assets under management shares its main investment principles with the International Value fund, the main difference being that this fund is predominantly U.S. focused (45.3% of portfolio securities at the end of June 2022). Nevertheless, certain non-U.S. stocks such as Danone SA (OTCQX:DANOY), Novartis AG (NVS), and Samsung Electronics Co Ltd (OTCPK:SSNLF, OTCPK:SSNNF) are important components of both funds. The fund is currently rated three stars and carries a silver analyst rating by Morningstar. Since its inception in December 2007, it has outperformed its benchmark (MSCI All Countries World Index, ACWI) by an average of about 200 basis points per year, and its expense ratio is similar to that of the International Value Fund. Over the year, the fund outperformed its benchmark by 483 basis points (YTD performance of -15.4%) and remains open to new investors. With AUM down 14% YTD, it is reasonable to assume that the fund has seen net inflows from clients.
- APAM’s third-largest fund in terms of AUM is the growth-oriented Global Opportunities fund. It is open to new investors and was launched in September 2008. Currently, it is a four-star bronze rate fund (Morningstar), and its expense ratio of 113 basis points appears reasonable considering its outperformance by 333 basis point per year on average. However, due to its focus on growth stocks, the fund has lost 31.4% YTD, significantly underperforming its benchmark (-20.2%). 60% of the securities in the portfolio are U.S. equities (e.g., Veeva Systems Inc (VEEV), Advanced Micro Devices Inc (AMD), and NextEra Energy Inc (NEE)). Since the beginning of the year, the associated AUM have declined by 22.6%, potentially suggesting cash inflows from clients.
- With $14.2 billion in AUM at the end of June 2022, Non-U.S. Growth is APAM’s fourth largest strategy. The investment team aims to identify long-term secular growth trends and invest in companies that will benefit from those trends. Interestingly, the largest single position in the strategy is Shell plc (SHEL), which represents 4.6% of the total portfolio as of June 30, 2022. And surprisingly, only 7.7% and 5.4% of portfolio securities are associated with communication services and information technology stocks, respectively. Nearly 18% of the portfolio securities are German equities, followed closely by U.K. (17%) and French (14%) equities. Since its inception in 1996, the composite has outperformed the MSCI EAFE benchmark by an average of 467 basis points per year. After fees, the strategy outperformed the benchmark by an average of 366 basis points per year – certainly not a bad performance.
- Finally, the Artisan Mid Cap Fund is APAM’s fifth largest fund and had $11.1 billion in AUM as of June 30, 2022. Similar to the aforementioned strategy, it focuses on growth opportunities, but with an emphasis on U.S. rather than international stocks. The managers seek to identify companies with franchise characteristics that will benefit from an accelerating profit cycle. With a focus on stocks at a valuation discount to private market value, its managers likely invest with the intention of buyouts. So far in 2022, the fund lagged the Russell Midcap Growth benchmark index by 350 basis points – both fell more than 30% YTD. This is hardly surprising given the fund’s heavy exposure to IT companies (32.6% of portfolio securities as of June 30, 2022). However, over the long term, the fund outperformed its benchmark by an average of 418 basis points per year before fees (about 120 basis points). The fund currently has a three-star bronze rating. Having been on the market for more than 25 years, it is one of APAM’s older funds, but is still accessible to new investors.
In my view, APAM’s major funds offer a balanced mix of U.S. and international equities, taking into account both value and growth aspects. Compared to their benchmarks, all five funds have significantly outperformed since inception, and management fees appear reasonable in this context. It should be noted, however, that with the exception of the International Value fund, the relative outperformance of all the funds and strategies examined has declined in recent years, and the Global Value and Global Opportunities funds as well as the Non-U.S. Growth strategy have even lagged behind their benchmarks (Figure 4). The narrowing performance gap is likely to increasingly cause institutional investors to question the value of APAM’s high expense ratio. I do not consider this trend alarming, but will continue to closely monitor the relative performance of APAM’s funds. It also seems worth noting that the benchmarks chosen are not necessarily good comparisons.
Figure 4: Comparison of the long-term and short-term performance of Artisan Partners’ largest funds with their respective benchmarks (own presentation, based on data published on Artisan Partners’ website, reference date June 30, 2022).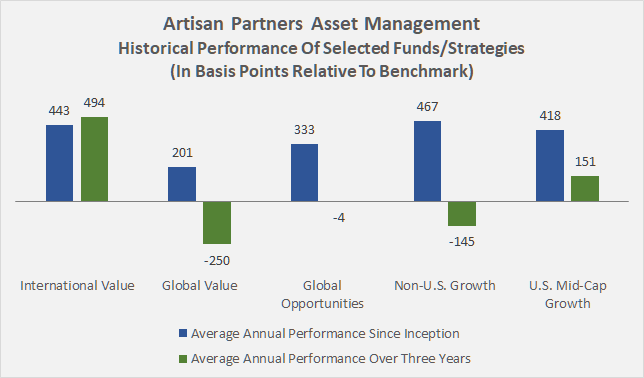
Concluding Remarks
Artisan Partners benefits from its relatively small size, which allows its asset managers to operate with great decision-making freedom and build strong client relationships – as evidenced by the stable long-term retention of client money, with the exception of the fourth quarter of 2017 and the second half of 2018. I am confident that it is during prolonged bear markets that the wheat is separated from the chaff and that active funds can outperform index fund investors in such times.
APAM employs asset managers with decades of experience. Mark Yockey is probably Artisan’s portfolio manager with the most experience (41 years). He joined Artisan Partners in 1995. Other highly experienced managers include Craigh Cepukenas (33 years of experience, with Artisan since 1995), Charles-Henri Hamker (32 years of experience, with Artisan since 2000), and Daniel O’Keefe (29 years of experience, with Artisan since 2002). The portfolio managers’ commitment is very high, and the staff is well incentivized to act in the best interest of shareholders, as I pointed out in my first article about the company.
In an effort to constantly invert, as it was suggested in Poor Charlie’s Almanack, I keep trying to poke holes in my investment cases. Given the narrowing performance gap of many of APAM’s major funds and strategies relative to its benchmarks, I am somewhat less optimistic, but still think the company is a good investment for the reasons stated above. If the current bear market proves to be prolonged, it will be very interesting to see if the company’s funds, which are currently underperforming, can regain their previous levels.
Thank you very much for taking the time to read my article. In case of any questions or comments, I’m very happy to read from you in the comments section below.
Be the first to comment