


Photo Italia LLC
Earnings of Arrow Financial Corporation (NASDAQ:AROW) will receive a boost from New York’s strong job markets and the lagged effect of interest rate hikes. On the other hand, growth in salary expenses will limit the increase in earnings. Overall, I’m expecting Arrow Financial to report earnings of $3.00 per share for 2022 and $3.30 per share for 2023. Compared to my last report on the company, I have slightly reduced my earnings estimate for 2023 as I’ve raised my non-interest expense estimate. Next year’s target price suggests a small upside from the current market price. Based on the total expected return, I’m upgrading Arrow Financial Corporation to a buy rating.
New York’s Healthy Job Market to Sustain Loan Growth
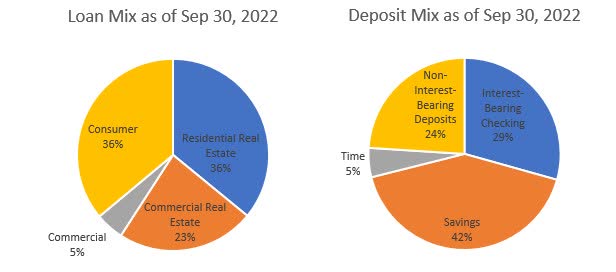
Arrow Financial Corporation’s loan growth remained near the historical average during the third quarter of 2022. Going forward, loan growth is likely to slightly slow down because of high interest rates. The residential mortgage segment is likely to be hit the most as demand in the segment is dependent on borrowing costs and home prices. Residential mortgages are an important component of Arrow’s loan book as they made up around 36% of the total loan portfolio at the end of September 2022.
On the other hand, regional economic dynamics will likely support loan growth. Arrow Financial operates in the state of New York, where the recent trend of economic activity is a bit shaky. Nevertheless, the trend line is upward-sloping, as shown below.
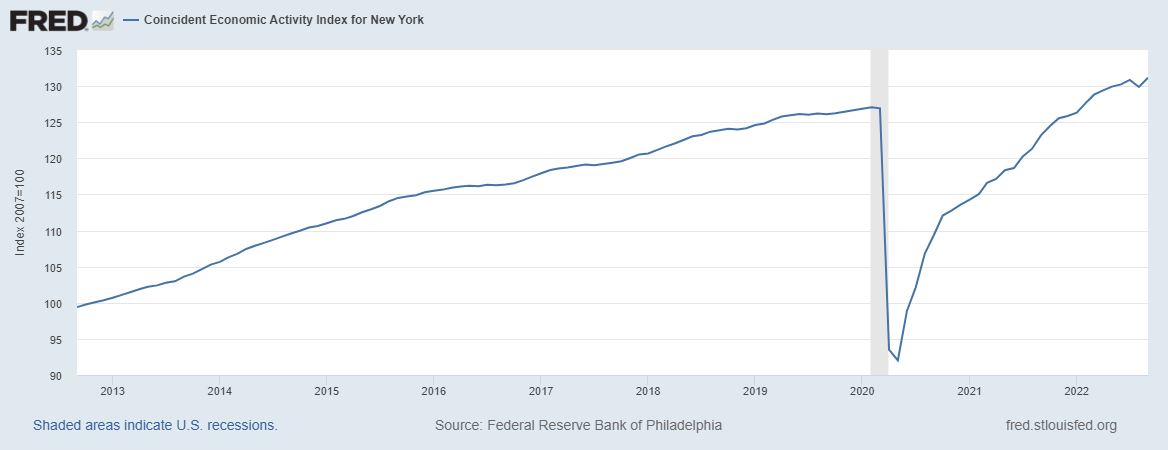
The Federal Reserve Bank of Philadelphia
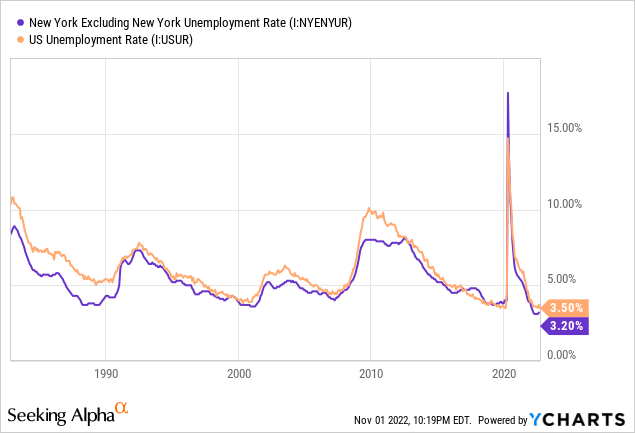
Further, New York’s labor market is quite strong, which is a positive signal for future credit demand. The unemployment rate for the state of New York (excluding New York City) is near record lows, as shown below.
Considering these factors, I’m expecting the loan portfolio to grow by 2.0% every quarter till the end of 2023. This will lead to loan growth of 12% for 2022 and 8% for 2023. Meanwhile, I’m expecting other balance sheet items to grow somewhat in line with loans. The following table shows my balance sheet estimates.
| FY18 | FY19 | FY20 | FY21 | FY22E | FY23E | |
| Financial Position | ||||||
| Net Loans | 2,176 | 2,365 | 2,566 | 2,641 | 2,953 | 3,197 |
| Growth of Net Loans | 12.6% | 8.7% | 8.5% | 2.9% | 11.8% | 8.2% |
| Other Earning Assets | 646 | 638 | 930 | 1,194 | 1,098 | 1,143 |
| Deposits | 2,346 | 2,616 | 3,235 | 3,550 | 3,871 | 4,190 |
| Borrowings and Sub-Debt | 354 | 231 | 88 | 70 | 50 | 52 |
| Common equity | 270 | 302 | 334 | 371 | 334 | 361 |
| Book Value Per Share ($) | 18.1 | 20.1 | 21.6 | 23.1 | 20.2 | 21.8 |
| Tangible BVPS ($) | 16.5 | 18.6 | 20.1 | 21.6 | 18.8 | 20.4 |
| Source: SEC Filings, Author’s Estimates (In USD million unless otherwise specified) | ||||||
Lagged Effect of Rate Hikes to Boost the Top Line in 2023
Arrow Financial’s net interest margin has expanded by 37 basis points in the first nine months of the year partly because the company has improved its asset mix by deploying the previously accumulated excess cash. The cash level has considerably declined from a year ago period; therefore, it no longer presents a big opportunity to boost the margin. The following chart shows the trend of interest-bearing deposits at other banks, which is a cash component.
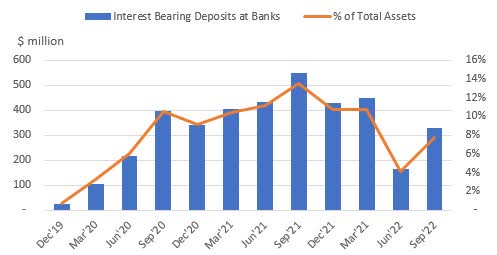
SEC Filings
Arrow Financial Corporation’s deposit book reprices frequently as it is heavy on interest-bearing checking and savings accounts. These accounts altogether made up 71% of total deposits at the end of September 2022, according to details given in the earnings release. On the other side of the balance sheet, loans are slower to reprice as most loans are based on real estate.
3Q 2022 Earnings Release
As Arrow Financial Corporation’s liabilities reprice faster than assets, the rate hikes will hurt the margin in the first year and then boost the margin in the second year of the rate hike. The results of the management’s interest-rate sensitivity analysis given in the second quarter’s 10-Q filing showed that a 200-basis points hike in interest rates could decrease the net interest income by 1.9% in the first year and increase it by 7.32% in the second year of the rate hike.
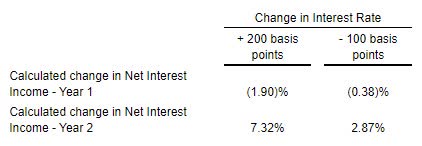
2Q 2022 10-Q Filing
Considering these factors, I’m expecting the margin to remain unchanged in the fourth quarter of 2022 and then rise by 15 basis points in 2023.
Upward Revision of Non-interest Expense Estimates Reduces My Earnings Estimate
Arrow Financial Corporation’s operating expenses jumped by 5.4% in the third quarter (22% annualized) following the 7.4% surge during the second quarter of 2022 (30% annualized). The growth in expenses was attributable to the conversion of Arrow’s core banking system as well as a performance bonus for the team. Going forward, the high inflation environment and the tight labor market will exert pressure on salary expenses, thereby keeping non-interest expenses at an elevated level. I’m expecting the efficiency ratio (operating expenses divided by total revenues) to rise to 55.6% in 2023 from 54.7% in 2021 and 54.5% in the first nine months of 2022. Compared to my last report on Arrow Financial, I have increased my non-interest expense estimates for both the fourth quarter of 2022 and the full year of 2023 because inflation has beaten my previous expectations.
Meanwhile, I’m expecting the provisioning to remain at roughly the same level as in the last five years. On the other hand, the anticipated loan growth and margin expansion discussed above will boost earnings through the end of 2023. Overall, I’m expecting Arrow Financial to report earnings of $3.00 per share for 2022 down 3% year-over-year. For 2023, I’m expecting earnings to grow by 10% to $3.30 per share. The following table shows my income statement estimates.
| FY18 | FY19 | FY20 | FY21 | FY22E | FY23E | |
| Income Statement | ||||||
| Net interest income | 84 | 88 | 99 | 110 | 120 | 136 |
| Provision for loan losses | 3 | 2 | 9 | 0 | 4 | 4 |
| Non-interest income | 29 | 29 | 33 | 32 | 32 | 32 |
| Non-interest expense | 65 | 67 | 71 | 78 | 83 | 93 |
| Net income – Common Sh. | 36 | 37 | 41 | 50 | 50 | 55 |
| EPS – Diluted ($) | 2.43 | 2.50 | 2.64 | 3.10 | 3.00 | 3.30 |
| Source: SEC Filings, Author’s Estimates (In USD million unless otherwise specified) | ||||||
In my last report on Arrow Financial, I estimated earnings of $3.00 per share for 2022 and $3.35 per share for 2023. I have tweaked all line items following the third quarter’s results, but my updated earnings estimate for 2022 is barely changed from my previous estimate. This is because the small changes in the line items cancel each other out. My updated earnings estimate for 2023 is slightly below my previous estimate as I’ve raised my non-interest expense estimate.
Actual earnings may differ materially from estimates because of the risks and uncertainties related to inflation, and consequently the timing and magnitude of interest rate hikes. Further, a stronger or longer-than-anticipated recession can increase the provisioning for expected loan losses beyond my estimates.
Upgrading to a Buy Rating
Arrow Financial is offering a dividend yield of 3.1% at the current quarterly dividend rate of $0.27 per share. The earnings and dividend estimates suggest a payout ratio of 33% for 2023, which is below the five-year average of 41%. Therefore, there is room for a dividend hike. Nevertheless, I’m not expecting any change in the dividend level as Arrow doesn’t change its dividend payout often.
I’m using the historical price-to-tangible book (“P/TB”) and price-to-earnings (“P/E”) multiples to value Arrow Financial. The stock has traded at an average P/TB ratio of 1.73 in the past, as shown below.
| FY18 | FY19 | FY20 | FY21 | Average | ||
| T. Book Value per Share ($) | 16.5 | 18.6 | 20.1 | 21.6 | ||
| Average Market Price ($) | 34.0 | 33.3 | 29.3 | 34.9 | ||
| Historical P/TB | 2.06x | 1.79x | 1.46x | 1.61x | 1.73x | |
| Source: Company Financials, Yahoo Finance, Author’s Estimates | ||||||
Multiplying the average P/TB multiple with the forecast tangible book value per share of $20.4 gives a target price of $35.3 for the end of 2023. This price target implies a 2.4% upside from the November 1 closing price. The following table shows the sensitivity of the target price to the P/TB ratio.
| P/TB Multiple | 1.53x | 1.63x | 1.73x | 1.83x | 1.93x |
| TBVPS – Dec 2023 ($) | 20.4 | 20.4 | 20.4 | 20.4 | 20.4 |
| Target Price ($) | 31.2 | 33.3 | 35.3 | 37.3 | 39.4 |
| Market Price ($) | 34.5 | 34.5 | 34.5 | 34.5 | 34.5 |
| Upside/(Downside) | (9.4)% | (3.5)% | 2.4% | 8.3% | 14.3% |
| Source: Author’s Estimates |
The stock has traded at an average P/E ratio of around 12.4x in the past, as shown below.
| FY18 | FY19 | FY20 | FY21 | Average | ||
| Earnings per Share ($) | 2.43 | 2.50 | 2.64 | 3.10 | ||
| Average Market Price ($) | 34.0 | 33.3 | 29.3 | 34.9 | ||
| Historical P/E | 14.0x | 13.3x | 11.1x | 11.3x | 12.4x | |
| Source: Company Financials, Yahoo Finance, Author’s Estimates | ||||||
Multiplying the average P/E multiple with the forecast earnings per share of $3.30 gives a target price of $41.0 for the end of 2023. This price target implies a 19.0% upside from the November 1 closing price. The following table shows the sensitivity of the target price to the P/E ratio.
| P/E Multiple | 10.4x | 11.4x | 12.4x | 13.4x | 14.4x |
| EPS 2023 ($) | 3.30 | 3.30 | 3.30 | 3.30 | 3.30 |
| Target Price ($) | 34.4 | 37.7 | 41.0 | 44.3 | 47.6 |
| Market Price ($) | 34.5 | 34.5 | 34.5 | 34.5 | 34.5 |
| Upside/(Downside) | (0.2)% | 9.4% | 19.0% | 28.6% | 38.2% |
| Source: Author’s Estimates |
Equally weighting the target prices from the two valuation methods gives a combined target price of $38.1, which implies a 10.7% upside from the current market price. Adding the forward dividend yield gives a total expected return of 13.8%. In my last report, I adopted a hold rating with a target price of $37.4 for December 2022. Based on the new target price for 2023 and the dividend estimate, I’m upgrading Arrow Financial Corporation to a buy rating.
Be the first to comment