


Davel5957
Thesis: Diversified Property Developer On Discount
Interest rates go up, REITs go down. That’s the name of the game.
Hence we find that publicly traded landlords and diversified property developers like Armada Hoffler Properties (NYSE:AHH) have been driven lower in recent weeks in the face of the Federal Reserve’s stalwart drive to rid the economy of inflation.
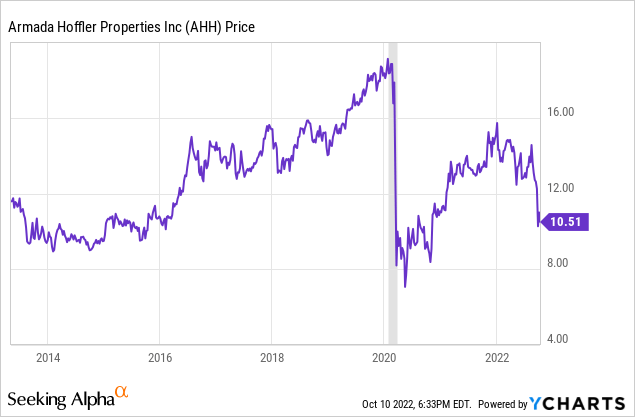
As you can see, AHH is now priced at pandemic-era levels, a price not seen prior to COVID-19 since early 2016.
Does AHH deserve to have shed a third of its price since the beginning of the year? I think not.
My thesis is simple: While AHH does face a headwind from rising interest rates, the REIT’s solid rent growth more than offsets this. That makes the selloff unwarranted.
Specifically, the degree to which AHH has sold off is unwarranted, given that the REIT has shown an ability to raise rental revenue as interest rates rise.
Against 2022 normalized FFO per share guidance of $1.18 at the midpoint, AHH currently trades at a price-to-FFO multiple of 8.9x. Measured against my estimate of 2022 AFFO per share of $0.95, AHH is still quite cheap at an 11.1x multiple.
I think AHH easily has 50% upside from its current stock price, not including its well-covered 7.2%-yielding dividend.
Midyear Update On Armada Hoffler
In the first half of 2022, AHH’s normalized FFO per share rose 7.4% year-over-year. Adjusted FFO per share, however, only rose 2.2% YoY in 1H 2022, primarily because of above-average capex, tenant improvement expenses, and leasing commissions.
Seeing AFFO below FFO for this reason is usually a good sign, because it indicates a lot of leasing is going on. Preferably, this is leasing of previously vacant space that thus raises occupancy and pays for itself over the course of the lease.
Indeed, we have seen portfolio-wide occupancy on an upward trend over the past four quarters, from 96.4% in Q3 2021 to 96.7% in Q4 2021 to 97.1% in Q1 2022 to 97.3% in Q2. And this strength is roughly equal across AHH’s three major property type segments:
| % of Q2 2022 NOI | Occupancy | |
| Retail | 43% | 97.1% |
| Office | 32% | 97.9% |
| Multifamily | 25% | 97.2% |
Here’s a more detailed breakdown of each property type segment:

AHH Q2 Supplemental
You can see that a few of the REIT’s big, mixed-use properties, namely the Town Center of Virginia Beach and Harbor Point Baltimore Waterfront, have an outsized effect on overall performance. These properties were developed by AHH, so management knows them inside and out.
Take the Town Center of Virginia Beach, for instance. This is a huge complex made up of 14 separate property parcels with over 150 commercial tenants plus 750 apartment units. It is also the location of Armada Hoffler’s corporate headquarters.

Armada Hoffler
Though the market doesn’t seem to like AHH’s office exposure, it’s useful to note that not only is occupancy quite high but leasing spreads have turned progressively positive in recent quarters. Signed renewal leases, for instance, went from -13.5% cash lease-over-lease spreads and -5% straight-line spreads in Q3 2021 to 3% cash and 13.1% straight-line in Q2 2022. That double-digit straight-line number in the second quarter indicates that AHH has been able to include substantial rent escalations in its recently signed lease renewals.
Indeed, cash net operating income growth remains strong as of the second quarter. Here’s AHH’s same-store cash NOI growth by segment in Q2 2022:
- Retail: 7.5%
- Office: 2.5%
- Multifamily: 12.5%
- Overall: 7.4%
Office is, predictably, the weakest segment for rent growth, since work-from-home has significantly diminished overall demand for office space, but retail and multifamily are making up for office’s sluggishness with strong growth.
Shifting gears, one reason the market never values AHH all that richly, in addition to the fact that diversified portfolios are usually valued at a discount to the sum of their parts, is that AHH has disposed of about as much property value as the combined total of its acquisitions and developments in recent years.
| Acquisition Value | Acquisition Cap Rate | Disposition Value | Disposition Cap Rate | |
| 1H 2022 | $273m | 6.1% | $258.3m | 4.3% |
| 2021 | $64.9m | 6.9% | $90.3m | 5.2% |
| 2020 | $25.7m | 6.8% | $97.3m | 7.7% |
There are two pieces of good news that we can find in the above data, though.
First, in the last year and a half, AHH has disposed of properties at significantly lower cap rates than it has acquired properties. That implies accretive capital recycling.
Second, this year, the value of AHH’s acquisitions (plus completed development projects) finally outweighs dispositions. And the REIT plans to acquire more grocery-anchored retail shopping centers to its portfolio this year.
AHH is paying out about 80-82% of AFFO, leaving about $15 million in FCF after dividends for the year. That will go about halfway toward AHH’s goal of acquiring $25 million to $35 million of grocery-anchored retail properties in the second half of this year. The remainder will likely be financed with dispositions, cash on hand, or some form of debt.
Speaking of debt, let’s turn to the balance sheet.
Balance Sheet
In the midst of rising interest rates, a company’s debt profile has become a more important factor than it has been anytime in recent history.
When it comes to AHH’s debt, there are a couple ways to measure it.
The stabilized portfolio debt to EBITDA ratio sits at 5.5x. This is probably the most useful way to measure AHH’s leverage, because it only takes the corporate-level unsecured debt and asset-secured debt related to stabilized properties that can fund debt service and principal payments.
AHH also has a fair amount of debt associated with development projects that are not yet completed and paying rent. The net debt (including for development projects) to EBITDA ratio is higher at 7.2x. But it is very common to partially fund construction projects with short-term loans, so this relatively high net leverage ratio should not be too alarming.
What would be alarming to see, however, would be a lot of debt maturing in the next few years.
Here, we find that AHH does have a moderate amount of loans and interest rate cap agreements maturing in the next few years. For the most part, AHH’s debt is well-laddered, but there are a few notable maturities coming up.
For example, notice below that a few interest rate cap agreements that are presently keeping their associated rates below 3% will be maturing in February and April of next year. For the $100m tranche, the new rate will jump more than two points to about 5.5%, as of today’s LIBOR rate.

AHH Q2 Supplemental
Fortunately, AHH has no unsecured debt maturing until January 2024. Unfortunately, the vast majority of AHH’s debt is secured, and the REIT has a few of these mortgages maturing in the second half of 2022 and throughout 2023.
It will be interesting to see how AHH handles the rollover of these loans and what new terms will be secured on the refinanced mortgages. If the worst is simply to see mortgage rates go from a 3-handle to a 5-handle, then AHH should survive just fine, albeit with a predictable rise in interest expenses.
Admittedly, AHH does not have the debt maturity schedule one would want to see in the midst of rising interest rates, which plays a big part in the REIT’s selloff as of late.
If rates on new mortgage loans are high enough, AHH may abandon or postpone its planned grocery-anchored retail acquisitions and devote its free cash instead to debt paydown.
The High-Yielding Preferred Stock
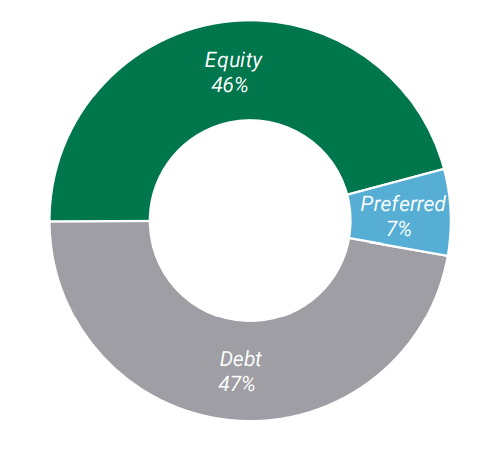
An option for those who may be interested in a lower risk, lower upside, higher income investment is the Series A cumulative preferred equity (AHH.PA), which yields 6.75% at par but now offers a current yield of 7.8% after a selloff. On top of that, a price of $21.55 as of this writing gives AHH.PA upside to its $25 redemption value of 16%.
This preferred stock represents only 7% of AHH’s total capitalization, which means that the preferred dividend accounts for a relatively small percentage of the REIT’s cash flows.
AHH Q2 Supplemental
Interestingly, two members of AHH’s board of directors recently purchased 9,000 shares of AHH.PA between them at a price of around $22.35 per share.
Personally, I am inclined to follow their lead in buying AHH.PA instead of AHH, for now. Interest rates increase the risk to the common dividend, which yields 7.2%, while the preferred dividend’s 7.8% yield looks much safer in comparison. However, my calculus could change if AHH drops to a sufficient degree.
Bottom Line
AHH is cheap. Yes, it is cheap for a pretty good reason (incremental refinancing risk in the coming years), but it has strengths that offset the headwinds. Rent growth is strong, which should make increased interest expenses somewhat of a wash.
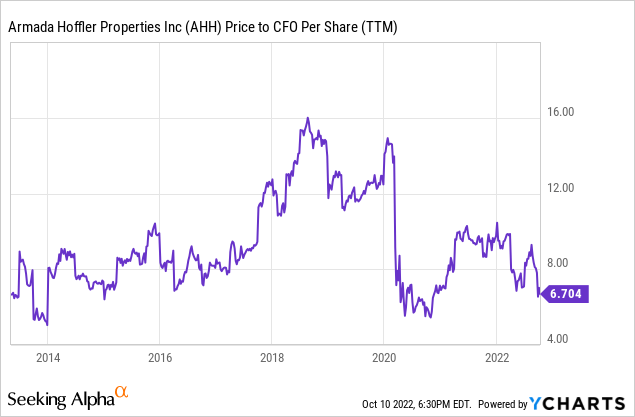
Meanwhile, AHH is near its cheapest level as measured against cash flows at any time in the REIT’s publicly traded history. It was only cheaper than now during the pandemic, when lockdowns forced over half of its real estate portfolio to remain closed to the public.
Though I currently prefer AHH.PA for its higher yield and safer payout, AHH has become quite interesting in itself, and it is far more interesting for the risk-tolerant investor looking for a high upside play in mixed-use real estate.
Be the first to comment