

Thinkhubstudio
|
ARIEL INTERNATIONAL (DM) COMPOSITE PERFORMANCE |
As of September 30, 2022 |
||||||
|
Inception date: December 31, 2011 |
Annualized |
||||||
|
3Q22 |
Year to Date |
1 Year |
3 Years |
5 Years |
10 Years |
Since Inception |
|
|
Gross of Fees |
-13.72% |
-21.61% |
-18.81% |
-2.00% |
-1.23% |
4.53% |
4.24% |
|
Net of Fees |
-13.89% |
-22.08% |
-19.45% |
-2.78% |
-2.01% |
3.69% |
3.39% |
|
MSCI EAFE Net Index |
-9.36% |
-27.09% |
-25.13% |
-1.83% |
-0.84% |
3.67% |
4.34% |
|
MSCI EAFE Value Net Index |
-10.21% |
-21.08% |
-20.16% |
-2.79% |
-2.74% |
2.39% |
3.10% |
|
ARIEL INTERNATIONAL (DM/EM) COMPOSITE PERFORMANCE |
As of September 30, 2022 |
||||||
|
Inception date: December 31, 2011 |
Annualized |
||||||
|
3Q22 |
Year to Date |
1 Year |
3 Years |
5 Years |
10 Years |
Since Inception |
|
|
Gross of Fees |
-12.33% |
-18.27% |
-15.14% |
-0.70% |
-0.33% |
5.28% |
4.89% |
|
Net of Fees |
-12.50% |
-18.76% |
-15.82% |
-1.49% |
-1.11% |
4.41% |
4.02% |
|
MSCI ACWI ex-US |
-9.91% |
-26.50% |
-25.17% |
-1.52% |
-0.81% |
3.01% |
3.74% |
|
MSCI ACWI ex-US Value Net Index |
-10.44% |
-21.00% |
-20.02% |
-2.15% |
-2.12% |
1.87% |
2.64% |
|
ARIEL GLOBAL COMPOSITE PERFORMANCE |
As of September 30, 2022 |
||||||
|
Inception date: December 31, 2011 |
Annualized |
||||||
|
3Q22 |
Year to Date |
1 Year |
3 Years |
5 Years |
10 Years |
Since Inception |
|
|
Gross of Fees |
-9.67% |
-13.73% |
-8.75% |
4.24% |
3.84% |
8.28% |
8.10% |
|
Net of Fees |
-9.85% |
-14.24% |
-9.47% |
3.42% |
3.02% |
7.39% |
7.20% |
|
MSCI ACWI Index |
-6.82% |
-25.63% |
-20.66% |
3.75% |
4.44% |
7.28% |
7.97% |
|
MSCI ACWI Value Net Index |
-7.66% |
-19.05% |
-13.97% |
1.27% |
1.71% |
5.39% |
6.08% |
|
ARIEL GLOBAL CONCENTRATED COMPOSITE PERFORMANCE |
As of September 30, 2022 |
||||||
|
Inception date: December 31, 2019 |
Annualized |
||||||
|
3Q22 |
Year to Date |
1 Year |
Since Inception |
||||
|
Gross of Fees |
-10.90% |
-14.29% |
-9.43% |
0.53% |
|||
|
Net of Fees |
-11.08% |
-14.80% |
-10.14% |
-0.27% |
|||
|
MSCI ACWI Index |
-6.82% |
-25.63% |
-20.66% |
0.90% |
|||
|
MSCI ACWI Value Net Index |
-7.66% |
-19.05% |
-13.97% |
-1.29% |
|||
Global equities suffered their third consecutive quarter of losses this year as investors wrestled with tightening monetary policies, inflation and a looming recession. The MSCI ACWI Index declined -6.82%, while the MSCI EAFE and MSCI ACWI ex U.S. indices dropped -9.36% and -9.91%, respectively. Ariel’s international and global portfolios underperformed during the three-month period largely due to a risk-on rally in July and early August. Conversely, year-to-date, our strategies mostly outperformed their core and value indices.
Despite record declines in the first half of 2022, we believe a more significant market correction still lies ahead. However, our investment process and philosophy remain consistent. We believe our concentrated strategies are designed to generate compelling risk-adjusted returns over the long run, and owning undervalued, high dividend yielding, quality companies with strong balance sheets positions us well for long-term outperformance.
As discussed in prior letters, we are experiencing the effects of a regime change from quantitative easing (QE) to quantitative tightening (QT).[1] As a result, we anticipate junk bonds and junk equities will face the greatest challenges. In our first quarter letter, we explained junk equities by introducing the four Ls—Lofty valuations, Leverage, Lossmaking companies and Liquidity risk. In our second quarter letter, we highlighted Leverage and its risk to all equity investors. This quarter, we will focus on the consequences of “Lofty valuations and expectations.”
From Goldilocks to Stagflation
In our view, the Goldilocks era has ended—a period where growth was perceived as neither too fast nor too slow, but “just right.” Since the 2008 Financial Crisis, we have lived through a decade and a half of record-breaking QE. Massive monetary accommodation, further amplified by COVID-19-related stimulus, drove high multiples for U.S. stocks and an explosion in values for speculative assets.[2] The Goldilocks years were an ideal environment for risk taking investors. However, as the saying goes, “nothing lasts forever.” The U.S. Federal Reserve, European Central Bank and other major central banks have shifted from protecting Wall Street with QE, to defending Main Street from inflation with QT. As interest rate hikes and contractionary policies continue, we will likely see a larger reckoning unfold in the markets—exposing the bad bets of the prior regime.
Global growth is expected to decline from 5.7% in 2021, to 2.9% in 2022—much lower than The World Bank’s projections in January.[3] Meanwhile, inflation levels remain elevated at multi-year highs. Against this backdrop, the world is at risk of severe stagflation—a phenomenon whereby growth is slow and inflation is high—reminiscent of the 1970s. Recovery from the last stagflation slump required tightening policies, which led to a global recession. The actions triggered large stock market declines and substantial debt crises in developed and emerging economies in the early 1980s.[4] We would not be surprised if similar outcomes play out—particularly in the U.S.
Lofty Valuations and Expectations
U.S. equity investors should be concerned about market valuations. Notwithstanding large declines this year, U.S. stocks continue to trade at historically elevated levels. For the last ten years, the U.S. has been the best-performing market.[5] We believe these stocks are at much greater risk of a deep and prolonged market correction as part of a wide-ranging pricing reset across asset classes. As a result, we are underweight U.S. equities, and believe there are more attractive opportunities in Europe and Emerging Markets.
In our view, the consensus outlook for earnings and fixed-income expectations are ambitious. Economic history has taught us that corporate profits decline significantly during cyclical downturns. Since 1960, the average peak-totrough earnings drop is about 31%.[6] However, we have only seen a 4% decrease in earnings estimates year-to-date,[7] and Wall Street analysts still expect 2023 earnings to outperform 2022. We believe it is more likely that 2023 earnings will be largely below 2022 once negative estimate revisions unfold over the next year.
We also see a similar mismatch in the fixed-income landscape. During most of 2020 and 2021, U.S. Federal Funds rates stood at 0%. While those rates have risen to over 3% today, Fed expectations currently sit at 4.6%–far too low relative to inflation. Figure 1 illustrates Fed Funds (blue line) relative to core inflation (red line) in the past. Since the 1950s, Fed Funds have almost always been raised at least 200-500 basis points above core inflation to address spiraling prices. As such, we believe the expected 4.6% peak Fed Funds rate is nowhere near the level of positive real rates historically required to extinguish our high and accelerating inflation. Interest rate expectations across the fixed income market likely remain too low as earnings expectations for stocks look too high.
Figure 1: U.S. Federal Funds Effective Rate vs. Core Consumer Price Inflation Rate
Figure 1: U.S. Federal Funds Effective Rate vs. Core Consumer Price Inflation Rate (Source: FRED Economic Data Federal Funds Effective Rate)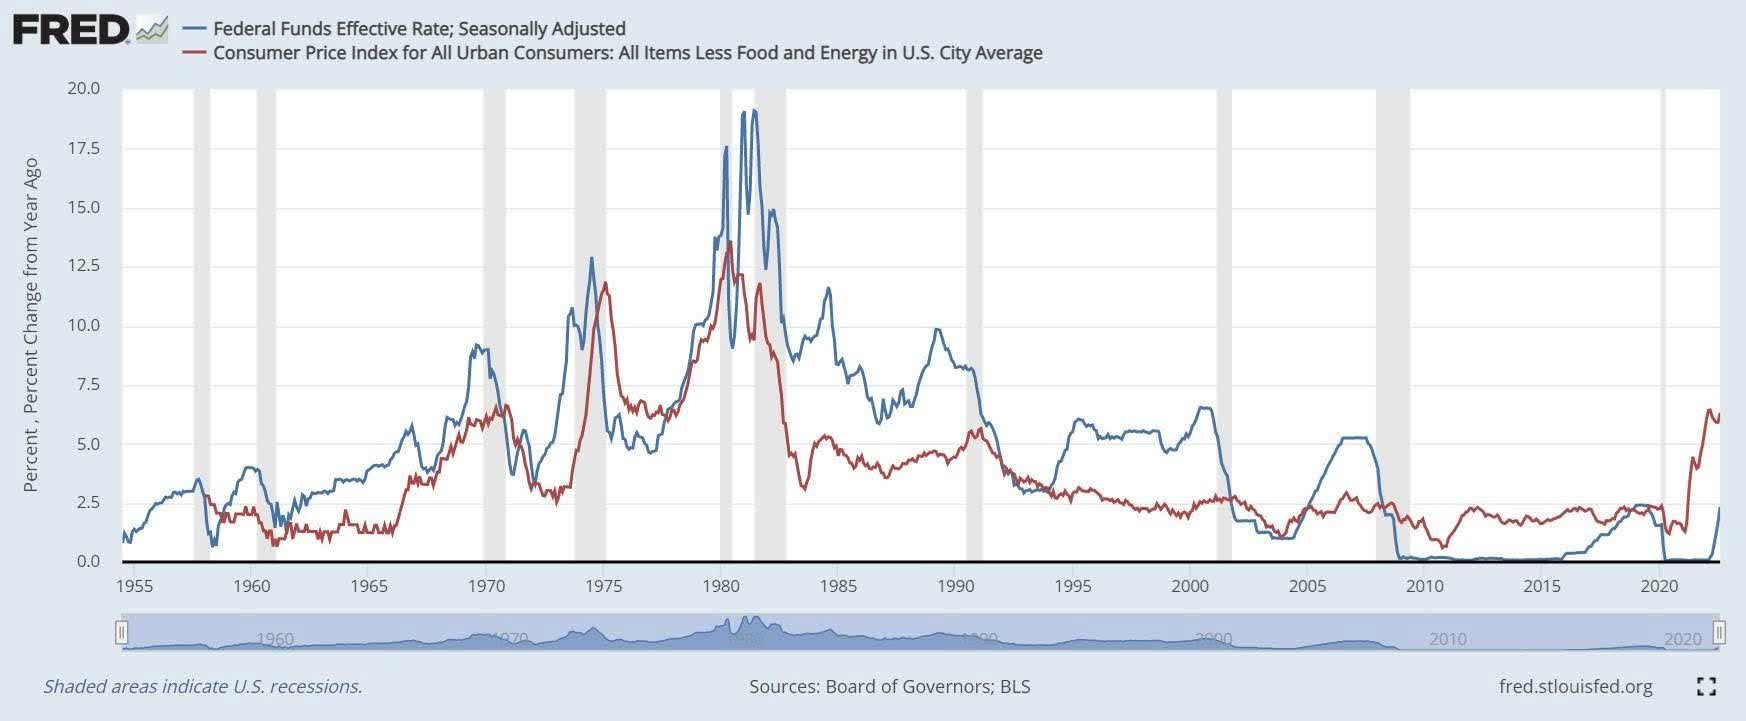
Finding Value in Europe and Emerging Markets
We believe European markets have much more attractive risk/reward dynamics today. While we still see valuation risk, we have identified more companies trading with a larger margin of safety.[8] On a relative basis, European businesses sell at some of the most inexpensive valuation levels versus the U.S. in more than a half-century. We believe the Russia-Ukraine war and other geopolitical and commodity concerns are mostly priced in. As contrarian investors, we see opportunities in the volatility. The energy crisis in Europe is acute but mainly impacts the manufacturing sector. Health Care names such as GlaxoSmithKline plc, Novartis AG, Roche Holding AG and Sanofi S.A. are stable businesses with strong research and development pipelines and reliable dividends. Healthcare is less energy-intensive than the auto, chemical or aluminum industries. In our view, high dividend yielding European companies in less cyclical sectors such as Health Care, Communications, Consumer Staples and Utilities with strong balance sheets will be resilient in a challenging global macroeconomic environment.
We are bullish on emerging market (EM) opportunities, particularly in Latin America. When we launched Ariel’s international and global strategies in 2011, we were negative on the EM landscape. At that time, many investors poured into EM stocks with high growth expectations, which we believed would disappoint and cause valuations to deflate. This has now happened.[9] After a decade of disappointment, we believe Latin American stocks look particularly attractive, and we have been allocating more capital in Brazil, Peru and Chile.
The Road Ahead: From Passive to Active
Benjamin Graham once said, “In the short run, the market is a voting machine but in the long run, it is a weighing machine.” The pendulum is swinging on multiple fronts—from QE to QT, Goldilocks to Stagflation, and Wall Street to Main Street. Therefore, we believe outperformance in the next decade is unlikely to come from a passive, growth momentum approach. In our view, active, value-oriented strategies are more likely to shine. This plays to the strengths of our investment process. While the current market environment is volatile and uncertain, we believe our portfolios are positioned to weather the storm—as they are heavily weighted toward undervalued, high dividend yielding companies with low operating and financial leverage.
We appreciate the opportunity to serve you and welcome any questions you might have.
|
Investments in foreign securities may underperform and may be more volatile than comparable U.S. stocks because of the risks involving foreign economies and markets, foreign political systems, foreign regulatory standards, and foreign currencies and taxes. The use of currency derivatives, exchange-traded funds ((ETFs)) and other hedges may increase investment losses and expenses and create more volatility. Investments in emerging markets present additional risks, such as difficulties in selling on a timely basis and at an acceptable price. The intrinsic value of the stocks in which the portfolios invest may never be recognized by the broader market. The portfolios are often concentrated in fewer sectors than their benchmarks, and their performance may suffer if these sectors underperform the overall stock market. Investing in equity stocks is risky and subject to the volatility of the markets. Past performance does not guarantee future results. Performance results are net of transaction costs and reflect the reinvestment of dividends and other earnings. Net performance of each Composite has been reduced by the amount of the highest fee charged to any client in each Composite during the performance period. Actual fees may vary depending on, among other things, the applicable fee schedule and portfolio size. A complete fee schedule is available upon request and may also be found in Ariel Investments LLC’s Form ADV, Part 2. Returns are expressed in U.S. dollars. Current performance may be lower or higher than the performance data quoted. The Ariel International (DM) Composite differs from its benchmark, the MSCI EAFE Index, because: (i) the Composite has fewer holdings than the benchmark, (ii) the Composite will invest in Canada, and (iii) the Composite will at times invest a portion of its assets in the U.S. and emerging markets. The Ariel International (DM/EM) Composite differs from its benchmark, the MSCI ACWI (All Country World Index) ex-US, because: (i) the Composite has fewer holdings than the benchmark and (ii) the Composite will at times invest a portion of its assets in the U.S. The Ariel Global Composite differs from its benchmark, the MSCI ACWI (All Country World Index), because the Composite has fewer holdings than the benchmark. The Ariel Global Concentrated Composite differs from its benchmark, the MSCI ACWI (All Country World Index), because the Composite has dramatically fewer holdings than the benchmark. The opinions expressed are current as of the date of this commentary but are subject to change. The information provided in this commentary does not provide information reasonably sufficient upon which to base an investment decision and should not be considered a recommendation to purchase or sell any particular security. As of 9/30/22, the Ariel International (DM) Composite (representative portfolio) held the following positions referenced: Roche Holding AG 8.36%; GlaxoSmithKline plc 5.07%; Sanofi S.A. 2.06%; Novartis AG 0.97% and Novartis AG ADR 0.09%. As of 9/30/22, the Ariel International (DM/EM) Composite (representative portfolio) held the following positions referenced: Roche Holding AG 8.40%; GlaxoSmithKline plc 4.81%; Sanofi S.A. 1.80% and Novartis AG 0.57%. As of 9/30/22, the Ariel Global Composite (representative portfolio) held the following positions referenced: Roche Holding AG 6.76%; GlaxoSmithKline plc 4.47%; Sanofi S.A. 1.28% and Novartis AG 0.40%. As of 9/30/22, the Ariel Global Concentrated Composite (representative portfolio) held the following positions referenced: GlaxoSmithKline plc ADR 6.19%; Roche Holding AG ADR 3.97% and Sanofi S.A. ADR 0.50%. Portfolio holdings are subject to change. Each strategy’s primary index is the first one listed below each respective strategy’s performance data. Indexes are unmanaged. Investors cannot invest directly in an index. The MSCI EAFE® Index is an equity index of large and mid-cap representation across 21 Developed Markets (DM) countries around the world, excluding the U.S. and Canada. It’s inception date is May 31, 1986. The MSCI EAFE Value Index captures large and mid-cap securities exhibiting overall value style characteristics across Developed Markets countries around the world, excluding the US and Canada. Its inception date is December 8, 1997. The MSCI ACWI (All Country World Index) ex-US Index is an index of large and mid-cap representation across 22 Developed Markets (DM) and 24 Emerging Markets (EM) countries. Its inception date is January 1, 2001. The MSCI ACWI ex-US Value Index captures large and mid-cap securities exhibiting overall value style characteristics across 22 Developed and 24 Emerging Markets countries. Its inception date is December 8, 1997. All MSCI Index net returns reflect the reinvestment of income and other earnings, including the dividends net of the maximum withholding tax applicable to non-resident institutional investors that do not benefit from double taxation treaties. MSCI uses the maximum tax rate applicable to institutional investors, as determined by the companies country of incorporation. MSCI makes no express or implied warranties or representations and shall have no liability whatsoever with respect to any MSCI data contained herein. The MSCI data may not be further redistributed or used to create indices or financial products. This report is not approved or produced by MSCI. |
Footnotes[1] Quantitative easing refers to policies that substantially expand the size of the Fed’s balance sheet. Quantitative tightening refers to the opposite—policies that reduce the size of the Fed’s balance sheet. Source: Federal Reserve Bank of St. Louis [2] Speculative assets refer to Junk Bonds, SPACS, Cryptocurrency, Corporate Debt and Real Estate. [3] World Bank, “Stagflation Risk Rises Amid Sharp Slowdown in Growth,” June 7, 2022, Accessed October 7, 2022, Global Economic Prospects June 2022 [4] World Bank, “Global Economic Prospects June 2022,” June 22, 2022, https://www.worldbank.org/en/news/press-release/2022/06/07/stagflation-risk-rises-amid-sharp-slowdown-in-growth-energy-markets. [5] Lazard Asset Management, “Can US Stocks Continue to Outperform?,” Accessed October 16, 2022, https://www.lazardassetmanagement.com/us/en_us/research-insights/the-current/the-great-rotation/can-us-stocks-continue-to-outperform. [6] Jonathan Levin, “Stocks Are Courting a Nasty Surprise on Corporate Earnings,” Bloomberg.com, September 19, 2022, Accessed October 16,2022. https://www.bloomberg.com/opinion/articles/2022-09-19/stocks-are-courting-a-nasty-surprise-on-corporate-earnings. [7] Peter Eavis and Joe Reninson, “Wall Street Braces for an Earnings Season of Mixed Signals,” The New York Times, October 12, 2022, Accessed October 16, 2022. Wall Street Braces for an Earnings Season of Mixed Signals. [8] Attempting to purchase a stock with a margin of safety does not protect investors from the loss of their investment, volatility associated with stocks, declining fundamentals, external forces, or our incorrect assumptions. [9] Abhishek Vishnoi, “Emerging Stocks Haven’t Had Such a Long Stretch Since Cycle Peak,” Bloomberg.com, October 3, 2022), AccessedOctober 16, 2022. https://www.bloomberg.com/news/articles/2022-10-04/emerging-stocks-haven-t-had-such-a-long-stretch-of-bear-market?leadSource=uverify%20wall |
Editor’s Note: The summary bullets for this article were chosen by Seeking Alpha editors.
Be the first to comment