


zbruch/iStock via Getty Images
Focus of Article:
The focus of this two-part article is a very detailed analysis comparing Ares Capital Corp. (NASDAQ:ARCC) to some of the company’s business development company (“BDC”) peers (all sector peers I currently fully cover). I am writing this two-part article due to the continued requests that such an analysis be specifically performed on ARCC and some of the company’s BDC peers at periodic intervals. For readers who just want the summarized conclusions/results, I would suggest to scroll down to the “Conclusions Drawn” section at the bottom of each part of the article.
PART 1 of this article analyzed ARCC’s recent quarterly results and compared several of the company’s metrics to 15 BDC peers. PART 1 helps lead to a better understanding of the topics and analysis that will be discussed in PART 2. The link to PART 1’s analysis is provided below:
PART 2 of this article compares ARCC’s recent dividend per share rates, yield percentages, and several other highly unique dividend sustainability metrics to 15 BDC peers. This analysis will show recent past data with supporting documentation within Table 3 below. This article will also project ARCC’s dividend sustainability for the calendar second and third quarters of 2022 which is partially based on the metrics shown in Table 3 and several additional metrics shown in Table 4 below.
By analyzing these metrics, one will better understand which BDC generally has a safer dividend rate going forward versus other peers who have a higher risk for a dividend decrease or a higher probability of a dividend increase and/or a special periodic dividend being declared. This is not the only data that should be examined to initiate a position within a particular stock/sector or project future dividend per share rates. However, I believe this analysis would be a good “starting-point” to begin a discussion on the topic. At the end of this article, there will be a conclusion regarding various comparisons between ARCC and the 15 BDC peers. In addition, I will provide my current BUY, SELL, or HOLD recommendation and price target on ARCC. I will also include my ARCC dividend sustainability projection for the calendar second and third quarters of 2022. Dividend projections for the calendar second quarter of 2022 (or next set of dividend declarations) for the other 15 BDC peers are exclusive to subscribers of the REIT Forum.
Side Note: As of 3/23/2022, Apollo Investment Corp. (AINV), ARCC, FS KKR Capital Corp. (FSK), Gladstone Investment Corp. (GAIN), Golub Capital BDC Inc. (GBDC), NEWTEK Business Services Corp. (NEWT), Oaktree Specialty Lending Corp. (OCSL), PennantPark Floating Rate Capital Ltd. (PFLT), SLR Investment Corp. (SLRC), SLR Senior Investment Corp. (SUNS), Blackrock (BLK) TCP Capital Corp. (TCPC), TriplePoint Venture Growth BDC Corp. (TPVG), and Sixth Street Specialty Lending Inc. (TSLX) had a stock price that “reset” lower regarding each company’s regular quarterly dividend accrual. In other words, this company’s “ex-dividend date” has occurred. In addition, AINV, ARCC, GAIN, Main Street Capital Corp. (MAIN), and TSLX had a stock price that reset lower regarding each company’s special periodic dividend accrual. MAIN, Owl Rock Capital Corp. (ORCC), and Prospect Capital Corp. (PSEC) had a stock price that has not reset lower regarding each company’s regular March 2022 monthly/quarterly dividend accrual. Readers should take this into consideration as the analysis is presented below.
It should also be noted FSK implemented a 1:4 reverse stock split on 6/16/2020. As such, for every 4 shares of FSK owned, a shareholder now has 1 share of FSK stock after this event occurred. When it comes to FSK’s impacted metrics, all changes were incorporated starting on 7/1/2020 when it comes to my tables, models, and spreadsheets (start of the calendar third quarter of 2020).
Dividend Per Share Rates and Yield Percentages Analysis – Overview:
Let us start this analysis by first getting accustomed to the information provided in Table 3 below. This will be beneficial when comparing ARCC to the 15 BDC peers regarding quarterly dividend per share rates and yield percentages.
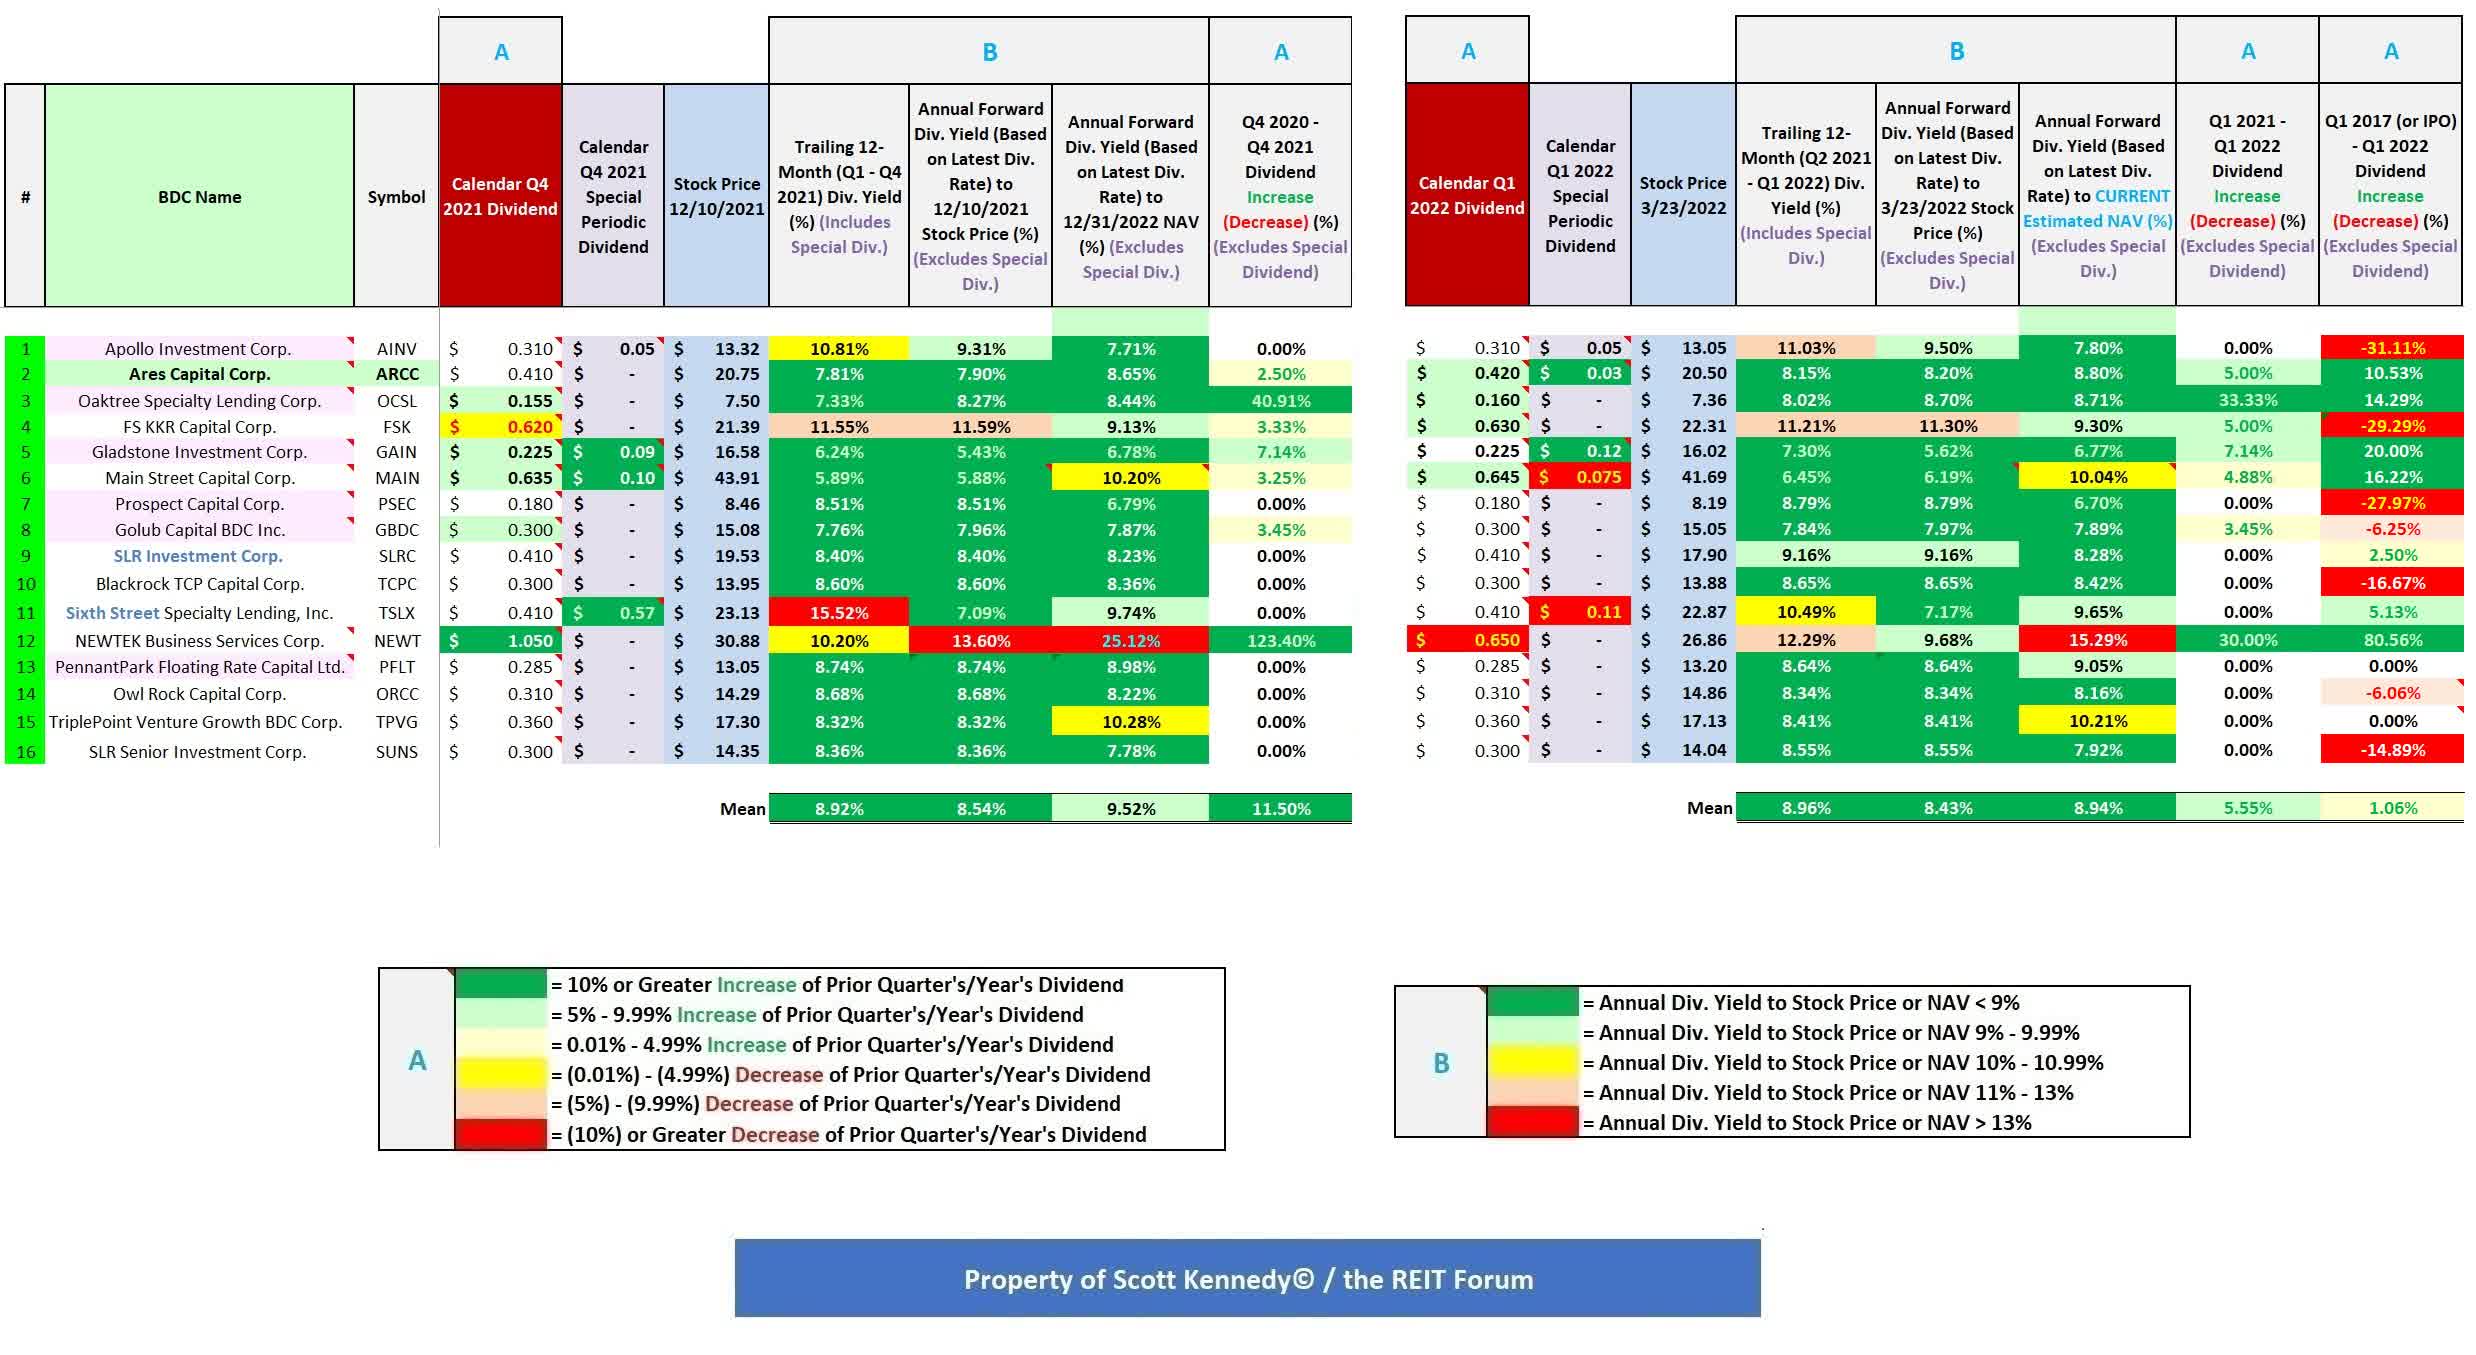
Table 3 – Dividend Per Share Rates and Yield Percentages
The REIT Forum
(Source: Table created entirely by myself, obtaining historical stock prices from NASDAQ and each company’s dividend per share rates from the SEC’s EDGAR Database)
Using Table 3 above as a reference, the following information is presented in regards to ARCC and 15 BDC peers (see each corresponding column): 1) dividend per share rate for the calendar fourth quarter of 2021 (including any special periodic dividend); 2) stock price as of 12/10/2021; 3) trailing 12-month (“TTM”) dividend yield (dividend per share rate from the calendar first-fourth quarter of 2021 [includes all special periodic dividends]); 4) annual forward dividend yield based on the dividend per share rate for the calendar fourth quarter of 2021 using the stock price as of 12/10/2021 (for monthly dividend payers, the latest monthly dividend per share rate during the quarter); 5) annual forward dividend yield based on the dividend per share rate for the calendar fourth quarter of 2021 using the NAV as of 12/31/2021 (for monthly dividend payers, the latest monthly dividend per share rate during the quarter); 6) TTM dividend increase (decrease) percentage (for monthly dividend payers, dividend per share rate fluctuation from December 2020-December 2021); 7) dividend per share rate for the calendar first quarter of 2022 (including any special periodic dividend); 8) stock price as of 3/23/2022; 9) TTM dividend yield (dividend per share rate from the calendar second quarter of 2021-first quarter of 2022 [includes all special periodic dividends]); 10) annual forward dividend yield based on the dividend per share rate for the calendar first quarter of 2022 using the stock price as of 3/23/2022 (for monthly dividend payers, the latest monthly dividend per share rate during the quarter); 11) annual forward dividend yield based on the dividend per share rate for the calendar first quarter of 2022 using my projected CURRENT NAV (NAV as of 3/18/2022; for monthly dividend payers, the latest monthly dividend per share rate during the quarter); 12) TTM dividend increase (decrease) percentage (for monthly dividend payers, dividend per share rate fluctuation from March 2021-March 2022);and 13) 5-year dividend increase (decrease) percentage (for monthly dividend payers, dividend per share rate fluctuation from March 2017-March 2022). Let us now begin the comparative analysis between ARCC and the 15 BDC peers.
Analysis of ARCC:
Using Table 3 above as a reference, ARCC declared a dividend of $0.41 per share for the fourth quarter of 2021. This amount was unchanged when compared to the prior quarter. ARCC’s stock price traded at $20.75 per share on 12/10/2021. When calculated, this was a TTM dividend yield (including special periodic dividends when applicable) of 7.81%, an annual forward yield to ARCC’s stock price as of 12/10/2021 of 7.90%, and an annual forward yield to the company’s NAV as of 12/31/2021 of 8.65%. When comparing each yield percentage to ARCC’s BDC peers within this analysis, the company’s TTM yield based on its stock price as of 12/10/2021 was modestly (at or great than 1.00% but less than 2.00%) below average while its annual forward yield based on its stock price as of 12/10/2021 and annual forward yield to its NAV as of 12/31/2021 were slightly (at or greater than 0.50% but less than 1.00%) below average.
When combining this type of data with various other analytical metrics, I correctly projected ARCC had a very high (90%) probability of a stable-slightly increasing dividend per share rate for the first quarter of 2022 (which ultimately came to fruition; along with a minor quarterly $0.03 per share special periodic dividend throughout 2022).
To provide readers several additional, important metrics to consider regarding each BDC’s dividend sustainability, Table 4 is provided below. Again, it should be noted there are additional dividend sustainability metrics that I perform for each company. However, those metrics are more elaborate in detail and require additional analysis/discussion which I believe is beyond the scope of this particular article. That type of analysis would be better suited when analyzing each company on a “standalone” basis versus a sector comparison article. I have discussed some of these more elaborate metrics in prior ARCC, GAIN, MAIN, NEWT, OCSL, PSEC, SLRC, and TSLX articles (see my profile page for links to prior articles regarding those companies).
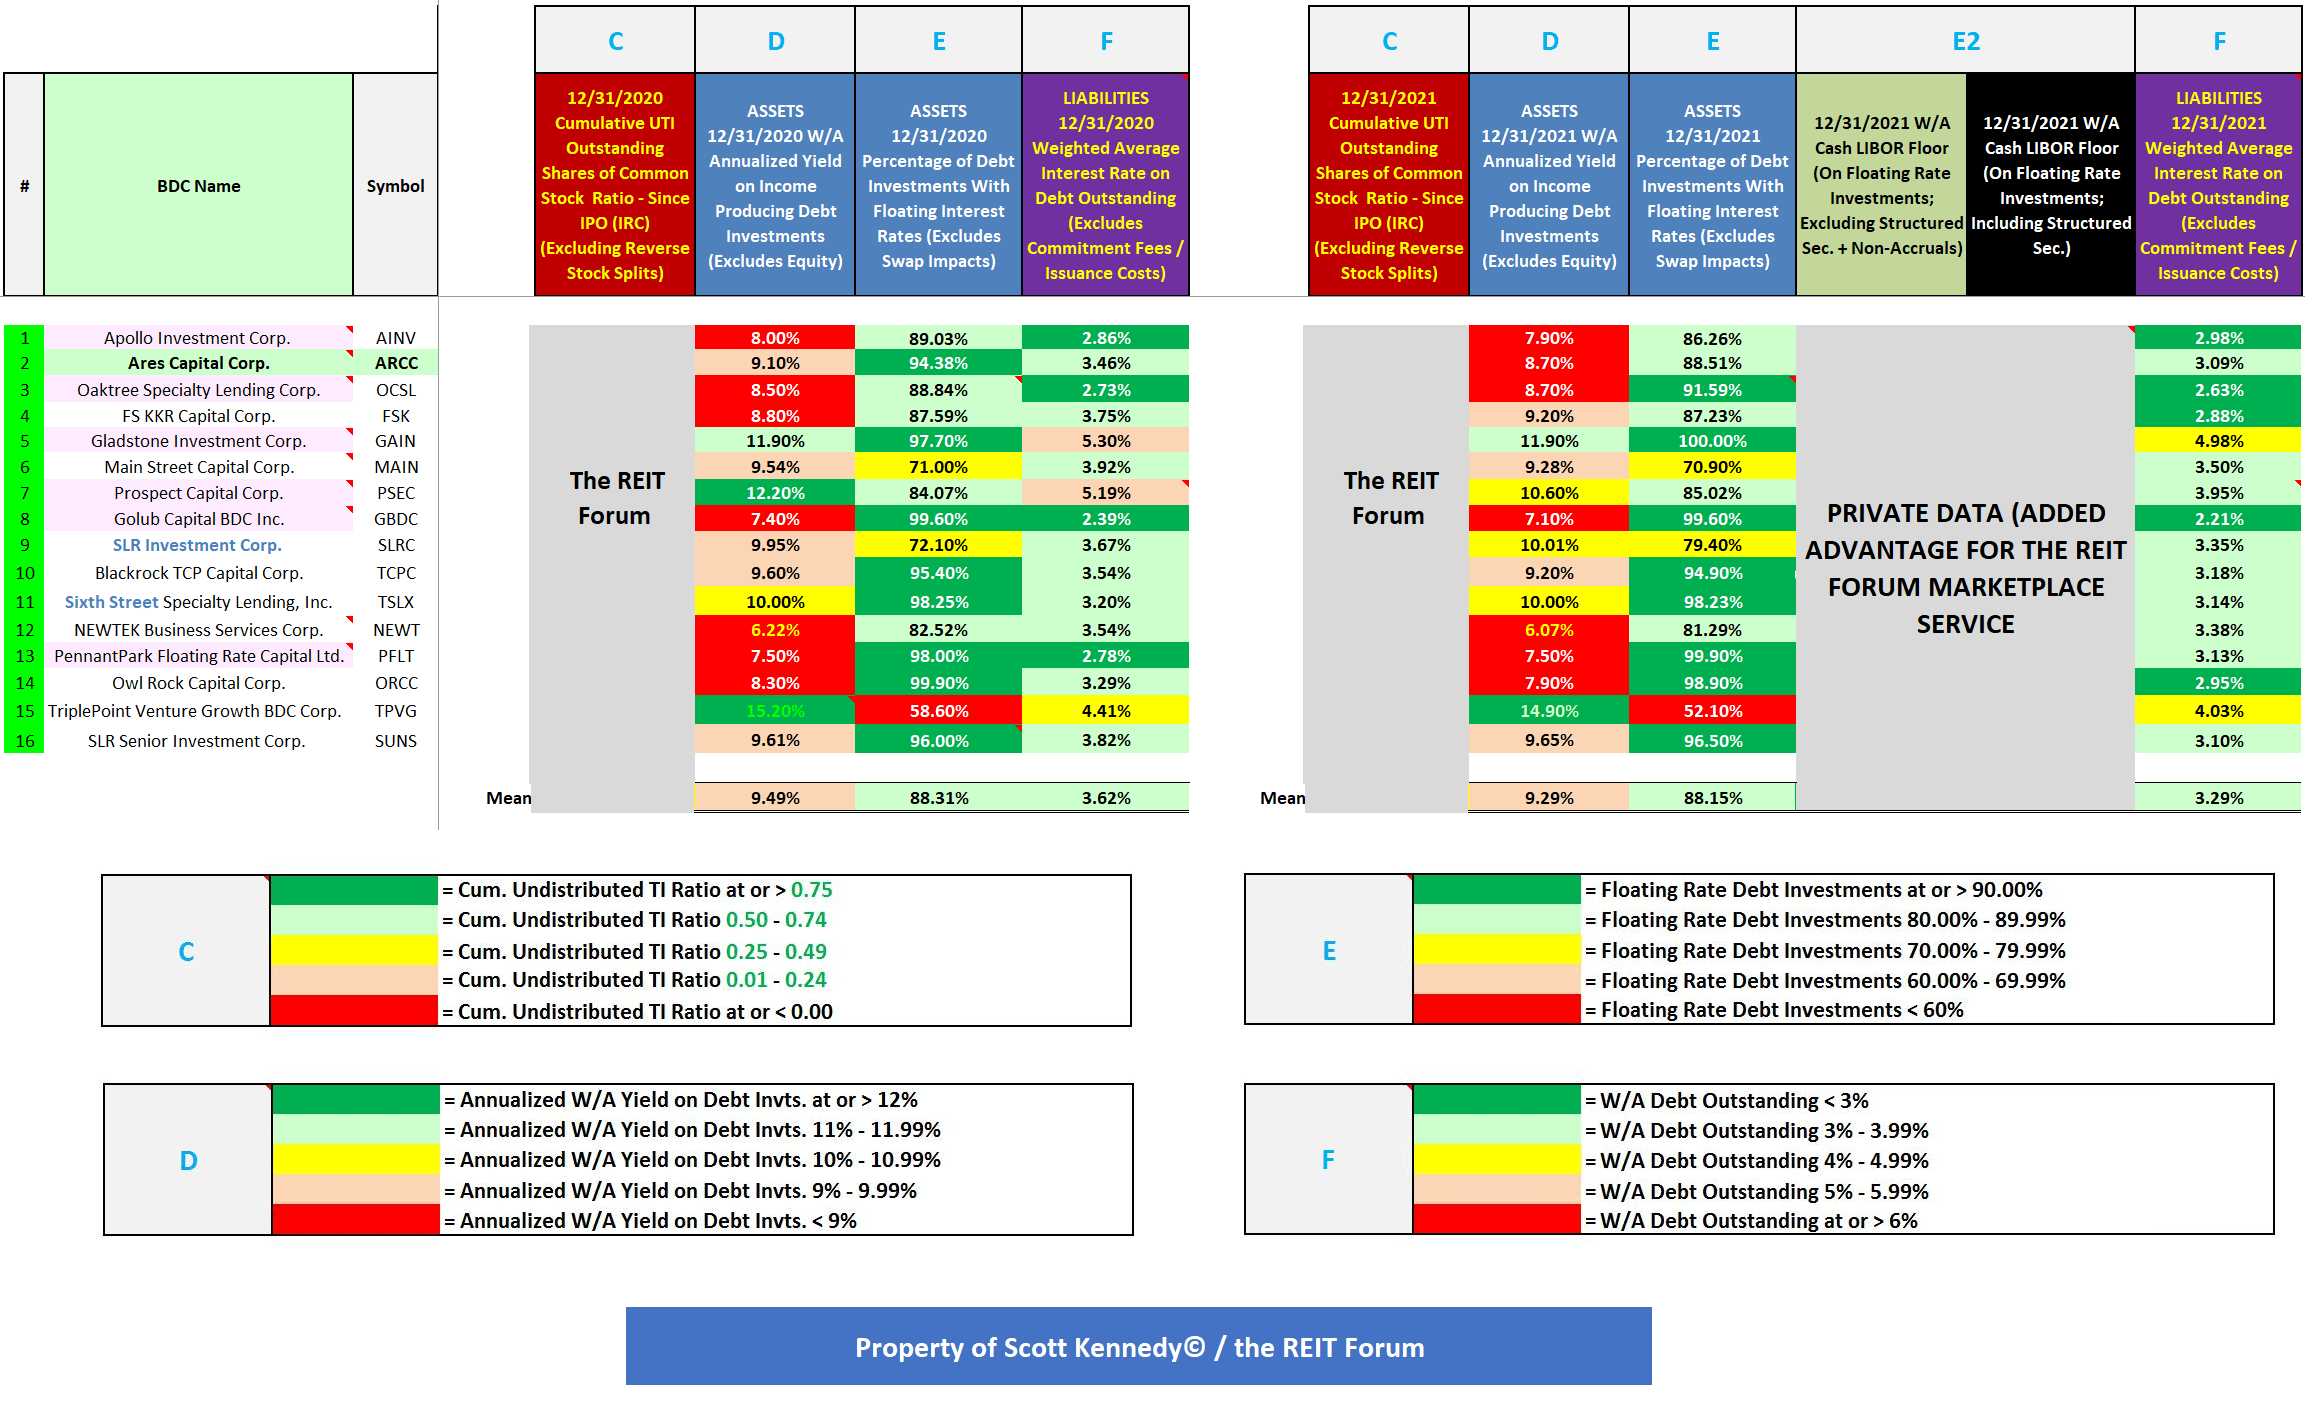
Table 4 – Several Additional Dividend Sustainability Metrics (12/31/2021 Versus 12/31/2020)
The REIT Forum
(Source: Table created entirely by myself, partially using data obtained from the SEC’s EDGAR Database [link provided below Table 3])
Using Table 4 above as a reference, a very important metric to consider regarding a BDC’s long-term dividend sustainability is each company’s cumulative undistributable taxable income (“UTI”) outstanding shares of common stock ratio (highly valuable “forward-looking” data). Cumulative UTI is “built up”/retained net investment company taxable income (“ICTI”) in excess of previously paid dividend distributions since an entity’s initial public offering (“IPO”) or after the most recent tax year when an entity overdistributed its ICTI with no such surplus to offset the difference. This figure/metric has been covered, at length, in previous BDC dividend sustainability articles. To calculate this ratio, I take a company’s cumulative UTIand divide this amount by its outstanding shares of common stock. The higher this ratio is, the more positive the results regarding a company’s future dividend sustainability. Since most BDC peers have continued to gradually net increase their outstanding shares of common stock, this ratio shows if a company has been able to increase its cumulative UTI balance by a similar proportion.
ARCC had a cumulative UTI coverage of outstanding shares of common stock ratio of 1.34 as of 12/31/2021 (see blue reference “C”). When calculated, this was a 0.27 increase during the TTM. Simply put, ARCC continued to have a notable net ICTI surplus to distribute over the foreseeable future. ARCC’s ratio, both as of 12/31/2020 and 12/31/2021, was notably more attractive versus the mean of 0.35 and 0.31 of the 16 BDC peers within this analysis, respectively. ARCC had the highest ratio as of 12/31/2021. This remains a very positive catalyst/trend to consider and, in my opinion, one of the main reasons why ARCC continues to trade at a modest-notable premium to CURRENT NAV.
In addition, I would point out ARCC has not decreased the company’s dividend per share rate since the second quarter of 2009. Yes, that is correct. ARCC has not reduced the company’s quarterly dividend per share rate for nearly 13 years. During this time, ARCC has increased the company’s dividend from $0.3447 per share to $0.41 per share. I believe the company should be “rewarded” per se, from a valuation standpoint, for not having to decrease its dividend for such a long time.
For example, since the first quarter of 2017, AINV, FSK, PSEC, SUNS, and TCPC have declared a net decrease to each company’s dividend (including any current special periodic dividends) of (20%), (29%), (28%), (15%), and (17%), respectively (includes accounting for AINV’s and FSK’s reverse stock split of 1:3 and 1:4). I believe that is a very important point to consider. In addition, ARCC’s management team continues to imply the company’s current quarterly regular dividend per share rate, at worst, will remain unchanged over the foreseeable future (currently at $0.42 per share). There remains the possibility for minor gradual increases to ARCC’s quarterly dividend and/or minor special periodic dividends being declared over the foreseeable future (even beyond 2022) to release some of the company’s cumulative UTI balance (to remain in compliance with the Internal Revenue Code (“IRC”).
In my opinion, another important metric to consider regarding a BDC’s dividend sustainability is a company’s weighted average annualized yield on its debt investments (asset side of the balance sheet). ARCC had a weighted average annualized yield on the company’s debt investments of 8.70% as of 12/31/2021 (see blue reference “D”). This percentage remained slightly below the mean of 9.29% of the 16 BDC peers within this analysis. ARCC’s weighted average annualized yield on the company’s debt investments decreased (0.40%) during the TTM without any material change in portfolio characteristics. Outside a couple BDC outliers, this was consistent with the overall trend within the BDC sector due to the recent decrease in the U.S. London Interbank Offered Rate (“LIBOR”) during 2019-2021 (various debt investments “reset” over time) and notable tightening of spreads (new originations at lower effective interest rates when compared to prepaid/repaid/sold debt investments). When expanding this metric’s time span to over the trailing 24-months, ARCC’s weighted average annualized yield on the company’s debt investments decreased (0.90%). This was basically the same severity of decrease versus the trailing 24-month average of (0.83%) of the 16 BDC peers within this analysis.
Prior to the early 2020 coronavirus (COVID-19) sell-off/panic, there was some 2019 “spread/yield compression” due to the recent suppression of long-term rates/yields. As I correctly previously pointed out, LIBOR across all tenors/maturities has continued to decrease which has lowered this metric, to varying degrees, across basically all BDC peers over the past 2 years. The lone outlier was OCSL where some previous non-accrual portfolio companies were put back on accrual status and the relatively new investment management team was able to source some new loan originations through the Oaktree platform. Even so, the 24-month increase in OCSL’s weighted average annualized yield was only 0.10% (very minor).
With that said, due to the COVID-19 pandemic, spreads across speculative-grade credit/high yield debt initially experienced a quick, notable “spike” in yields (at its peak by approximately 800 basis points [bps]). The severity of broader credit spread increases/widening was the most notable in speculative-grade credit/high yield debt (typically bear the most risk). With that said, with notable stimulus by the Federal (“Fed”) Reserve/Federal Open Market Committee (“FOMC”) within certain pockets of broader credit markets, markets notably “calmed down” as the calendar second quarter of 2020 passed. This overall sentiment “rippled” through broader markets; including speculative-grade credit/high yield debt. During the calendar second quarter of 2020, average speculative-grade spreads/yields narrowed/decreased by approximately (500) bps. These are notable changes for just one quarter. During the calendar third quarter of 2020, average speculative-grade spreads/yields narrowed/decreased by approximately (50) bps. This general trend continued during the calendar fourth quarter of 2020, first quarter of 2021, and second quarter of 2021 as average speculative-grade spreads/yields narrowed/decreased by approximately (160), (75), and (50) bps, respectively. So, speculative-grade/high yield debt spreads notably tightened in a little over 1 year.
While some BDC peers experienced a slight increase in weighted average annualized yields during the second half of 2020, I correctly projected this general “blip” would not continue during most of 2021. In fact, current speculative-grade/high yield debt spreads are even tighter versus prior to the onset of COVID-19. This is one of the main reasons why BDC stock prices have notably climbed from 2020 lows (asset prices increase when spreads/yields decrease; inverse relationship).
As previously projected in the second half of last year, I personally did not see spreads within this specific sector getting much tighter. To use an analogy, I believe there was recently a lot of “tension” on this particular rubber band. It could not be “stretched” too much further (BDC spreads would not tighten too much further). There would eventually be a widening of spreads (release the rubber band’s tension) as government support wanes; whether there were no more rounds of consumer stimulus and/or no additional rounds of small business Paycheck Protection Program (“PPP”) loans. The Fed Reserve/FOMC had also recently begun its asset tapering program (which has already ended) and there was just the 1st increase to the Fed Funds Rate.
During the calendar first quarter of 2022, speculative-grade spreads/yields have begun to widen out/increase. Nothing too notable yet but this fact should be mentioned. As such, I continue to not expect weighted average annualized yields to decrease too much further from current levels (widening spreads equal higher yields). If anything, with LIBOR sets to quickly rise during 2022, yields across the sector will gradually rise which is a positive catalyst/factor. That said, when spreads widen, asset pricing/valuations decrease so readers need to consider this impact on NAV. This also consider the eventual rise in credit risk (especially if rates/yields rise too quickly; “shock” to financial markets). These notions have been taken into consideration when it comes to projecting dividend per share rates and recommendation ranges provided towards the end of this article.
The next metric shown in Table 4 is each BDC’s proportion of debt investments with floating interest rates (asset side of the balance sheet; additional forward-looking data). ARCC’s proportion of debt investments with floating interest rates was 89.89% as of 12/31/2021 (see blue reference “E”). ARCC’s slightly above average floating-rate percentage was more attractive during the rising interest rate environment of 2017-2018. However, as noted above, LIBOR gradually decreased during 2019 which “accelerated” in 2020 as a direct result of the COVID-19 pandemic. As such, when floating-rate loans experienced a net decrease in stated rates when compared to late 2018-2019, ARCC has been impacted a bit more than most BDC peers. That said, most BDC peers have already moved below their weighted average cash LIBOR floor. While several BDC peers publicly disclose this figure, the majority of companies do not. Since I/my team personally calculate/confirm each BDC’s weighted average cash LIBOR floor each quarter (which is typically time consuming), I believe this is a strategic advantage to my/our service. As such, I have decided not to disclose these percentages (other services could simply “poach” this valuable information with little to no effort). This data, when combined with the other factors/metrics presented in this article (including several other factors not publicly disclosed), is used to determine dividend sustainability probabilities later in the article and project future NII per share amounts.
The last metric shown in Table 4 above is each BDC’s weighted average interest rate on all debt outstanding (liability side of the balance sheet). ARCC had a weighted average interest rate of 3.09% on the company’s outstanding borrowings as of 12/31/2021 (excludes commitment fees and loan issuance costs; see blue reference “F”). This compared to a weighted average interest rate of 3.46% as of 12/31/2021. When compared to the 15 BDC peers within this analysis, ARCC continued to have a slightly below average weighted average interest rate on all debt outstanding. As of 12/31/2021, 24.14% of ARCC’s debt outstanding bore floating-rates (credit facilities) while 75.86% of the company’s debt outstanding bore fixed-rates (convertible and unsecured notes). I believe taking a “snapshot” of each BDC’s weighted average interest rate on all debt outstanding allows readers to better understand which companies will experience generalized characteristics in the future (thus impacting future net investment income [NII]/TI). This is why I have continually beaten the institutional analysts’ consensus average regarding quarterly NII/adjusted NII projections (when including the other sector I cover on Seeking Alpha I/we have outperformed in 36/39 quarters).
Once again using Table 3 as a reference, ARCC declared a dividend of $0.42 per share for the first quarter of 2022. This was an increase of $0.01 per share when compared to the prior quarter. In addition, ARCC declared a special period dividend of $0.03 per share during the first-fourth quarters of 2022. This gets back to the notion ARCC’s management team is typically cautious-very cautious regarding dividend increases (even when the company has a very large cumulative UTI balance). To be frank, ARCC EASILY could have declared a larger special periodic dividend during 2022 (similar to what has recently occurred with sector peers GAIN and TSLX).
ARCC’s stock price traded at $20.50 per share on 3/23/2022. When calculated, this was a TTM dividend yield (including special periodic dividends when applicable) of 8.15%, an annual forward yield to ARCC’s stock price as of 3/23/2022 of 8.20%, and an annual forward yield to my projected CURRENT NAV of 8.80%. When comparing each yield percentage to ARCC’s BDC peers within this analysis, the company’s TTM yield based on its stock price as of 3/23/2022 was now slightly below average while the company’s annual forward yield based on its stock price as of 3/23/2022 and its annual forward yield to my projected CURRENT NAV was now near (at or within 0.50%) average. These percentages are not surprising when it comes to ARCC’s dividend sustainability due to the company’s weighted average annualized yield on debt investments and weighted average interest rate on debt outstanding (amongst the other factors discussed earlier).
Various Comparisons Between ARCC and the Company’s 15 BDC Peers: (The REIT Forum Feature)
It should also be noted NEWT continues ahead with the company’s plan to leave BDC status during 2022 (hence no longer be a Regulated Investment Company (“RIC”) per Internal Revenue Code (“IRC”) terminologies). As such, post conversion, NEWT’s dividend per share rates will very likely be negatively impacted (no mandatory statute regarding minimum distribution requirements).
MAIN has seen a nice rebound to this metric over the past quarter. This is encouraging for this specific BDC and was one of the reasons for the fairly recent percentage recommendation range increase (relative to CURRENT NAV) that I/we discussed with subscribers during MAIN’s earnings assessment chat note and subsequent article.
Conclusions Drawn (PART 2):
This article has compared ARCC and 15 BDC peers in regards to recent dividend per share rates, yield percentages, and several other highly unique dividend sustainability metrics. This article also discussed ARCC’s dividend sustainability through the third quarter of 2022. Using Table 3 above as a reference, the following were the recent dividend per share rates and yield percentages for ARCC:
ARCC: Dividend of $0.42 per share for the calendar first quarter of 2022; 8.15% TTM dividend yield (when including special periodic dividends [when applicable]); 8.20% annual forward yield to the company’s stock price as of 3/23/2022; and 8.80% annual forward yield to my projected CURRENT NAV.
Since ARCC had a slightly more severe TTM weighted average annualized yield decrease on the company’s debt investments (assets) when compared to the sector peers within this analysis (a slightly negative factor/trend), the most attractive cumulative UTI balance (a very positive catalyst/trend), a slightly below average interest rate on all debt outstanding (liabilities; a positive factor/trend), and a very slightly above average percentage of floating interest rate debt investments (generally a positive catalyst/trend when LIBOR rises; becomes a negative factor/trend when LIBOR decreases), I believe the company should have an annual forward yield to its NAV slightly-modestly above the average of the 16 BDC peers within this analysis.
When combining this data with various other analytical metrics not discussed within this specific article (including projected non-accrual rates during 2022 [anticipating a slight increase towards year-end]; some factors were covered in PART 1), I believe the likelihood of ARCC having a stable-slightly increasing quarterly dividend through the end of the third quarter of 2022 remains very high (90% probability). ARCC has already declared a special periodic dividend of $0.03 per share for each quarter during 2022 (hence a projection on ARCC’s special periodic dividend is unwarranted/not needed).
Looking back to prior dividend projections, I correctly projected a higher probability that FSK, OCSI, and TCPC would need to reduce each company’s quarterly dividend at some point in 2020. This analysis also correctly identified a high probability of a special periodic dividend for ARCC, GAIN, MAIN, and TSLX during 2019 (and in GAIN’s case an increased special periodic dividend). This analysis also previously correctly projected there was a higher probability MAIN, at the least, would need to reduce the company’s special periodic dividend (and in a more bearish case cease declaring this type of dividend). As we now know, MAIN suspended the company’s semi-annual special periodic dividend starting in the first half of 2020. More recently, this analysis correctly identified that TSLX would continue to declare special periodic dividends in both 2020 and 2021 (after a very brief “interruption” during the third quarter of 2020). Most recently, just last quarter, this analysis correctly identified the growing probability that ARCC would declare an increase to the company’s quarterly dividend per share rate, along with a special periodic dividend.
My BUY, SELL, or HOLD Recommendation:
From the analysis provided above, including additional factors not discussed within this article, I currently rate ARCC as a SELL when I believe the company’s stock price is trading at or greater than a 17.5% premium to my projected CURRENT NAV (NAV as of 3/25/2022; $19.10 per share), a HOLD when trading at greater than a 7.5% premium but less than a 17.5% premium to my projected CURRENT NAV, and a BUY when trading at or less than a 7.5% premium to my projected CURRENT NAV. These ranges are unchanged when compared to my last ARCC article (PART 1).
Therefore, I currently rate ARCC as a HOLD (however, close to a BUY).
As such, based on 3/25/2022’s market close, I currently believe ARCC is appropriately valued from a stock price perspective. My current price target for ARCC is approximately $22.45 per share. This is currently the price where my recommendation would change to a SELL. The current price where my recommendation would change to a BUY is approximately $20.55 per share.
Basically, all of the 16 BDC peers I currently cover should have a stable dividend for the calendar second quarter of 2022 (or each applicable company’s next set of dividend declarations). For some select BDC peers with a higher cumulative UTI balance, this includes the chance of a special periodic dividend and/or a minor-modest increase in its regular dividend.
Each investor’s BUY, SELL, or HOLD decision is based on one’s risk tolerance, time horizon, and dividend income goals. My personal recommendation will not fit each reader’s current investing strategy. The factual information provided within this article is intended to help assist readers when it comes to investing strategies/decisions.
Understanding My Valuation Methodology Regarding mREIT Common and BDC Stocks:
The basic “premise” around my recommendations in the mREIT common and BDC sectors is value. Regarding operational performance over the long-term, there are above average, average, and below average mREIT and BDC stocks. That said, better-performing mREIT and BDC peers can be expensive to own, as well as being cheap. Just because a well-performing stock outperforms the company’s sector peers over the long-term, this does not mean this stock should be owned at any price. As with any stock, there is a price range where the valuation is cheap, a price where the valuation is expensive, and a price where the valuation is appropriate. The same holds true with all mREIT common and BDC peers. As such, regarding my investing methodology, each mREIT common and BDC peer has their own unique BUY, SELL, or HOLD recommendation range (relative to estimated CURRENT BV/NAV). The better-performing mREITs and BDCs typically have a recommendation range at a premium to BV/NAV (varying percentages based on overall outperformance) and vice versa with the average/underperforming mREITs and BDCs (typically at a discount to estimated CURRENT BV/NAV).
Each company’s recommendation range is “pegged” to estimated CURRENT BV/NAV because this way subscribers/readers can track when each mREIT and BDC peer moves within the assigned recommendation ranges (daily if desired). That said, the underlying reasoning why I/we place each mREIT and BDC recommendation range at a different premium or (discount) to estimated CURRENT BV/NAV is based on roughly 15-20 catalysts which include both macroeconomic catalysts/factors and company-specific catalysts/factors (both positive and negative). This investing strategy is not for all market participants. For instance, not likely a “good fit” for extremely passive investors. For example, investors holding a position in a particular stock, no matter the price, for say a period of 5+ years. However, as shown throughout my articles written here at Seeking Alpha since 2013, in the vast majority of instances I have been able to enhance my personal total returns and/or minimize my personal total losses from specifically implementing this particular investing valuation methodology. I hope this provides some added clarity/understanding for new subscribers/readers regarding my valuation methodology utilized in the mREIT common and BDC sectors. Please disregard any minor “cosmetic” typos if/when applicable.
Current Sector/Recent ARCC Stock Disclosure:
On 10/12/2018, I initiated a position in ARCC at a weighted average purchase price of $16.40 per share. On 12/10/2018, 12/18/2018, 12/21/2018, and 4/8/2020, I increased my position in ARCC at a weighted average purchase price of $16.195, $15.305, $14.924, and $11.345 per share, respectively. When combined, my ARCC position had a weighted average purchase price of $13.256 per share. This weighted average per share price excluded all dividends received/reinvested. On 4/16/2021, I sold my entire ARCC position at a weighted average sales price of $19.598 per share as my price target, at the time, of $19.50 per share was surpassed. This calculates to a weighted average realized gain and total return of 47.8% and 67.8%, respectively. I held this weighted average position for approximately 20 months. This calculates to an annualized total return of 41.1%. Readers who have pointed out in the past that ARCC’s current stock price is approximately $1.25 per common share higher versus my 4/16/2021 sell price should consider the notion I redeployed my ARCC proceeds into another sector covered here on Seeking Alpha at basically the same annualized yield. This investment has, thus far, delivered an even higher total return when compared to merely keeping my previous ARCC position (important notion to point out).
On 3/15/2022, I once again initiated a position in ARCC at a weighted average purchase price of $19.586 per share. This weighted average per share price excludes all dividends received/reinvested.
On 10/12/2018, I initiated a position in SLRC at a weighted average purchase price of $20.655 per share. On 12/18/2018, 2/24/2020, 7/9/2020, 1/28/2021, 12/16/2021, and 3/2/2022, I increased my position in SLRC at a weighted average purchase price of $19.66, $19.498, $15.355, $17.195, $17.845, and $17.445 per share, respectively. When combined, my SLRC position has a weighted average purchase price of $17.615 per share. This weighted average per share price excludes all dividends received/reinvested.
On 12/10/2021, I initiated a position in FSK at a weighted average purchase price of $21.431 per share. On 12/14/2021, I increased my position in FSK at a weighted average purchase price of $20.10 per share. When combined, my FSK position has a weighted average purchase price of $20.431 per share. This weighted average per share price excludes all dividends received/reinvested.
Final Note: All trades/investments I have performed over the past several years have been disclosed to readers in “real time” (that day at the latest) via either the StockTalks feature of Seeking Alpha or, more recently, the “live chat” feature of the Marketplace Service the REIT Forum (which cannot be changed/altered). Through these resources, readers can look up all my prior disclosures (buys/sells) regarding all companies I cover here at Seeking Alpha (see my profile page for a list of all stocks covered). Through StockTalk disclosures and/or the live chat feature of the REIT Forum, at the end of February 2022 I had an unrealized/realized gain “success rate” of 86.7% and a total return (includes dividends received) success rate of 91.7% out of 60 total past and present mortgage real estate investment trust (mREIT) and BDC positions (updated monthly; multiple purchases/sales in one stock count as one overall position until fully closed out). I encourage other Seeking Alpha contributors to provide real time buy and sell updates for their readers/subscribers which would ultimately lead to greater transparency/credibility. Starting in January 2020, I have transitioned all my real-time purchase and sale disclosures solely to members of the REIT Forum. All applicable public articles will still have my “main ticker” purchase and sale disclosures (just not in real time). Please disregard any minor “cosmetic” typos if/when applicable.
Be the first to comment