

imagedepotpro/iStock via Getty Images
Many investors are in search of opportunities to invest their capital into funds that generate consistent, regular income from distributions that yield a high rate of return. One way to realize that high rate of return is by buying growth or value stocks at a low price and then selling shares at a higher price. Other investors prefer to preserve their capital base and generate monthly income from high yield investments like CEFs.
If you have read articles from other contributors to SA like Steven Bavaria, then you may be familiar with credit funds and the potential advantages over equity funds as he describes in detail in his article from June of this year. Credit funds hold debt instruments rather than shares in the equity of companies (such as common or preferred stock, for example). Those debt instruments may include senior loans, CLOs, corporate bonds, investment grade bonds, or high yield “junk” bonds that are essentially just lower rated (higher risk of default) bonds. In fact, the term junk scares off some investors as being “too risky” for them, but as Steven explains in his article, there is a lot of junk around in the investment world:
The great majority of corporations that borrow from banks, issue debt and equity in the market, and that most of us know and whose products and services we are familiar with, are non-investment grade companies (i.e., “junk”).
One advantage of a credit fund versus an equity fund like Cornerstone Total Return Fund (CRF), which I wrote about here, is that the risk of a capital loss is typically lower with a credit fund and when held in a CEF those credit instruments like senior loans, CLOs, corporate bonds, and other high yield junk debt held by the fund can pay equity-like returns over time.
One such fund that has a good track record of paying consistent monthly income and is a good option to consider during the current bearish market environment, is the Ares Dynamic Credit Allocation (NYSE:ARDC) fund. Currently, ARDC pays a consistent, monthly distribution of $0.1025, raised in August of this year from the previous monthly dividend of $.0975. The forward yield works out to about 9.3% annually at the current market price of $13.16 as of market close on 8/26/22.
According to the fund overview,
The fund seeks attractive risk-adjusted total returns with a focus on high current income and an opportunity for capital appreciation.
The Fund invests primarily in a broad, dynamically managed portfolio of (i) senior secured loans (“Senior Loans”) made primarily to companies whose debt is rated below investment grade; (ii) corporate bonds (“Corporate Bonds”) that are primarily high yield issues rated below investment grade; (iii) other fixed-income instruments of a similar nature that may be represented by derivatives; and (iv) securities of collateralized loan obligations (“CLOs”).
Fund History
The investment approach as described in the fund fact sheet:
- Dynamically allocates across investment opportunities primarily in high yield bonds, senior loans and CLO securities,
- Designed to navigate evolving market conditions through deep fundamental credit analysis and in-depth due diligence,
- Tenured team with 20+ year track record benefits from the market intelligence, relationships and resources of the Ares platform.
With about $500 million in managed assets the fund uses leverage – currently rather high at 34.76% as of July 31, 2022, and has a 2.8% expense ratio, which is also on the high side. The fund inception date was 11/27/2012. As of July 31, NAV per share was $14.31 and as of 8/25/22 is $14.50 according to CEFconnect, which means the fund is trading at a discount to NAV of about -8%.
Historically, the fund has traded at a discount and the current discount is slightly less than the 5-year average discount of -10%. But as you can see in the chart below from CEFconnect, the discount had narrowed in 2021 and has been widening again this year.
ARDC Price Discount history (CEFconnect)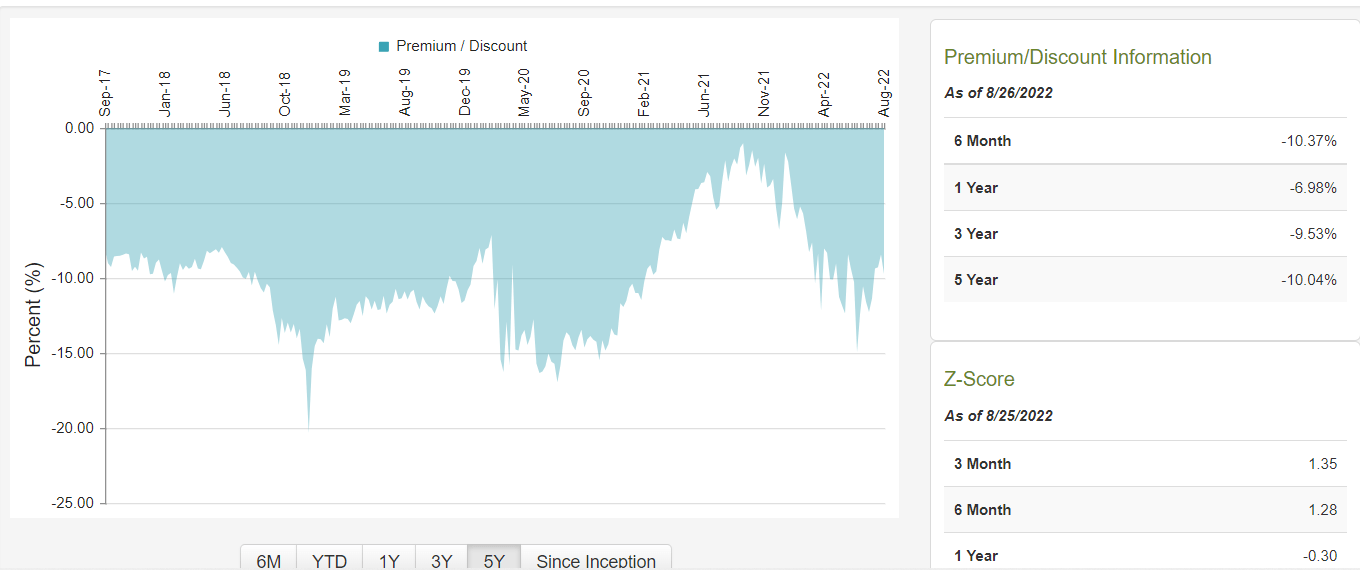
The credit markets have been unusually volatile this year and in June and early July there was an unusual amount of negative sentiment in the credit markets, leading to the wider discount.
Portfolio Holdings
According to the 7/31/22 fund fact sheet, the holdings in the ARDC fund include 41.9% floating rate instruments with a 7.69% weighted average coupon. Those holdings consist of about 51% bonds, 22.7% CLO debt, 14% loans, 9.8% CLO equity and 2.6% cash. The industry allocation outside of CLOs is diversified and rather evenly spread across a variety of industry sectors.
fund fact sheet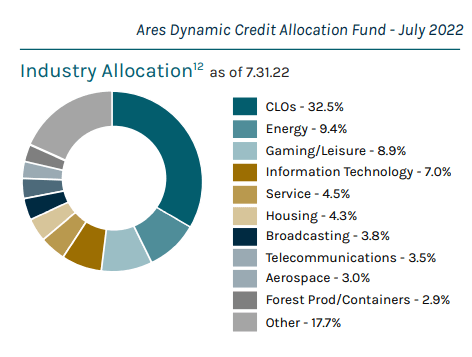
The top 10 holdings represent only about 12.5% of the total assets. As of 7/31/22, there were a total of 245 instruments from 202 issuers with an average position size of less than 0.5%.
The weighted average loan YTM (yield to maturity) = 10.62%, bond YTM = 7.67%, and CLO YTM = 13.45%. The effective duration is 1.98. A footnote on the fact sheet describes the fund’s liquidity:
The Fund has $74 million aggregate principal outstanding on a $212 million revolving funding facility with an institutional lender, pursuant to which the Fund expects to borrow funds to make additional investments, subject to available borrowing base and leverage limitations.
The fund adviser is Ares Capital Management II, LLC, a subsidiary of Ares Management (ARES). The Ares Credit group includes more than $200B in AUM, has more than 3,000 subsidiary companies and a global reach. The credit investment team includes more than 320 employees and many of those have over 20 years of experience in managing credit investments.
fund fact sheet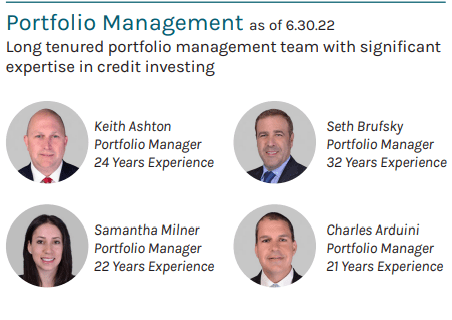
Why CLOs?
Like the use of the term “junk” to describe below investment grade bonds, the term CLO can be intimidating and confusing to investors who do not fully understand the risk/reward behind them. Some of the benefits and risks of CLOs are described in detail in this blog. In general, CLOs have wider yield spreads than other debt instruments, offer better performance, have more regulatory oversight (and thus lower risk), and tend to have lower interest rate sensitivity. The floating rate yields in many CLOs offer an inflation hedge as well. They also tend to have lower default rates than other types of senior loans or high yield bonds.
Conversely, CLOs present more of a credit risk (typically junk level), have potential for collateral deterioration, are non-recourse and not guaranteed, and have the potential for trading illiquidity. Timing of issuance is another consideration with CLOs as the market conditions could change from the time they were issued until the reinvestment period.
For these reasons, the fund managers at ARDC generally will not invest more than 40% of the portfolio holdings in CLOs, as explained on the fund’s website.
Under normal market conditions, the Fund will not invest more than (i) 40% of its Managed Assets in securities issued by entities commonly referred to as CLOs (“CLO Securities”) and other asset-backed securities, or (ii) more than 10% of its Managed Assets in subordinated (or residual) tranches of CLO Securities.
Fund Performance
From its inception, the fund has provided a total return of 4.55% at NAV and 3.87% at Market price.
ARDC fund performance (fund website)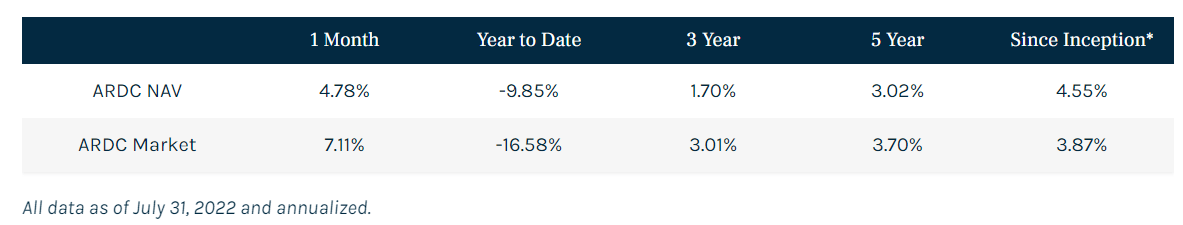
However, most of the negative performance has been in the past 9 months or so, with a YTD total return of -13.95% at market price.
YTD total return (Seeking Alpha)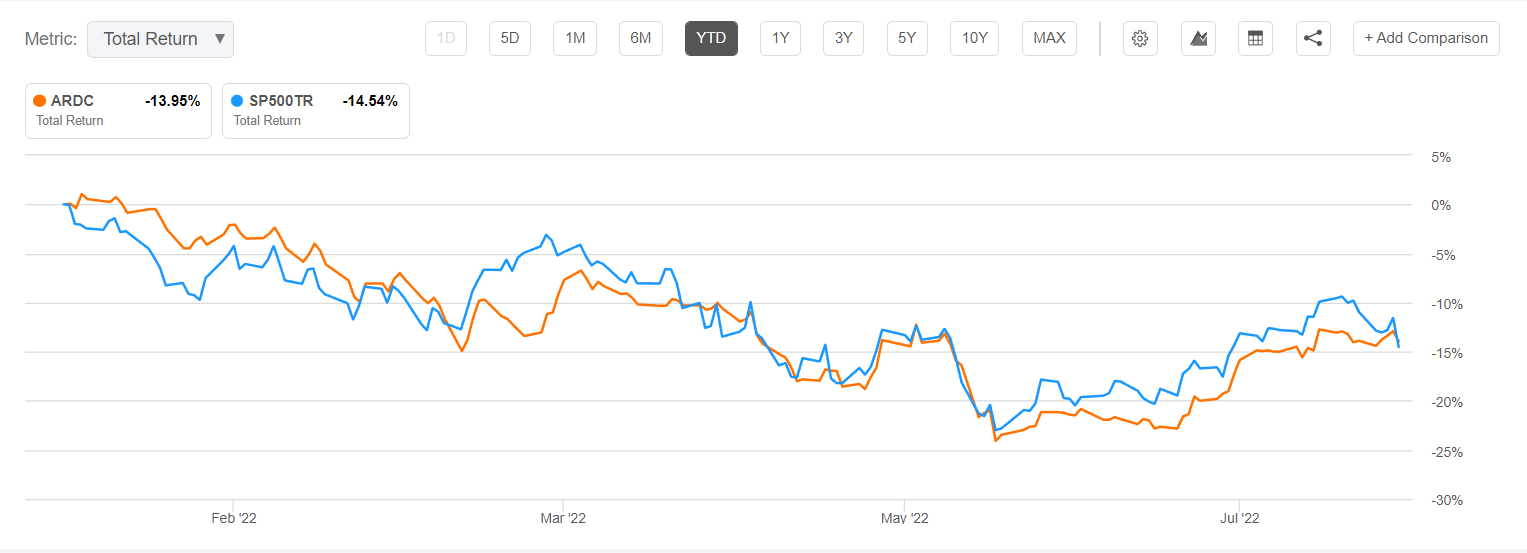
On the other hand, the last month (through July 31) reported a TR of 4.78% at NAV and 7.11% at market price, and as of the end of 2021 the fund had realized a 1-year total return of 23.15% and an annualized 5-year total return of 10.4% based on a backtest analysis using Portfolio Visualizer.
Trailing returns thru 2021 for ARDC using PV (Portfolio Visualizer)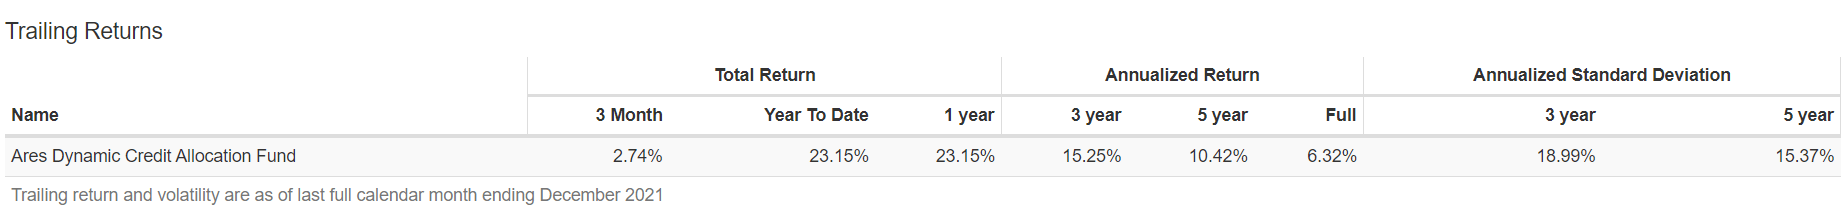
This fund, in similarity with other credit and senior loan funds like BlackRock Corporate High Yield Fund (HYT), tends to follow the high yield credit spreads. As the high yield spreads increase, the fund managers can use leverage to pump up the income to fund distributions at a higher yield.
Seeking Alpha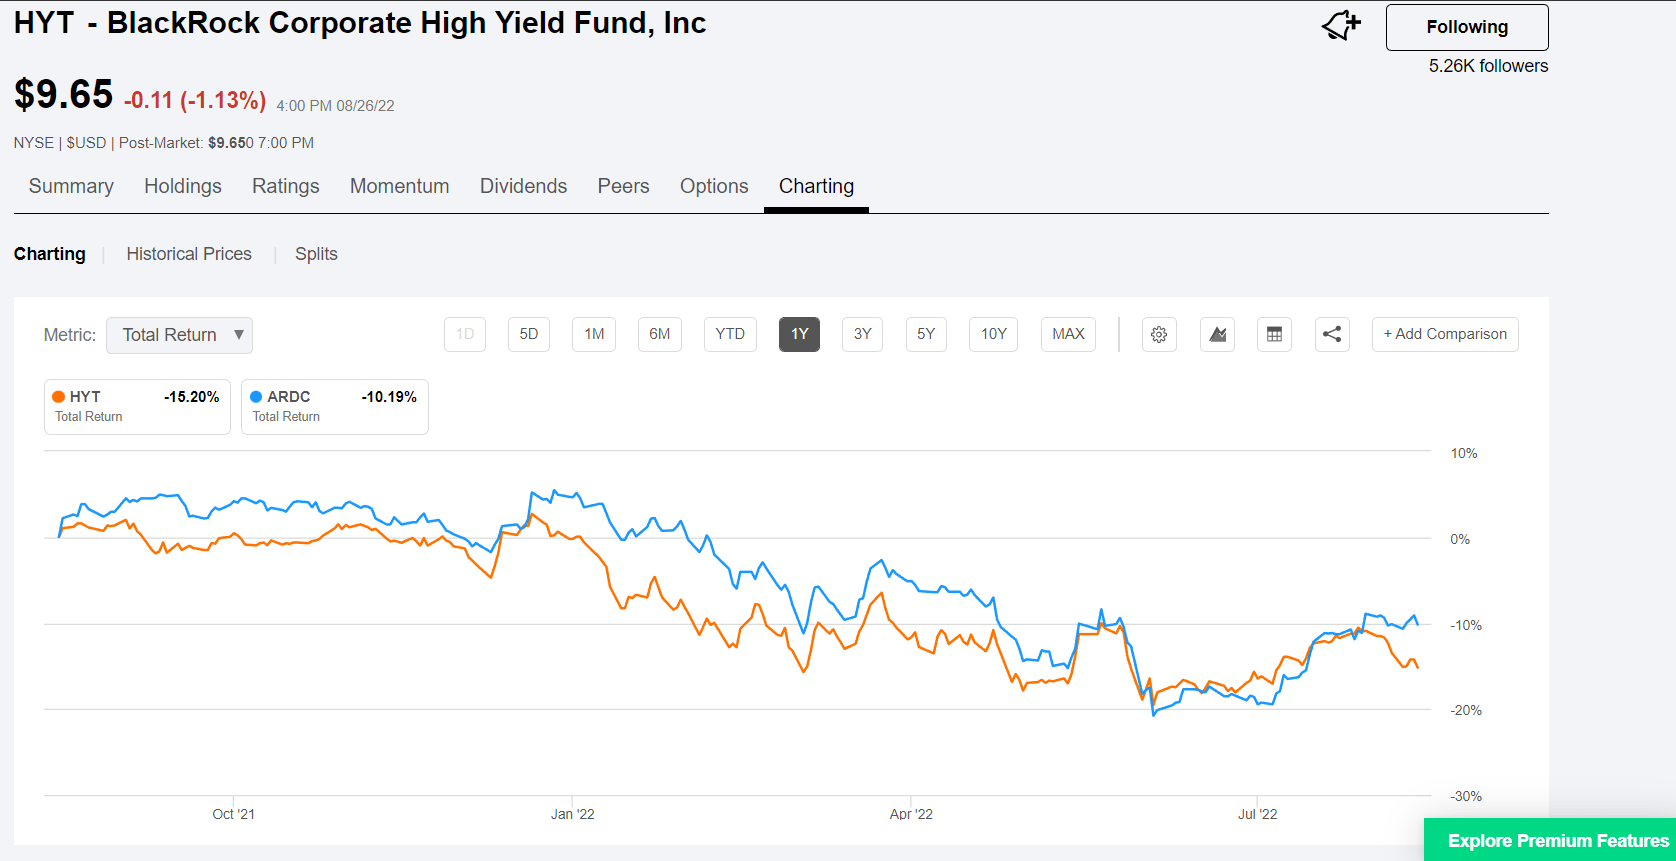
When those spreads start to tread downward, as they began to do a year ago, the fund’s NAV declines taking down the market price to an even wider discount. However, the income is still being generated to cover the distribution. Or at least that is what appears to be the case with ARDC as the fund just declared an increase in the monthly distribution, and they would not have done so if the income was not covering the distribution.
Also, the broader market action tends to affect share price even more than the credit spreads, so the wider discount means that the current 9.3% distribution represents a higher yield due to the lower market price. That higher yield tends to attract more investors buying into the fund, which should help to close the discount over time.
In the chart of high yield credit spread in the FRED economic data from the St Louis Fed you can see how the spread got smaller in the past year until about March of this year when it jumped and then dropped again in April, then began soaring into July. That was when the worst of the bear market caused the market price to drop considerably before starting to recover a bit in late July and into August, while credit spreads begin to level out.
High Yield Spread (St Louis Fed)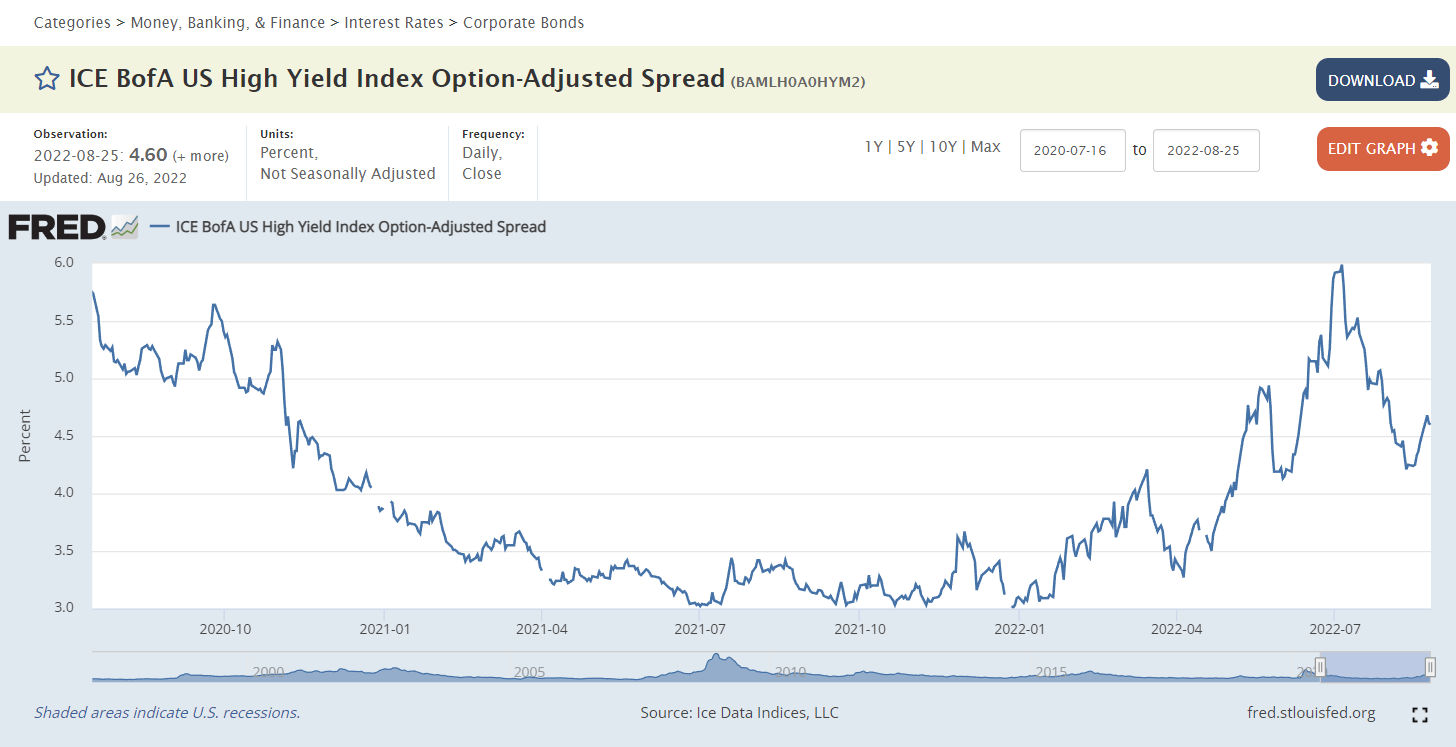
Where it goes from here is anyone’s guess but in my opinion the fund managers are experienced enough to be able to take advantage of the increasing spreads to adjust the fund holdings accordingly. And the fact that they just declared a 5% increase in the regular monthly distribution speaks to that.
Wrapping Up
The relatively rapid fluctuations in credit spreads seem a bit excessive over the past year and that makes it even tougher to predict the future, which is hard enough already. But with the widening discount to NAV and the increased distribution, along with higher credit spreads makes me think that now is a good time to buy shares of ARDC or add to an existing long position. The market price is likely to catch up to the NAV once the overall market comes to its senses and begins to recognize that the underlying holdings are not all going to default on their loans.
If the broader market does continue to decline as rapidly as it did on Friday after Powell suggested more “pain to come”, then it may be wise to wait a few days or possibly weeks to determine the market direction. If the next leg down in a bearish market drags down all asset classes, then there could be better opportunities ahead to buy shares of the fund at an even greater discount.
Be the first to comment