

Iuliia Korniievych /iStock via Getty Images
I have mentioned Archer-Daniels-Midland Company (NYSE:ADM) many times over the years in my Seeking Alpha writings. As long as current management runs the company with super-conservative financials, holding large grain inventories, and earning a regular almost recession-proof margin on sales, I will still recommend the stock as a top inflation protector for individual investors. My last bullish writeup on ADM was in January 2021 linked here, at $52 per share.
I have a long trading/research history with the company spanning decades. Former and long-time CEO Dwayne Andreas was a subscriber to my Maverick Investor newsletter in the mid-1990s through the corporate office.
The only time I have shied away from shares is when valuations have drifted into an excessive position, which has been a rare occurrence. If you are looking for a sound total-return winner over the years, with a future just as bright, ADM should be one of your research assignments this week.
Company Website, www.adm.com
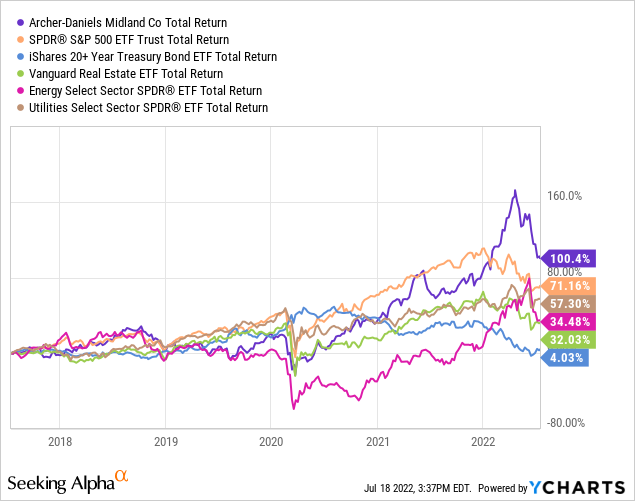
Following the spike in grain prices and improving health of the farm economy during 2021-22, ADM’s total return (price appreciation + dividends) over the last 12 months has been +26%, far outstripping the S&P 500 loss of -9%. To me, ADM acts something like a bond investment, with steadily rising earnings and dividends backed by rising cost-of-living advances (money printing inflation) in basic food stuffs.
Many dividend-focused ETFs have suffered mightily as interest rates have jumped with an explosion in commodity inflation and worker wages. Long-dated Treasury bonds have imploded for a negative -20% total return, and real estate focused REITs are down -10%. Utilities have done a decent job of holding their own for price and generated a total return of +8%. Really, only the booming oil/gas industry has bested ADM’s YoY performance. I am using the SPDR S&P 500 ETF (SPY), iShares 20+ Year Treasury Bond ETF (TLT), Vanguard Real Estate ETF (VNQ), Energy Select SPDR ETF (XLE), and Utilities Select SPDR ETF (XLU) for comparisons.
YCharts, 1-Year Graph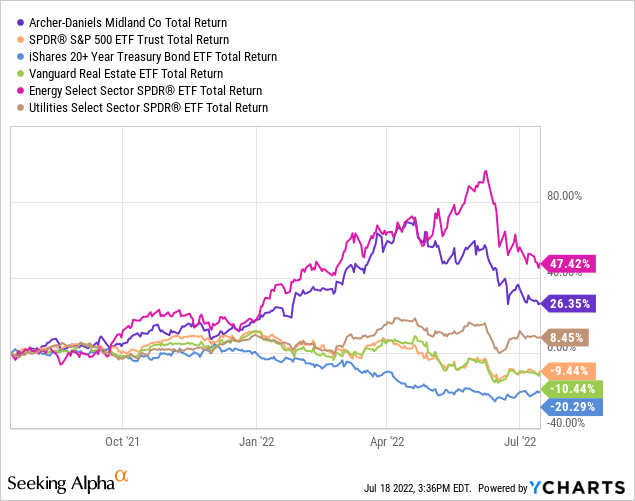
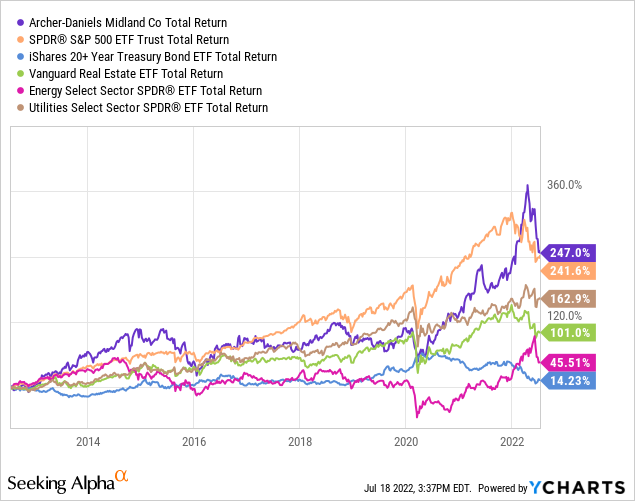
My view (supported by science, math and history) is investors hunting for ownership of an asset backstopped by money printing and food inflation should be comforted with ADM’s steady-as-she-goes business model. Over the last decade, ADM has easily beaten all of the main yield “sector” and diversified financial “market” fund designs. Below you can review Archer-Daniels’ winning setup and total returns over 3-year, 5-year and 10-year periods.
YCharts, 3-Year Graph YCharts, 5-Year Graph YCharts, 10-Year Graph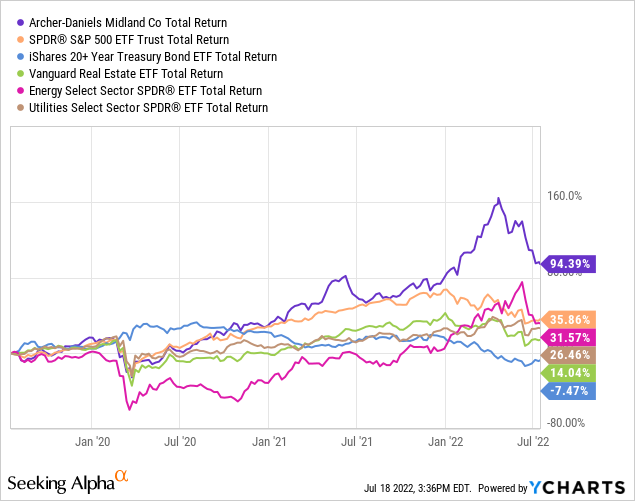
Something else to contemplate is ADM’s backdoor exposure to grain prices has been a more successful and profitable ownership proposition than buying and holding grains directly or through ETFs. Storage costs, management expense and contango conditions in rolled futures positions are all tough to overcome. The 5-year chart of this idea is pictured below, a relatively good time to own grains.
YCharts, 5-Year Graph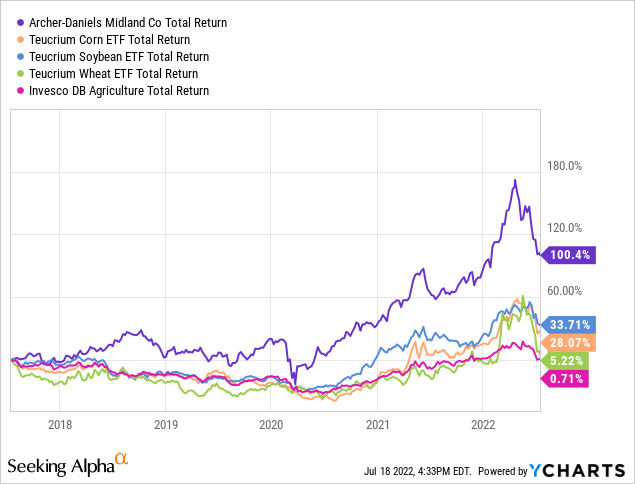
If you desire a buy-and-hold security, with decades of history of strong performance, in a nearly recession-proof industry (we all eat food no matter the economic direction of the day), paying a solid and rising dividend yield pushed by food inflation (and slight company growth), ADM’s fairly regular 10% to 15% in total annualized compounded performance (depending on the decade and price paid) is worthy of inclusion in your portfolio.
In a nutshell, ADM may be the smartest example of long-term returns following famed physicist Albert Einstein‘s marvel at the “most powerful force in the universe” – compound interest. In essence, ADM’s value is reset daily based on new and higher levels of paper money supply and population growth in the U.S. and the world. The daily-compounding of minor positives turns into weekly-compounding, then monthly-compounding, then yearly compounding. All of this positive math is working in your favor, without the use of excessive debt/leverage or dependence on ever-changing consumer fads/trends/sentiment about a product.
ADM Website ADM Website ADM Website ADM Website
Valuation Becoming Attractive
While ADM was getting pricey earlier in 2022, the summer selloff has opened a smart area to buy shares again, which could become a great opportunity if the stock market swoon continues. I do like the $72 share quote today, but $65 or $60 would be even better for long-term investors to gobble up a chunk. Price to trailing earnings, sales, and book value are near 5-year averages, with PE on the low end of the spectrum and the other two categories at slight premiums.
YCharts, 5-Year Fundamental Ratios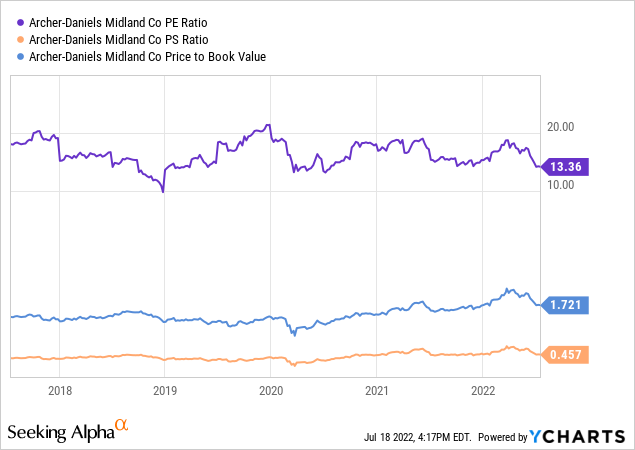
When you include minor fluctuations in cash held and total debt, enterprise value calculations are near the middle of 10-year averages vs. EBITDA cash generation and final after-tax income.
YCharts, 10-Year EV Stats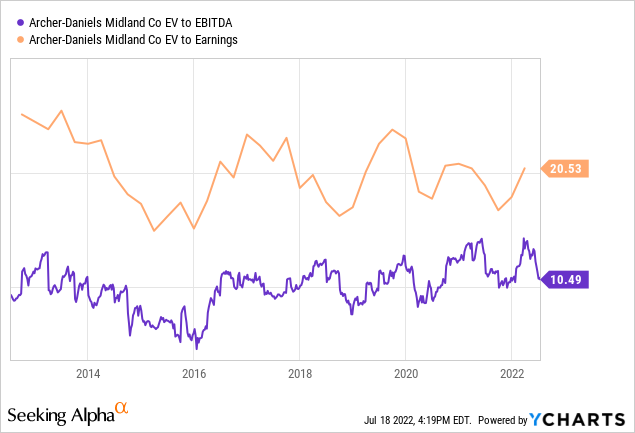
More good news for ADM shareholders is profit margins have been drifting in the right direction for years. Wall Street likes to value companies with higher margins with better valuations. Yet, valuations are not significantly different than a decade ago.
YCharts, ADM Profit Margins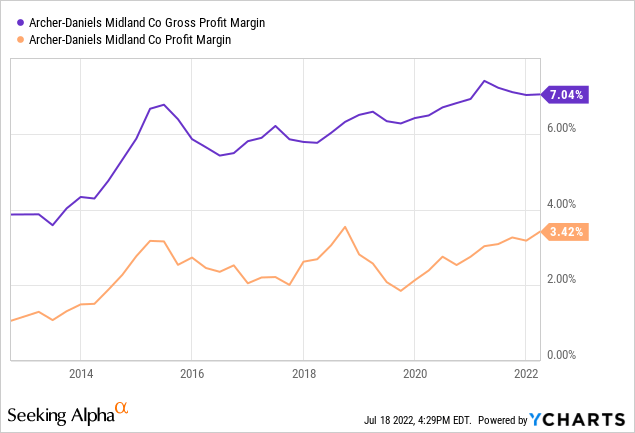
Wall Street analysts are forecasting a peak in grain prices and AMD’s profit potential in 2022. However, I am saying not so fast. Few experts foresaw a meaningful uptick in grains a few years ago. [I wrote about higher grain prices all of the time in 2020 and 2021, as a function of excessive central bank money printing.] If climate change is real, and I think it is becoming demonstrably obvious each passing year some type of warming globally is happening, more droughts and grain shortages are in the future, maybe the immediate future the rest of this decade.
Assuming grain prices remain high for years, ADM is actually selling at a bargain price around $70 per share, with a P/E of 10x or 11x the new normal for operations (9% or 10% earnings yields on invested capital). You never know for sure, but current analyst estimates for 2023-24 prove on the low side of reality. ADM has a history of selling at a 10% to 30% P/E discount vs. the S&P 500 with its heavy capital spending requirements to replace and add plant & equipment. Yet, a best-case ADM outcome of 10x future results is 50% lower than projected S&P 500 ratios around 20x during 2023-24.
ADM Estimates, Analyst Consensus – Seeking Alpha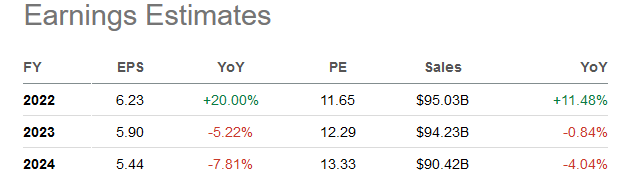
Opportunity for Rapid Dividend Raises
Today’s trailing 12-month 2.1% dividend yield for ADM is lower than witnessed in past years, but still well above the average 1.6% cash distribution from the S&P 500. It is also better than the trailing yield of 2.0% for the iShares 20+ Year Treasury Bond ETF (with a more static dividend yield of 3.0% now available to investors in Treasury bonds owned directly, a fixed payout until maturity). Sure, oil/gas names, real estate investment trusts (“REITs”), and utilities offer stronger upfront yields. Nevertheless, looking forward, the dividend growth story for ADM may be more enticing.
YCharts, 1-Year Graph, Dividend Yields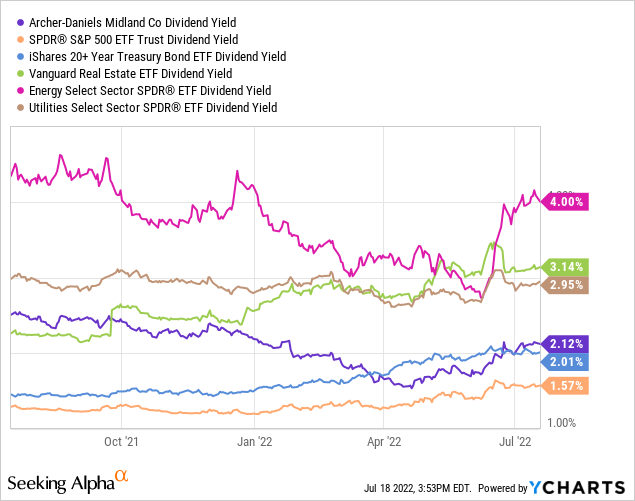
The Archer-Daniels coverage ratio of the dividend from earnings is superb today at 3.6x. The last time coverage was this high, the payout rose roughly 50% over the 3-year period between 2014-16. So, it’s entirely possible investors purchasing shares in the low $70s will receive an annual dividend yield closer to 3% in 24-36 months. I give the dividend outlook an “A” rating vs. other blue chips in America.
YCharts, 10-Year Dividend Stats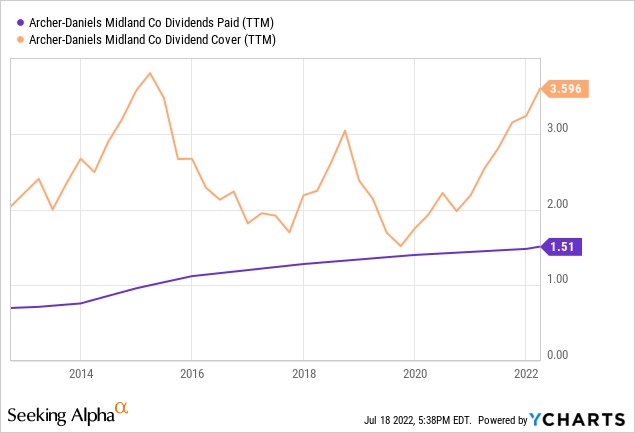
Technical Trading Chart
Another positive for ADM owners is the technical chart looks bullish and fully supportive of new all-time highs above April’s $98. You can review several momentum indicators on the 18-month chart of daily price and volume changes below. Notice the Accumulation/Distribution Line, Negative Volume Index, and On Balance Volume indicators are all holding up well despite the -25% price drawdown from April.
StockCharts.com, 18-Months ADM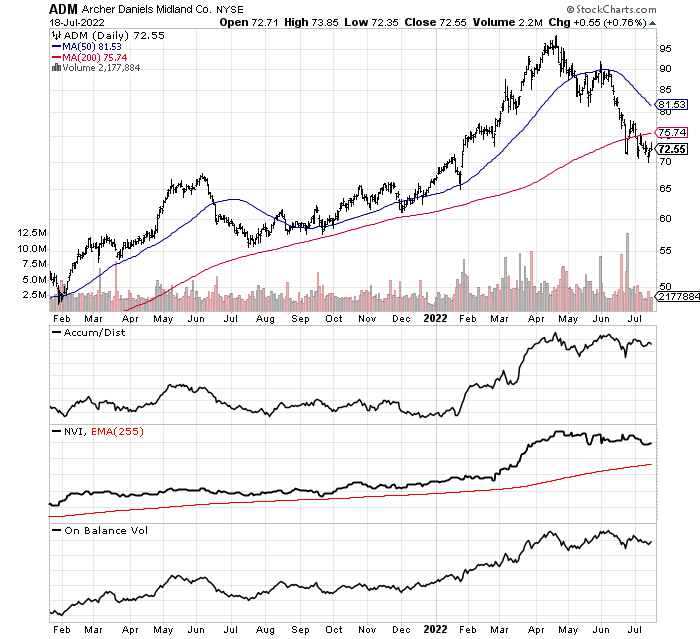
Final Thoughts
An industry-leading agriculture business, conservatively positioned and managed, with a blue-chip investment pedigree, at a fair long-term valuation, why wouldn’t you want to own ADM is my question. As its “supermarket to the world” slogan attests, ADM is one of the largest grain transportation, storage, refiners/processors, and marketers on planet earth, based in Illinois. My thinking is investors should view the latest setback in the share quote as an opportunity to accumulate a new position or add to existing stakes.
What are the main risks to your investment? The primary risk over the short run is grain prices decline dramatically. Such is possible in a deep recession scenario that drags down speculation in commodities. However, I believe any recession will be met by a new round of money printing by the Federal Reserve. Then, a devalued dollar currency creates new excuses for the next reflation cycle, which turns into more price inflation in basic food items. ADM has survived the full economic/commodity cycle well since the 1970s because it carries manageable debt levels while churning out consistent profit margins on sales.
Another immediate risk, and perhaps the one I really worry about, is the stock market could sink quickly again this summer and early autumn from a financial system liquidity crunch. I wrote about this clear and present danger for all stocks in an article last week here. A further 20% drop in ADM under $60 is possible, but I doubt it would stay at that level for long. Eventually, either Wall Streeters will start hunting for more defensive picks like ADM, or a drought will support grain prices, or new monetary easing will show up. In summary, I am confident Archer-Daniels’ future investment returns will outshine tons of other equity names into 2023-24.
I have worst-case 12-month projections down to $55 per share in a depression scenario that drags down both stock market and grain pricing. Upside could be as high as $100+ in an elevated grain price environment. From the current $72 quote, risk/reward analysis suggests possible total returns between -20% and +40% into the middle of 2023. I rate shares a Buy today, with Strong Buy territory projected under $60, if such a quote materializes.
Thanks for reading. Please consider this article a first step in your due diligence process. Consulting with a registered and experienced investment advisor is recommended before making any trade.
Be the first to comment