

Sundry Photography/iStock Editorial via Getty Images
Intro
The technical chart of ArcBest Corporation (NASDAQ:ARCB) makes for painful reading at present, especially given the solid fiscal 2021 numbers which included a record-setting fourth quarter. Revenues of close to $1.2 billion in Q4 and a net profit of $65 million powered the trucking company to annual sales of almost $4 billion which was a company record. Despite the spike in demand in fiscal 2021, management did not rest on its laurels. In November of last year, the firm closed on the purchase of Molo Solutions which will have strong ramifications for ArcBest´s capacity going forward. The company also returned well over $100 million to shareholders through share buybacks as well as dividend payments throughout the year.
Technical Chart Of ArcBest (Stockcharts.com)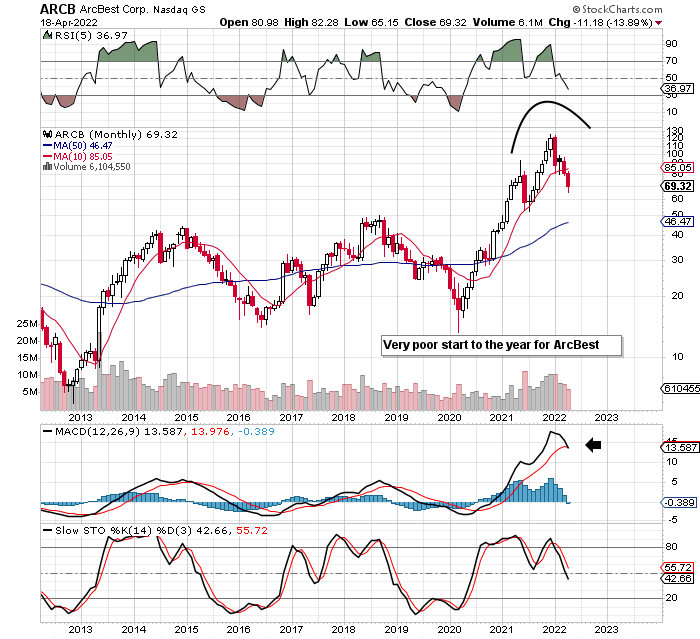
However as we can see above, due to sustained selling in recent weeks, shares are very close to delivering a sell signal by means of the monthly MACD indicator. In fact, the monthly histogram has unfortunately crept into negative territory, so it will be interesting to see if the selling continues to the downside.
Following on to the daily chart, we see a potential descending triangle that (if legit) has nowhere near played itself out in full yet. The reason being is the height of the triangle is close to $40, but shares at present are only trading approximately $10 below the baseline of the triangle. This begs the question of whether another $30 per share of downside could be on the cards for ArcBest at this present juncture. This seems ludicrous (but does tie in with the company´s 2018 highs) given the record annual numbers ArcBest has just reported.
Potential Bearish Triangle In ArcBest (Stockcharts.com)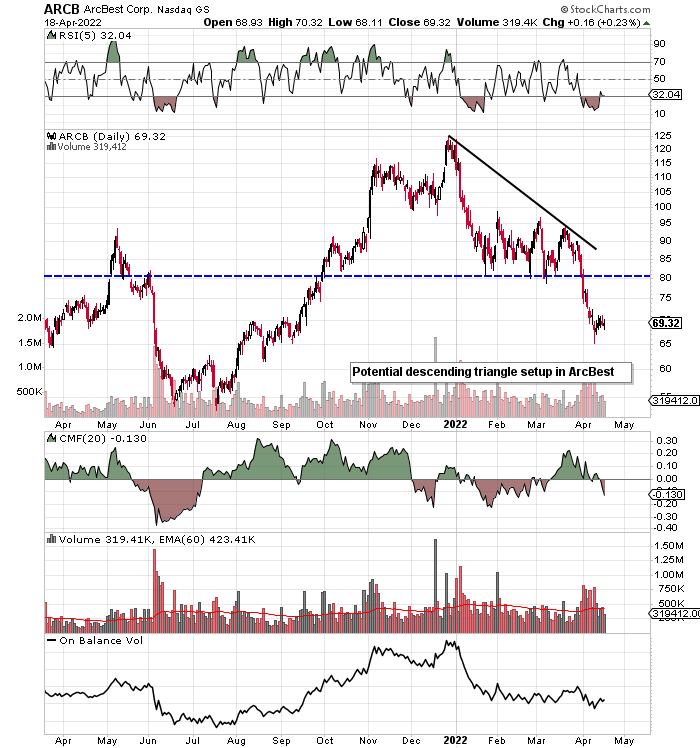
Suffice it to say from a technical standpoint, until we see a resolution to the potential triangle depicted above, for example, there is no need to be long stock at this juncture. If, indeed, ArcBest´s 2018 highs do indeed get successfully tested in this latest down move, it would present a strong buying opportunity for the following reasons
Return On Equity
ArcBest´s ROE presently comes in at 24.3% which is almost double what the sector, in general, is returning off its equity (13.81%). Even if we take a worst-case scenario and state that ArcBest´s ROE will drop back to something like its 5-year average (9.6%), this is not going to happen in the near term. Consensus revision estimates remain very strong with $5.24 billion in sales expected in fiscal 2022 on earnings of $10.73 per share. Shares are down well over 20% over the past month for example but 2022 bottom-line consensus estimates continue to rise. This is encouraging from a long perspective.
Profitability Trend
ArcBest´s company-wide operating margins have increased from 3.23% at the end of fiscal 2020 to 6.82% presently. Given the improvement in this area, management now estimates that asset-based operating margins will increase to between 10 & 15% by 2025, and asset-light operating margins (less FleetNet) of 4 to 6%. Digital-based solutions and strong innovation will play a big role in achieving these targets but there is definitely scope for continuous improvement here given ArcBest´s margins continue to trail the sector. Economies of scale (With $7 to $8 billion being the Top-Line estimate in 2025) are bound to bring more efficiencies surrounding costs and value into the mix here.
Free Cash Flow
The purpose of income is to generate cash flow, and ArcBest has also not been found wanting here. Out of the $214 million of net profit ArcBest made in fiscal 2021, $245 million of free cash flow was generated. Furthermore, cash flow will continue to grow in the company due to rising sales and earnings. Free cash flow is probably the most important profitability metric for the following reason. Having cash left over after the bills are paid enables companies to keep on investing in their businesses even in down markets. ArcBest´s operating cash-flow forward multiple of 4.33 looks very cheap compared to the industry and will go much lower if indeed shares continue their decline.
Conclusion
Therefore, to sum up, although the technical charts look bearish in ArcBest at present, we still see the trucker as a buying opportunity when indeed the bottom is in. The company is just off the back of a record fourth quarter and operating margins continue to improve. Let’s see how the first-quarter earnings fare, which will be announced on the 29th of this month. We look forward to continued coverage.
Be the first to comment