

Cintas headquarters in Cincinnati, Ohio, USA.
JHVEPhoto
In the introductory article we derived the relationship between volatility and risk and presented a method for exploiting this knowledge to construct portfolios with optimal risk-reward ratio. In this second installment we apply the method to a prospective candidate, Cintas Corporation (NASDAQ:CTAS).
Charlie Munger famously said in the short run the market is a voting machine but in the long run a weighing machine. This is the rationale as outlined in the introductory article for using the long-term, linear-regression-to-the-logarithm-of-price-history as an indication of intrinsic value, The regression smoothes out the excesses which occur during periods when Mr. Market is overly optimistic or pessimistic. The operative word here is indication. A regression can tell us the historical weight the market has assigned and how its current vote compares. It cannot foretell what the future holds but it can identify opportunities that warrant further investigation.
Review of the Method
If there is no fundamental reason why a solid company with a strong moat shouldn’t perform as well in the future (over some reasonable time frame) as it has in the past, we can use statistics to provide the probability of success and more importantly, the probability of loss. But there are some fundamental obstacles to this approach. First, we need to derive a statistically sound description of the stock’s price movement (i.e., the probability density function of the residual, think histogram, again see the introductory article) and some assurance that that description will remain relatively constant over the long run.
Despite what you may have heard, stock prices are not random walks, nor do they fit a normal (Gaussian) distribution. Bayesian analysis allows us to derive the empirical distribution custom to an individual stock. And while there may not be a mathematical name for that distribution, in the end, it matters not – as long as we can draw a series of random numbers from the derived distribution whose statistics match the observed price movements. If the PDF thus derived has remained relatively constant over time, we can assume it well remain so for the foreseeable future. This assumption allows us to simulate possible future price paths. By aggregating thousands of such simulated paths in a Monte Carlo analysis, we can determine the probability of gain and loss.
Of course there is risk inherent in these assumptions, which is one reason for building a diversified portfolio and for entering a position only when the stock is well below its intrinsic value.
Application – CTAS
Let’s illustrate with an example. Below is the log chart for Cintas Corporation. It fits first our selection criteria of exhibiting compounding over an extended period of time. Further, it is currently near the bottom of its volatility channel and thus might be on sale.
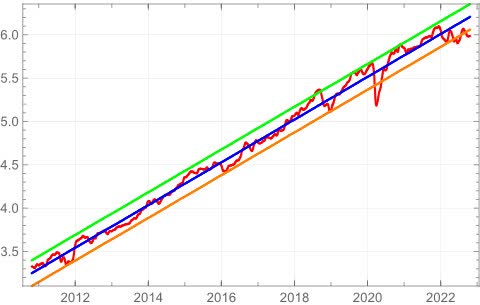
Figure 1 – Log Plot of CTAS with Volatility Bands (Author)
First, note that the histogram of the stock’s percent daily price movements doesn’t look Gaussian (normal) at all.
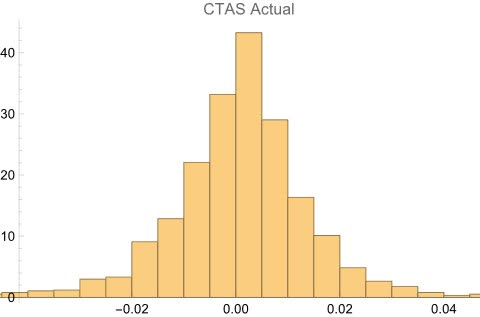
Figure 2 – Histogram of CTAS daily price movement’s (%) – 2012 to present (Author)
But even though the mathematical description of this PDF is unknown, Bayesian analysis allows us to draw random numbers from a matching distribution. We can use these simulated daily movements to create a simulated price path. One such path is shown below along with the actual historical log price movement for comparison.
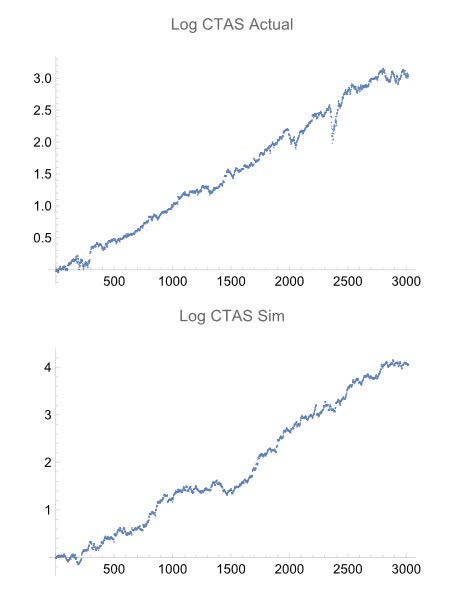
Figure 3 – Actual vs Simulate log-price movement (Author)
The simulate plot of past price action above is presented to show that the method produces reasonable paths. To do the Monte Carlo analysis we create many such paths (thousands) simulating future movements. And even though the simulated price path doesn’t match the actual path (it would be quite odd if it did), the critical thing is that the histogram of the simulation matches the observed data and so represents a possible path.
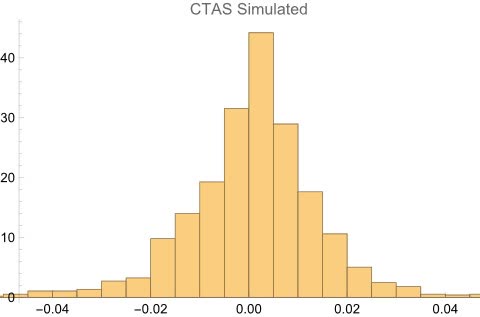
Figure 4- Histogram of simulated price movement (Author)
The results of the Monte Carlo using the derived PDF is summarized in the histogram of returns (figure 5), calculated by generating 2500 possible paths, each representing five years of data.
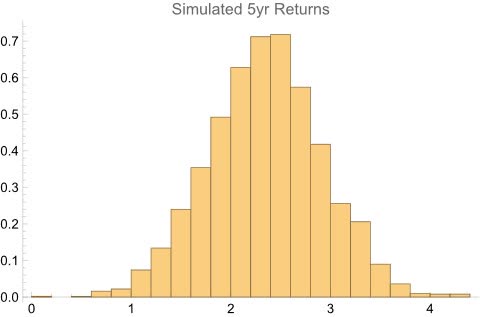
Figure 5 – Monte Carlo Distribution of Returns (Author)
Summary Statistics
| Median 5 Yr Return | Probability of Loss | Probability of Doubling | CAGR |
Present Value |
| 2.35x | 0.84% | 73.3% | 18.6% | $569 |
A stock that has the potential to compound at > 18% with less than a 1% chance of loss after 5 years is a solid candidate for inclusion. But it is critical that we not rely solely on the simulation results. Due diligence is a must.
First, let’s see how well run the company is. According to GuruFocus, CTAS has an excellent ROIC (18.5%), about 8% higher than its cost of capital (WACC). It is also growing owner earnings per share geometrically and its return on equity (ROE) is a fantastic 37.6%. These are all signs of a well run business with shareholder friendly management that excels at capital allocation.
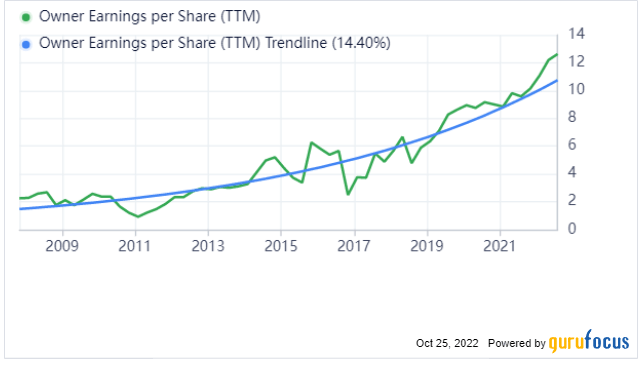
Figure 6 (GuruFocus)
Gross margins of 46% along with the high ROIC indicate good pricing power and therefore the high probability of an enduring competitive edge. So management and moat check the boxes, but is it on sale?
The plots below compare CTAS’s current (orange squares) Price-to-Book Value, Price-to-EPS, Price-to-RPS and Price-to-FCF to its historical norms. We see that it is fairly valued on three of four metrics but slightly expensive versus book value.

Figure 7 – Historical Valuation Metrics vs. Present (Author)
Given the vicissitudes of life (and the Mr. Market’s bipolar nature) we want an entry point with an adequate margin of safety. The log charts indicate CTAS might be selling at about a 20% discount to its historical value, the scatter plots indicate it’s more like fair value. What does a DCF analysis show? Using an 11% discount rate and the FCF growth rate of 19.5% yields a DCF value of $378, slightly below its current price.
Further validating our analysis, SA rates its valuation as an F which (seems a bit harsh) but gives good quality marks.
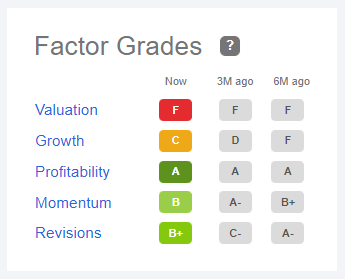
SeekingAlpha
Conclusion
A Bayesian analysis of CTAS indicates a superior risk reward and thus an excellent candidate for inclusion in a portfolio with a five year investment horizon. Further, by all measures, the company appears to be well run, share-holder friendly and processes a strong moat. But with all things considered, we conclude that CTAS is an excellent company that offers a high probability of exceptional returns but is not yet presenting an adequate margin of safety. We will add it to our watch list and wait for a better entry.
Be the first to comment