

StockPlanets/E+ via Getty Images
Thesis
We run a marketplace service (Envision Early Retirement) to help members navigate through conflicting financial priorities. Given the demographics of our members, we think our UTMA (Uniform Transfers To Minors) portfolio might be of interest to the general SA readers too. Readers familiar with our writing know that our family is in the final stage toward early retirement. And our assets are predominately invested in a survival account and an aggressive growth account to isolate risks.
We have a young kid and have created a small UTMA account for him. There are good reasons to consider such an account if you are in a similar stage in life (see the next section for UTMA 101). The main thesis today is to explain why we have resumed buying Apple (NASDAQ:AAPL) in this account.
We have been holding and accumulating AAPL in this account and our other accounts for years (luckily). But we stopped adding (even stopped the DRIP) since 2020 shortly after the post-COVID rally. We are long-term bulls on AAPL and do not plan to sell our shares anytime soon. But we felt the valuation was getting too extreme as you can see from the following chart. Now, with the recent correction, we see it is time to resume adding. The primary considerations are:
- The valuation has normalized now. Actually, at about 22x PE, the valuation is very attractive when its profitability is considered.
- There are plenty of growth catalysts ahead such as the success of its own M2 chips (as detailed in my recent article), the expansion of its paid subscriptions (increased by 165 million across all platforms during the past year alone), and also its share repurchase plans (which will become even more potent at the current normalized valuations.
Seeking Alpha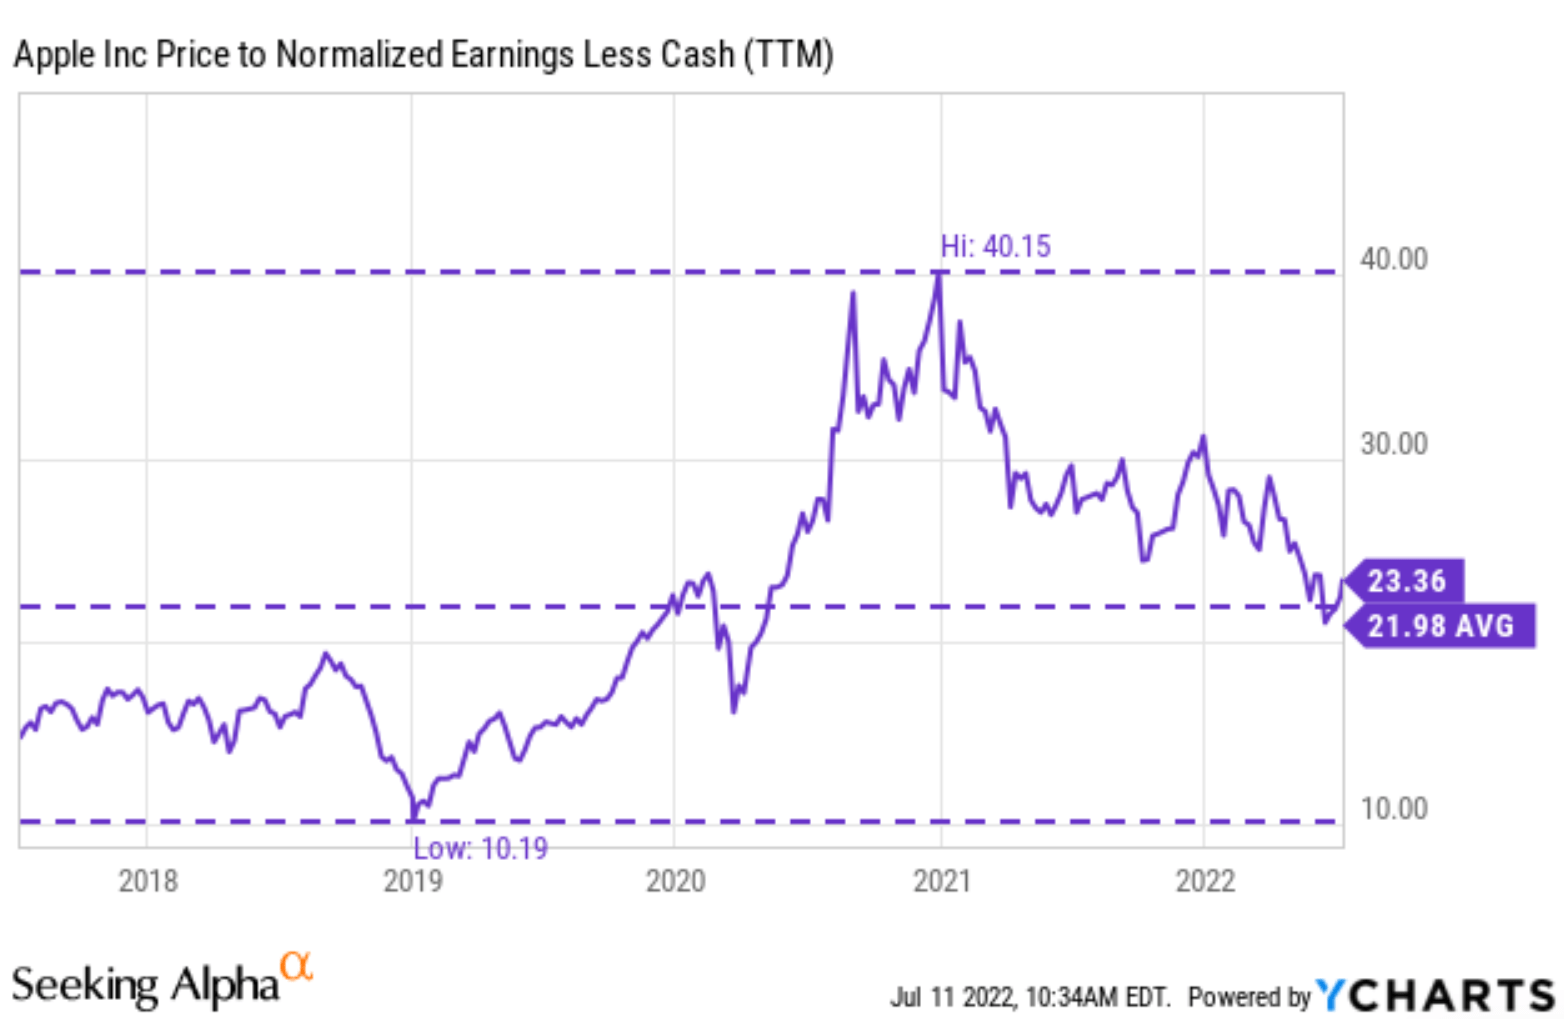
UTMA 101
First and foremost, as always, there are both pros and cons. This page from Fidelity (where our account is) provides an informative discussion. Here I will just discuss the aspects relevant to my investment strategy and the AAPL thesis. I will leave other aspects (tax, impact on financial aid, et al) for the tax professionals.
For us, UTMA offers tax advantages and the time horizon to accommodate more aggressive investment ideas. Income from UTMA accounts is taxed also, but only the part above $2,200 (as of this writing) is taxed at the rates used for estates and trusts. Assuming a 10% annual return (combining dividends and capital gain), the account can accommodate 100% turnover rates and have no tax consequence when the portfolio size is within $22k. Our turnover is nowhere near 100%, but it is substantially higher than our other accounts. And also because of the smaller size of this account, combined with the fact that we do not need the funds in any foreseeable future, we can bet on our more aggressive ideas with an even more concentrated portfolio.
We currently hold only 6 stocks in this account, listed below. We will periodically update when we have changes. Also, we will use today’s prices listed below as the basis for performance tracking going forward. Now we move on to AAPL, the first one on the list.
Author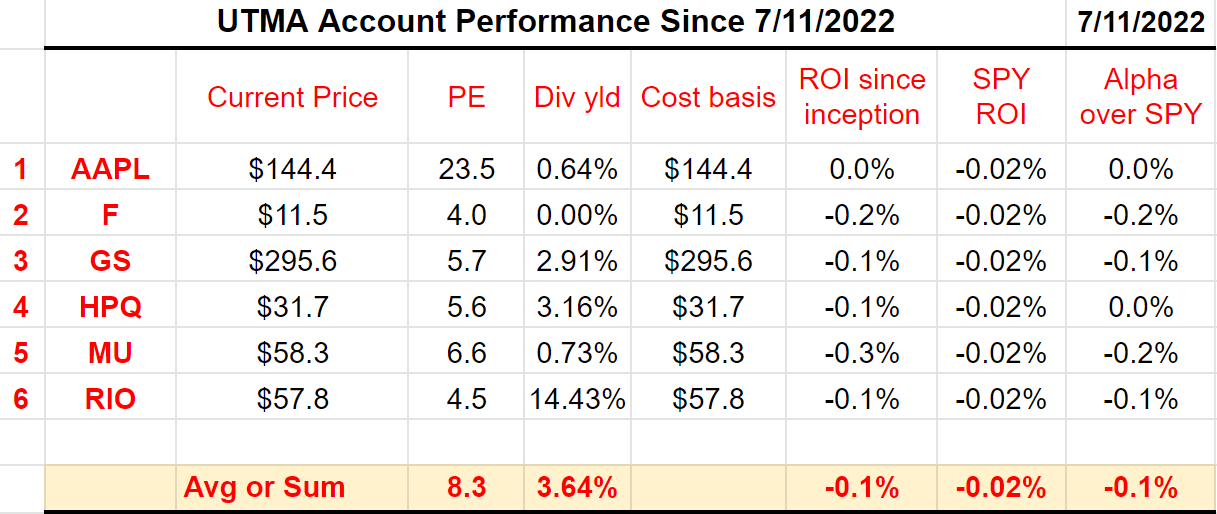
Profitability is off the chart
As you can see from the following chart, AAPL enjoys enviable profitability, even among the FAAMG group. Comparing profitability is usually difficult and subjective, but the picture here is quite one-sided. As measured by ROCE (return on capital employed), AAPL’s ROCE has been consistently and considerably above the entire FAAMG pack by a large margin as you can see from the following chart. Its ROCE is around 150% in the past 5 years since 2016 (even higher if earlier years are included), almost double that of the second most profitable business in this pack, Microsoft (MSFT).
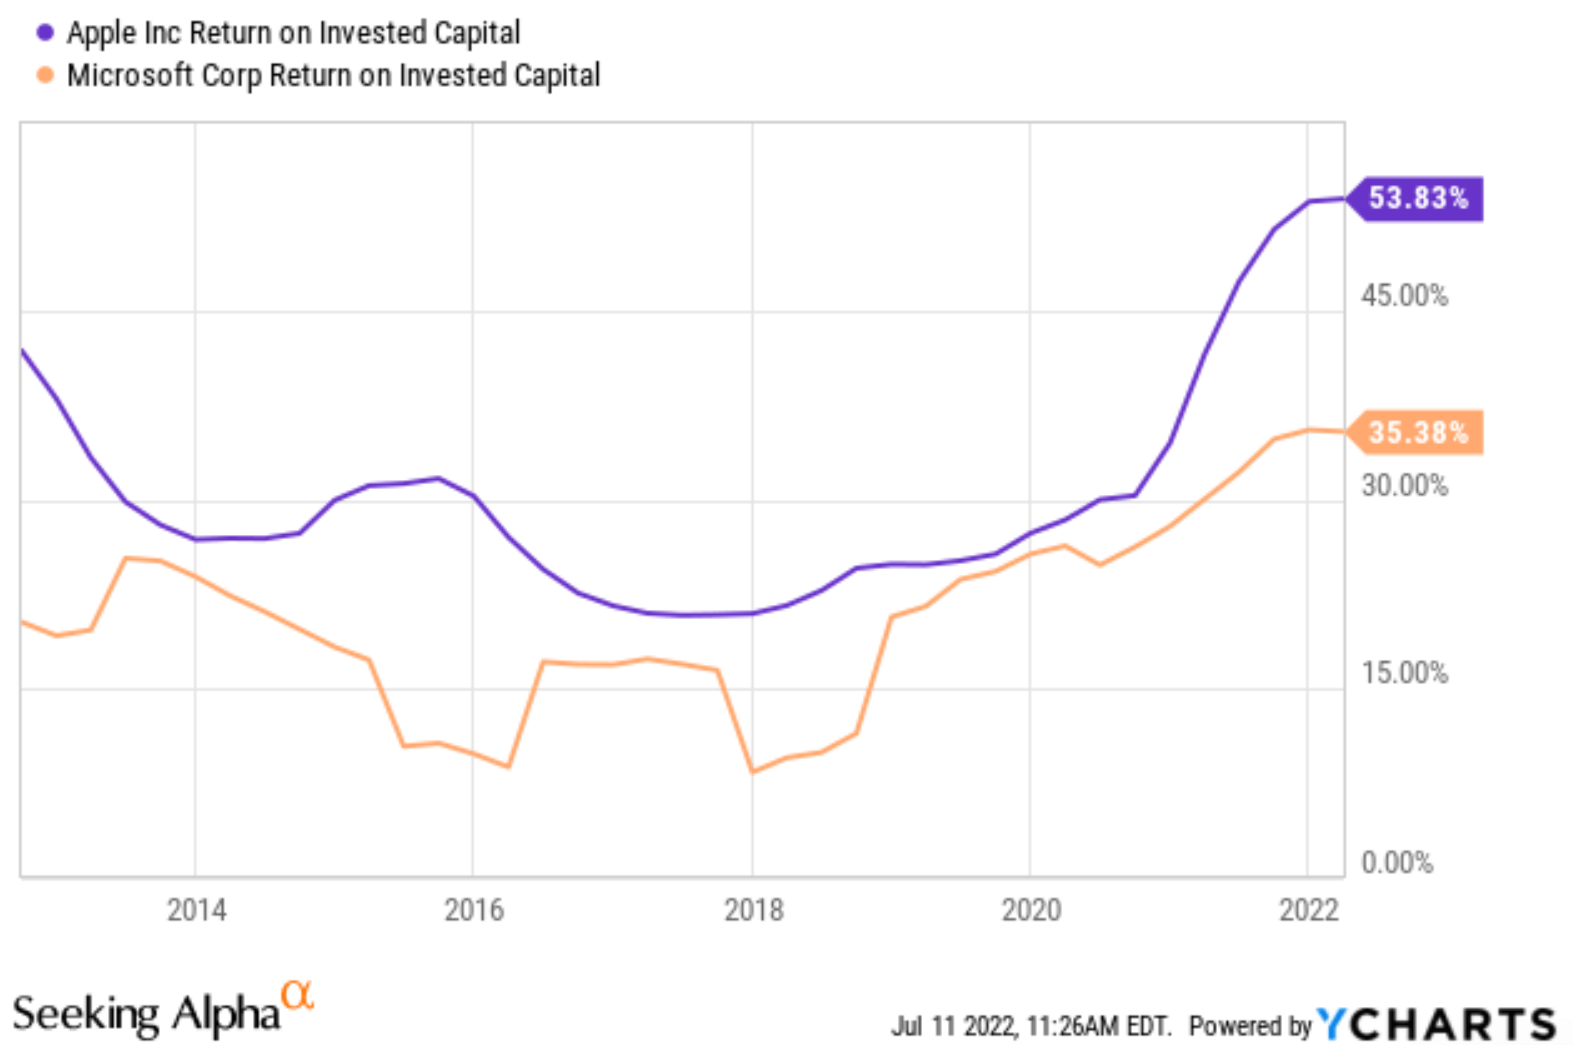
The second chart provides a broader context to this comparison. It shows the comparison between AAPL and MSFT, the second most profitable stock in this pack, in terms of return on invested capital (“ROIC”). Note that ROIC is different from ROCE and the detailed discussion can be found in my free blog article here. But the key point remains. AAPL has consistently delivered far superior profitability above Microsoft. Its ROIC fluctuated from about 20% to 54% in the past decade with an average of 30.3%. In contrast, Microsoft’s ROIC fluctuated between 8.4% and 35% with an average of 20.6%, almost a whole 10% below AAPL.
Author Seeking Alpha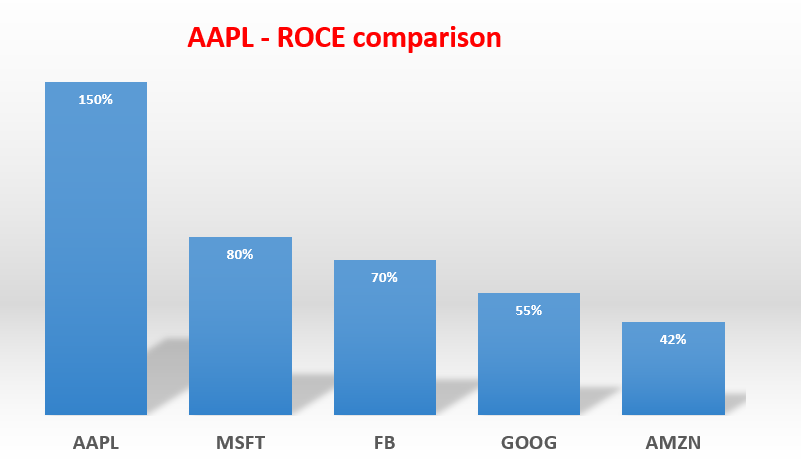
Yet valuation is reasonable
Despite its far superior profitability, AAPL is quite reasonably priced among the FAAMG or even the entire market. Its 23x FY1 PE is not that far above the average PE of ~20x for the S&P 500. But its profitability is more than 7x higher in terms of ROCE. Compared to the FAAMG pack, its PE is close to Alphabet (GOOG) (GOOGL) but lower than MSFT and AMZN.
Compared to its own historical record, it is currently at a reasonable valuation too. In the past ten years, AAPL has been trading between a PE of as low as ~12.8x and as high as 41.8x with a long-term average of 24.5x. Currently, its FW PE of 23.9x is actually slightly below its long-term average of 24.5. And the long-term average is already biased for two reasons. First, the stock was so unjustifiably undervalued in the early part of the decade. And secondly, there’s quite a bit of cash sitting on its balance sheet currently. As a result, when adjusted for cash position, its valuation is even lower as you can recall from the first chart at the beginning of the article.
Furthermore, the cash position and its strong cash generation ability give it the sustainable power for share repurchases. And such repurchase will be very accretive at the current normalized valuations, as discussed next.
Seeking Alpha Seeking Alpha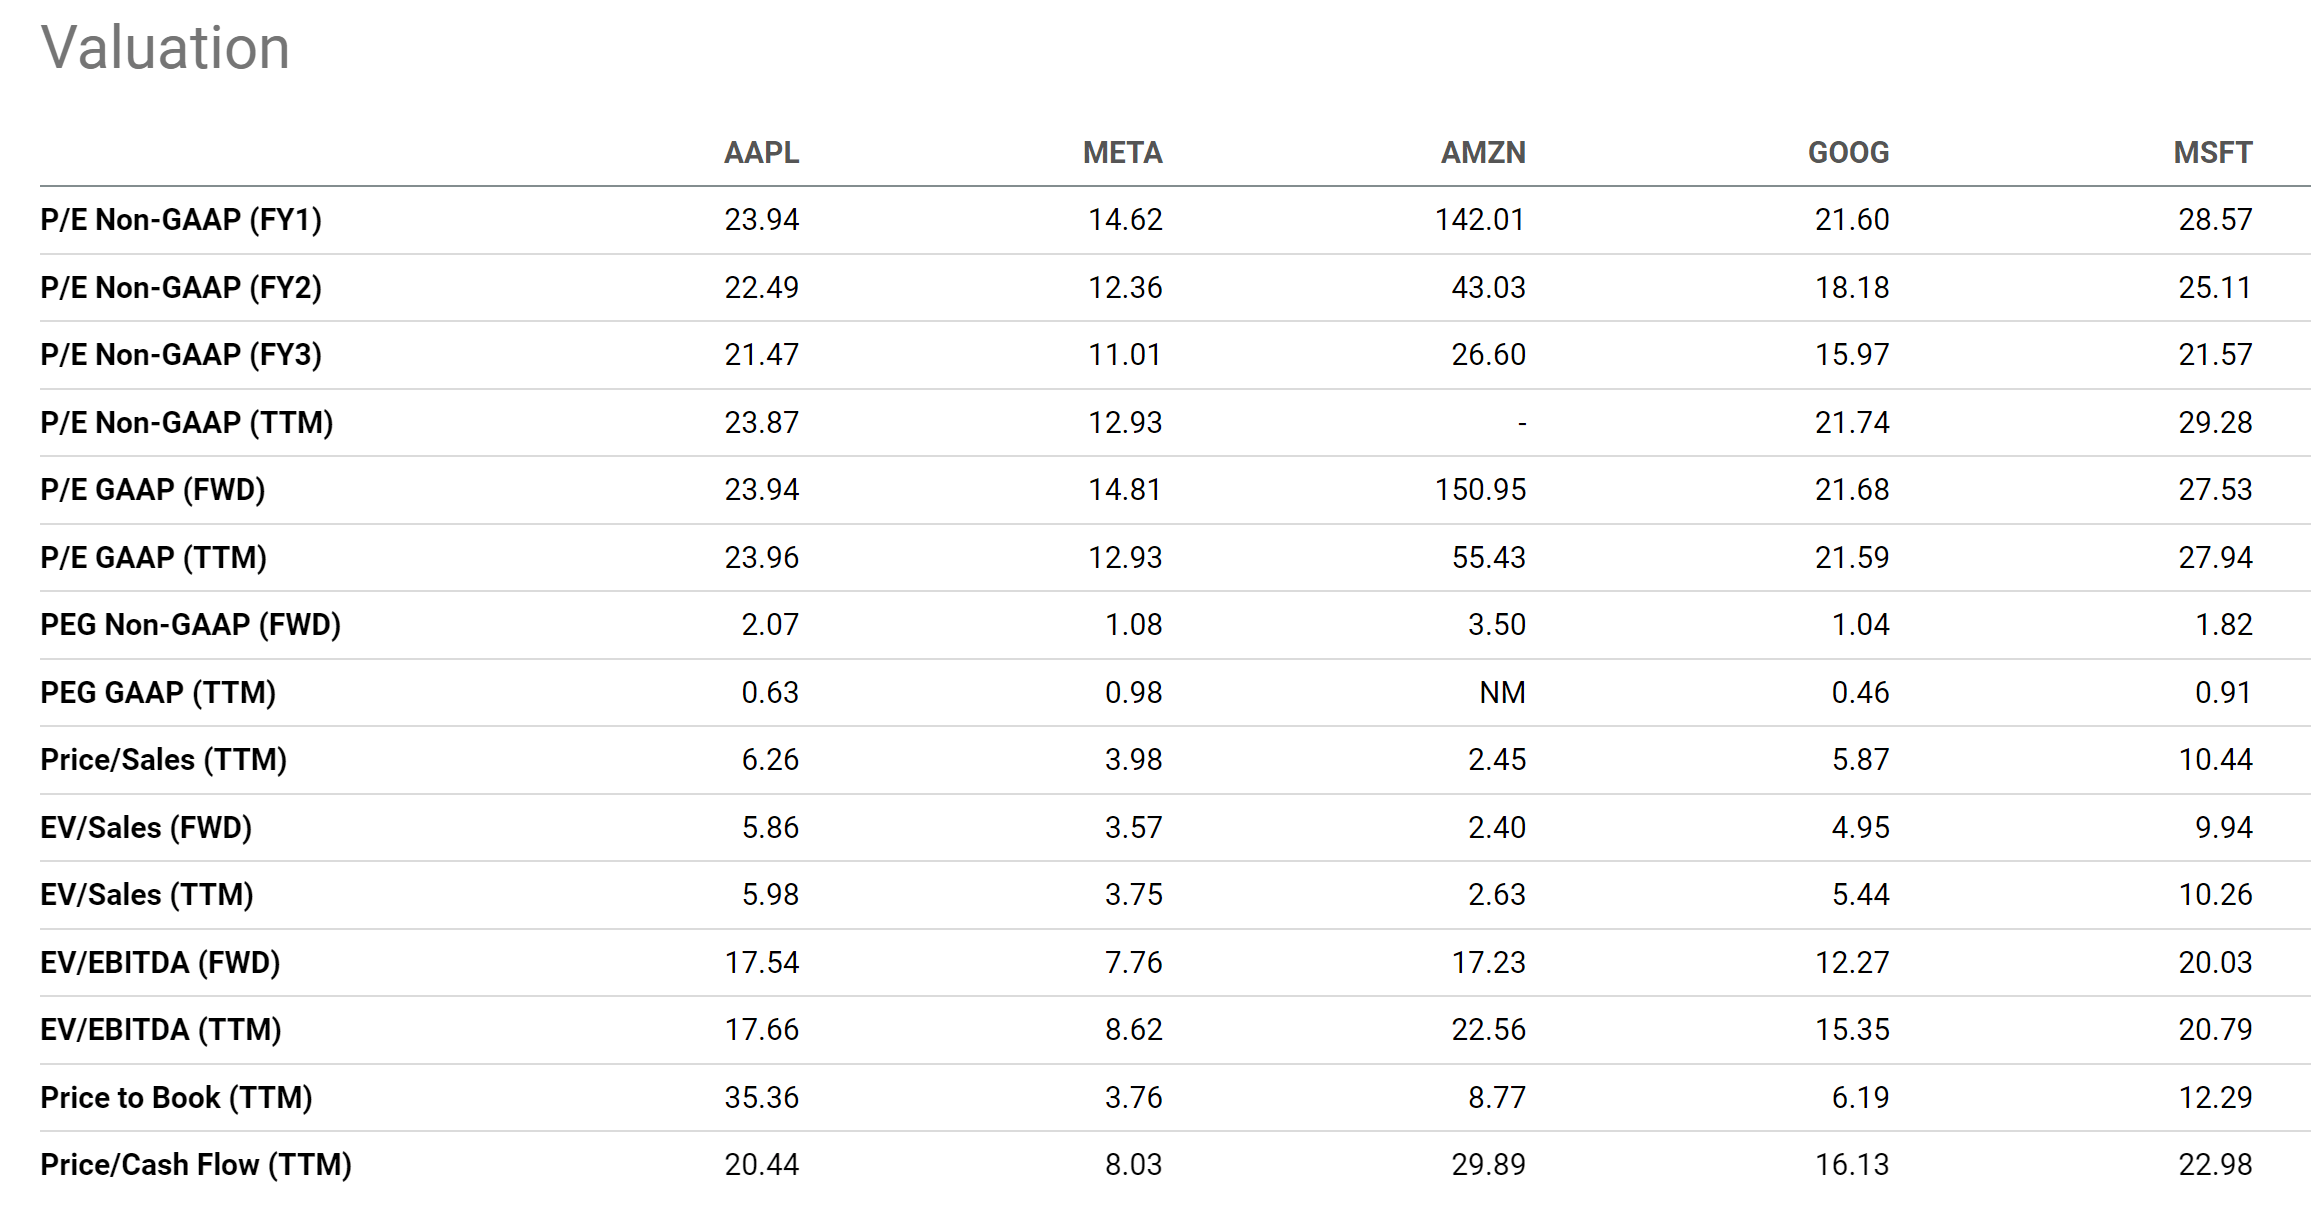

Expected return
AAPL has been consistently (and quite aggressively) buying back its own shares. As you can see from the following chart, its share count stood around 26.3B shares at the beginning of the decade. And now it has only 16.4B shares outstanding. This translates into a whopping 37.6% reduction of its outstanding shares in the past decade. AAPL is committed to shareholder returns and certainly has the cash flow to support it, as its CFO Luca Maestri commented during the earnings report (abridged and emphases added by me):
We returned nearly $27 billion to shareholders during the March quarter. This included $3.6 billion in dividends and equivalents and $22.9 billion through open market repurchases of 137 million Apple shares. We also retired an additional 5 million shares in the final settlement of our 18th ASR. Given the continued confidence we have in our business now and into the future, today our Board has authorized an additional $90 billion for share repurchases, as we maintain our goal of getting to net cash neutral overtime.
Seeking Alpha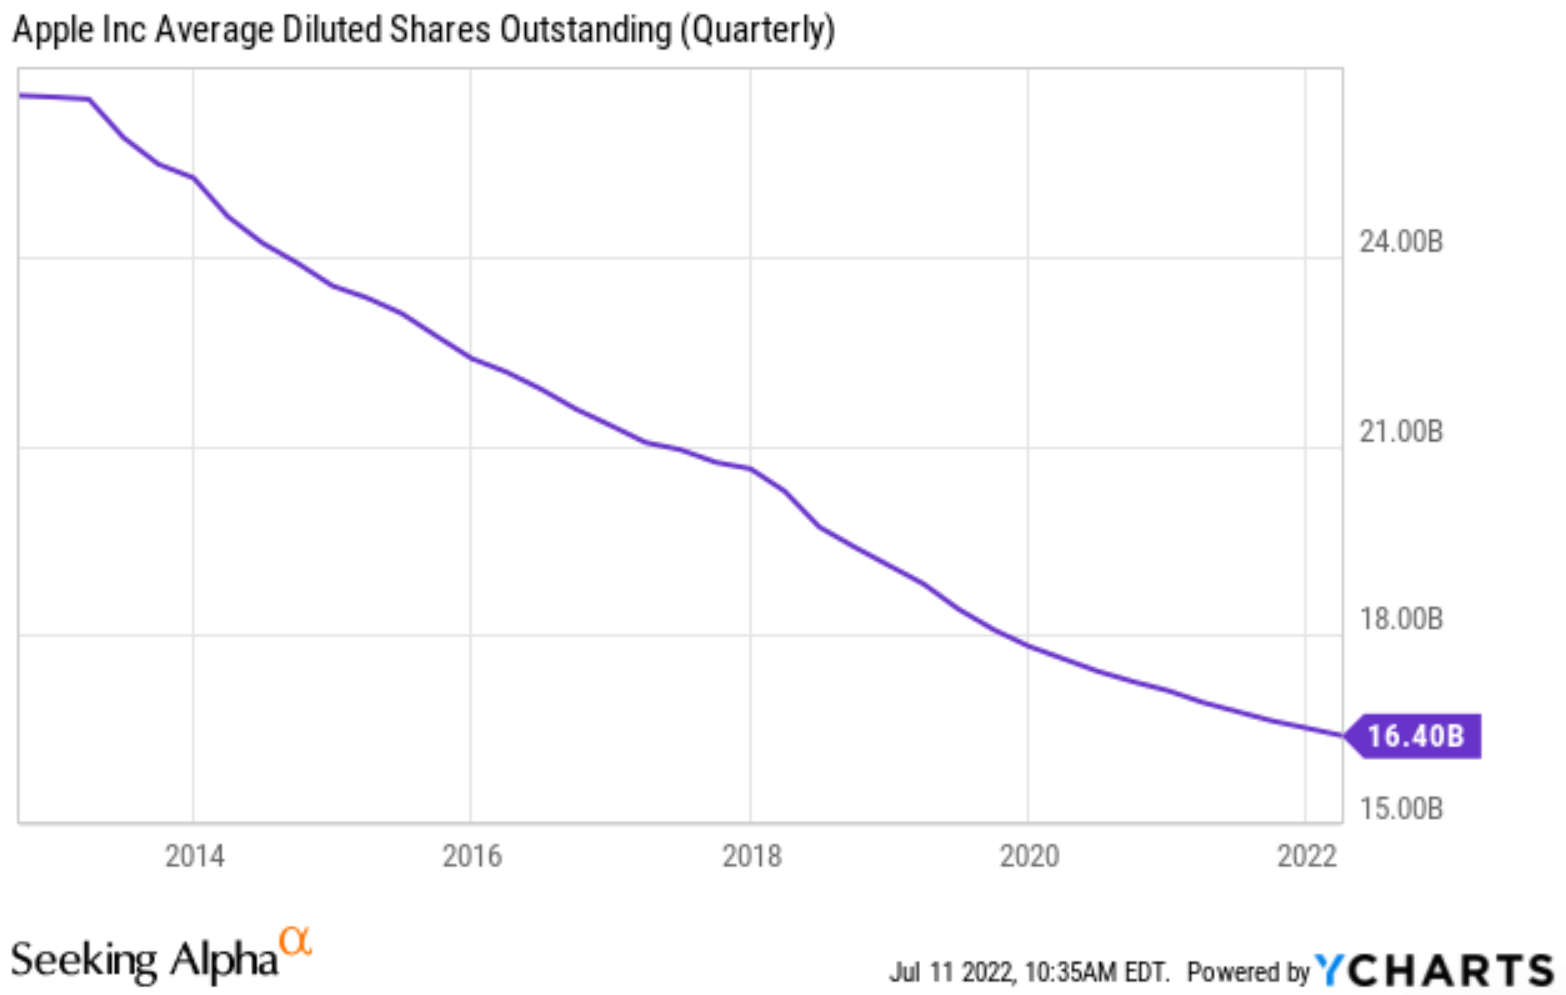
Looking forward, the record $90 billion for share repurchases will be highly accretive to shareholder returns at the current valuations. The table below summarizes my projections for the shareholder returns in the next 5 years. The table is made under a few key assumptions which I consider reasonable (or even conservative) as detailed in my earlier articles:
It assumes AAPL distributes the $90B as a constant percentage of its operating cash flow, and the percentage is taken to be 78%, the average in recent years. It also assumes that AAPL profits grow at an 8% CAGR according to consensus estimates. It also assumes an average repurchase price of 22.5x of its operating cash (and the current multiple is only 20.4x).
Under these assumptions, you can see that the total projected return is about 47% in the next 5 years.
Author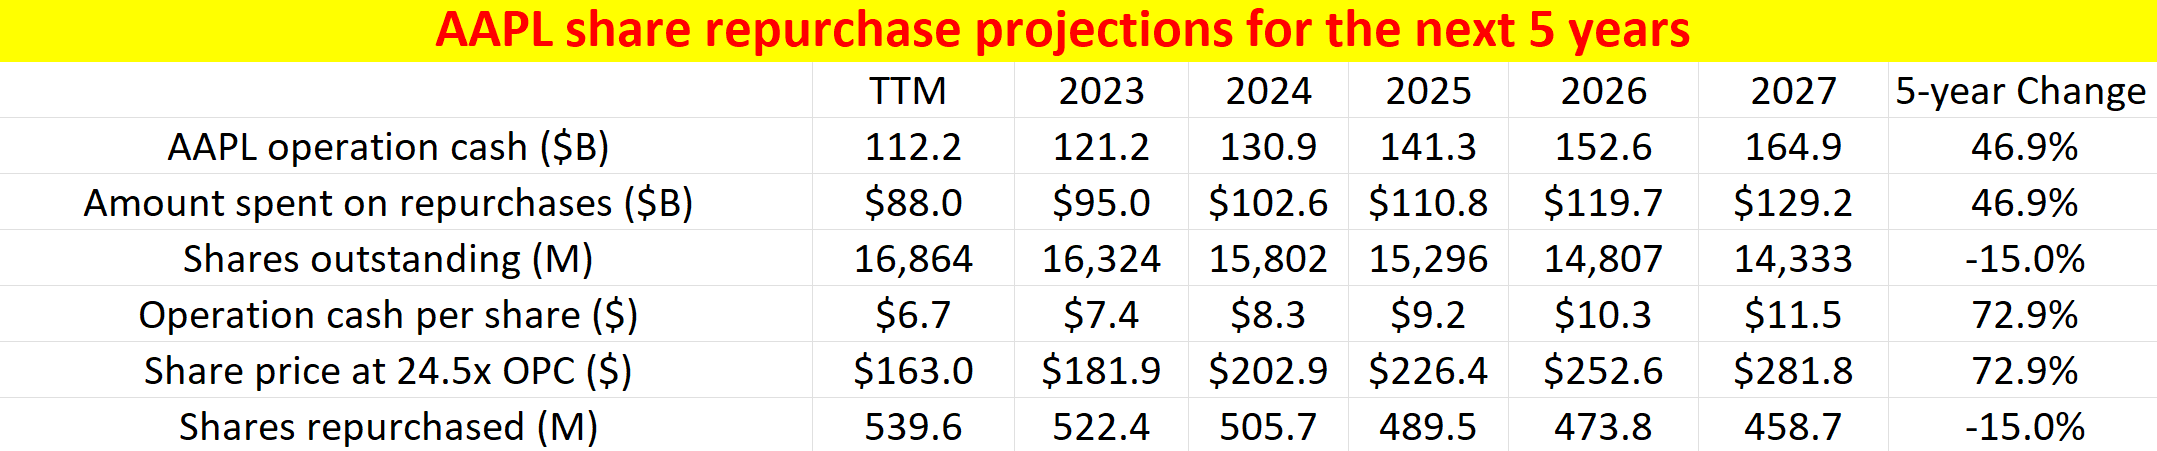
Final Thoughts and Risks
Other key growth catalysts include the success of its own M2 chips and the expansion of its paid subscriptions.
I see both developments as strong catalysts to further strengthen its ecosystem and keys to unlocking its next new growth cycle. The M2 chips have already started to further the differentiation of its already powerful product lineups ranging from iPad to MacBooks as argued in my earlier article. The AAPL’s ecosystem has reached a mind-boggling scale. The installed base of active devices reached a record of 1.8 billion units worldwide. Paid subscriptions increased by 165 million last year and reached 785 million. Services revenues, which tend to enjoy higher margin and better recurrence, went up 24% in the last quarter. Going forward, I see these catalysts to accelerate its growth in key areas like cloud, music, video, and also payment services.
Finally, risks. I do not see any structural risks to AAPL. There might be a remote chance for an antitrust risk. In the near term, a recession is a tangible risk. The global supply chain disruptions are another near-term risk. These disruptions have caused about $4B to $8B of negative impacts as described by Citigroup analyst Jim Suva during the earnings report below (slightly edited by me). And these disruptions could persist longer.
Tim and your entire company have done a great job at navigating through all the issues in the past several years whether it be COVID, power outages, trade wars, shipping challenges and all that. When we hopefully someday get past all of these… do you start to reconsider the way you do the supply chain albeit just-in-time ordering and outsourcing so much of your chips? Or do you actually consider like holding more buffer inventory internally, because right now letting $4 billion to $8 billion go away it’d be nice to have that to be able to sell.
Be the first to comment