

Shahid Jamil
Wamsi Mohan of Bank of America (BAC) came out on 9/29 and cut his rating on shares of Apple (NASDAQ:AAPL) to neutral from buy and lowered his price target from $185 to $160. AAPL isn’t digesting the news well, and shares dropped -4.91% during trading, finishing the day at $142.48, -$7.36 lower. This pulled the market down as S&P 500 index funds such as the SPDR S&P 500 Trust ETF (SPY) fell by more than -2%, closing the day at $362.79, down -$7.74. Mr. Mohan lowered his fiscal 2023 estimates to $379 billion of revenue and $5.87 in EPS compared to the $412 billion in revenue and $6.46 in EPS from analyst estimates. His reasoning is that the iPhone 14 cycle could be weaker than expected and that he sees revenue from iPhones, iPads, and Services coming in below consensus estimates for 2023. This comes after a report that AAPL is pulling back from its plans to boost iPhone production due to weaker than expected demand.
Currently, 41 analysts have provided EPS estimates, and 40 analysts have provided revenue estimates to make up the consensus. Mr. Mohan is working with the information he has available to make his predictions, and only time will tell if his forecast is accurate. Personally, I believe the market has overreacted to the downgrade as AAPL has not released an official statement or provided revised long-term guidance. Mr. Mohan’s price target is also $160, which is a 12.21% ($17.41) increase from where shares closed today. Everything from now until earnings is speculation unless it comes from AAPL themselves. Another analyst had indicated that AAPL had asked its manufacturing partner to switch the production lines of its iPhone 14 and iPhone 14 Pro models due to demand trends. I believe the decline in AAPL should be welcomed and not feared by the investment community, as you’re getting a better price point to acquire shares today than yesterday and the day before.
Seeking Alpha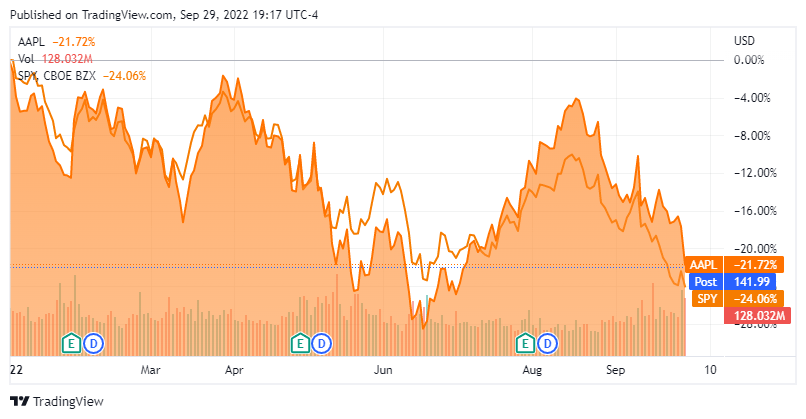
Earnings History and why Apple shouldn’t have a problem beating earnings estimates in the future
Going back 20 quarters, AAPL hasn’t missed on the consensus EPS estimates and missed the consensus revenue estimates twice. In 90% (18/20) of the past 20 earnings reports, AAPL has beaten the consensus EPS estimates by a range of $0.01 to $0.41. In only 10% of the earnings reports did AAPL come in-line with the consensus estimates for EPS. On the revenue side, AAP: has beaten the consensus estimate 18 out of the last 20 quarterly reports (90%). AAPL’s revenue beats have been as small as $223.65 million and as large as $12.3 billion. Only 2 times (10%) of the last 20 reports did AAPL miss revenue estimates. In Q4 of 2021, AAPL missed the consensus revenue estimate by $1.62 billion, and in Q3 of 2022, AAPL missed by $9.43 million.
While the market emphasizes analyst estimates, I don’t, as I care more about the guidance a company gives and its ability to hit its targets. These analysts don’t work for AAPL, and are making projections based on the information AAPL has provided through its financial statements, press releases, and earnings calls. AAPL’s management team has a much better beat on their financial projections, and if they project X, I would rather see that AAPL is able to achieve and possibly exceed X, rather than meeting an arbitrary number an external analyst projected. In Q4 of 2021, when AAPL missed the consensus revenue estimate by $1.62 billion, their revenue increased YoY by 28.84%, increasing by $18.66 billion from $64.7 billion to $83.36 billion.
Seeking Alpha
Over the previous 11 quarters, AAPL has only experienced 1 YoY decline on its earnings from continuing operations line item. In Q1, which is their December quarter, AAPL has experienced YoY growth of $6.52 billion (29.32%) in 2020, and $5.88 billion (20.43%) in 2021. The lowest amount of positive YoY growth has come in March of 2022 at 5.84% or $1.38 billion. In June of 2022, AAPL experienced its only YoY decline in earnings from continuing operations in the previous 11 quarters of -$2.3 billion or -10.59%. AAPL still generated $19.44 billion in earnings from continuing operations over this 3-month period, which is more than most companies generate in an entire year. Even though AAPL saw a YoY decline, it still beat earnings estimates by $0.04 per share.
Seeking Alpha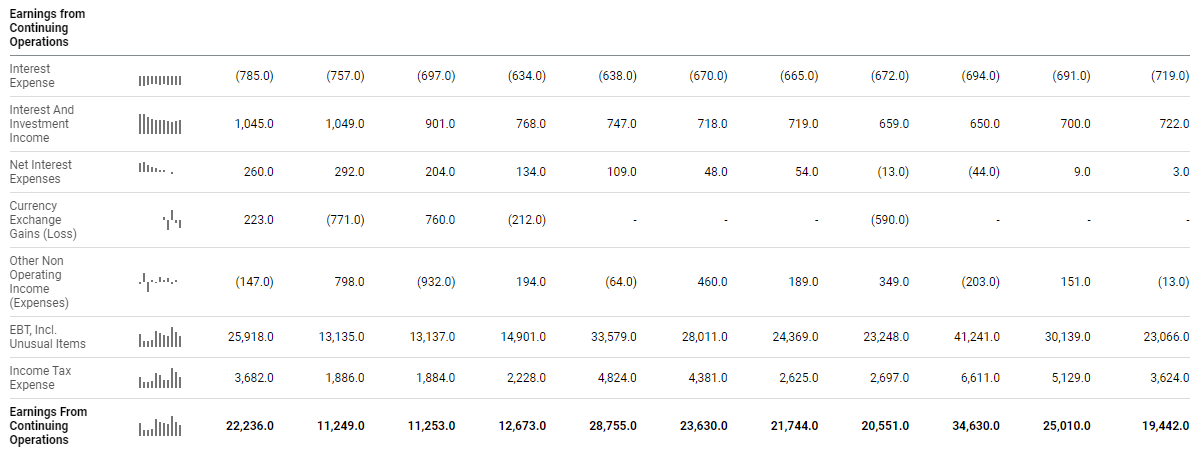
AAPL continues to have an easy time beating the EPS consensus because they are buying back tens of billions in shares each quarter. Over the past 11 quarters, AAPL has reduced its share count by 1.44 billion or -8.24%. In Q3 2022, which was AAPL’s June Quarter, AAPL repurchased 112.2 million shares, or .69% of its shares outstanding. This added $0.01 to its EPS of 0.7%.
Seeking Alpha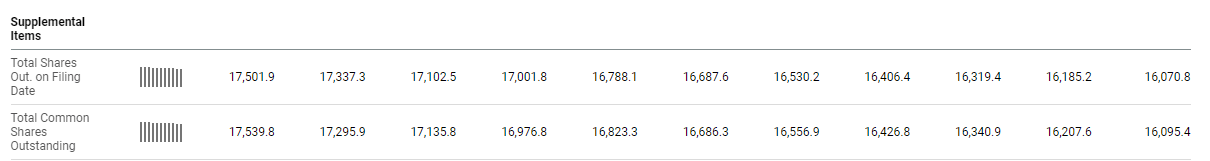
Since Q2 of 2021, AAPL hasn’t repurchased less than $20 billion worth of shares. In Q3 alone, AAPL repurchased $21.7 billion worth of shares on the open market. Throughout Q3, there were 62 trading days, meaning that AAPL purchased the equivalent of $350 million worth of AAPL shares daily. Shares of AAPL closed at $136.72 on 6/30/22, and in Q3, they have gone as high as $175, and are back down to $142.48. Looking at AAPL’s history, I don’t think it’s unreasonable to speculate that they will have repurchased $20 billion worth of shares at an average price of $150. If this assumption is close to being accurate, then AAPL will have repurchased 133.33 million shares in Q4.
Apple doesn’t just have to grow its earnings to increase its EPS, it can manufacture higher EPS by repurchasing shares. APPL hasn’t provided any reason to doubt that they will miss earnings in 2022 or that buybacks will stop. This is a company that is projected to generate around $100 billion in profit for its 2022 fiscal year. AAPL is the largest generator of profits and FCF, and I think the market is overreacting as investors shouldn’t worry unless AAPL issues lower future guidance.
Apple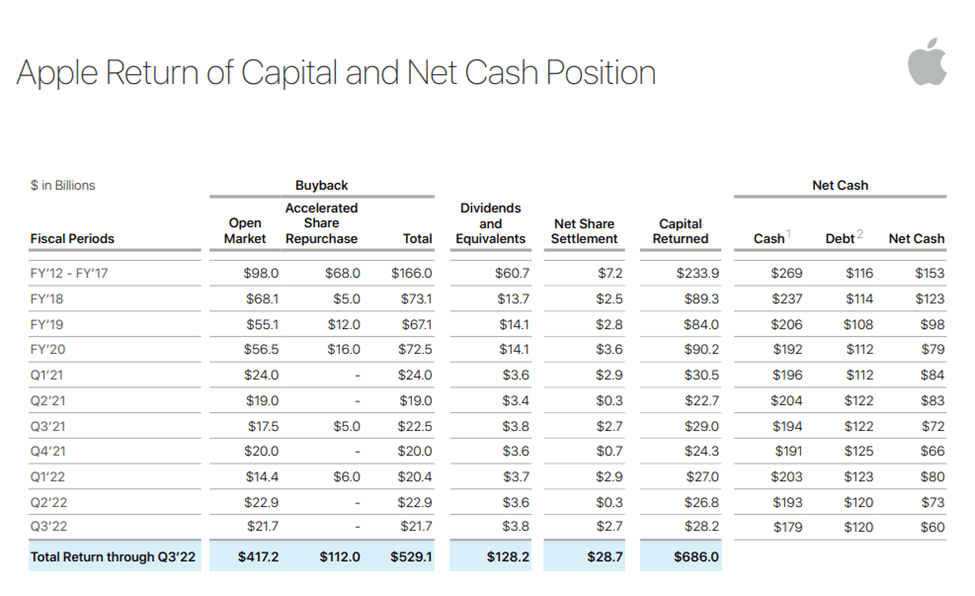
How the market is valuing Apple compared to its peers and defensive plays
Normally I would just compare Apple to its peer group of Microsoft (MSFT), Alphabet (GOOGL), Amazon (AMZN), Meta Platforms (META), and Tesla (TSLA), as these are the largest companies in the market. I wanted to go beyond big tech and add some defensive stocks that investors flock to during periods of uncertainty. In addition to the usual suspects, I will add Kimberly-Clark (KMB), Procter & Gamble (PG), The Coca-Cola Company (KO), and PepsiCo (PEP) to the valuation comparison.
From a P/E perspective, AAPL trades at 23.36 P/E, placing them in the middle of these companies. The market is valuing AAPL similarly to consumer staple companies as its P/E is lower than PEP and KO.
|
Price to Earnings |
|||
|
Ticker |
Market Value Per Share |
Earnings Per Share |
P/E Ratio |
|
META |
$136.41 |
$12.22 |
11.16 |
|
GOOGL |
$97.42 |
$5.45 |
17.88 |
|
PG |
$128.70 |
6 |
21.45 |
|
KMB |
$114.98 |
5.3 |
21.69 |
|
AAPL |
$142.48 |
$6.10 |
23.36 |
|
MSFT |
$237.50 |
$9.70 |
24.48 |
|
PEP |
$166.61 |
6.68 |
24.94 |
|
KO |
$56.57 |
2.21 |
25.60 |
|
TSLA |
$268.21 |
$9.33 |
28.75 |
|
AMZN |
$114.80 |
$1.14 |
100.70 |
Steven Fiorillo, Seeking Alpha
The Price to FCF metric is a longtime favorite of mine that has recently become popular as FCF has become important again. FCF is often looked at as one of the best measures of profitability as FCF excludes the non-cash expenses of the income statement and includes spending on equipment and assets as well as changes in working capital from the balance sheet. To some investors, FCF is more important to analyze than net income because it’s harder to manipulate as it is a true indication of the company’s cash. FCF is also the pool of capital that companies can utilize to repay debt, pay dividends, buy back shares, make acquisitions, or reinvest in the business. With every investment, you’re paying the current value for a company’s present and future cash flow.
In the TTM, AAPL has generated $107.58 billion of FCF, which is vastly more than every other company selected and in the market. AAPL is trading at 21.28x its FCF, and when I look at this compared to consumer staples, I can’t think of a single reason why AAPL should trade for a lower FCF multiple than KMB, PG, KO, or PEP. A 21.28x FCF multiple almost places AAPL in the value stock category. At this point, the real question is would you rather pay 21.28x for the FCF that AAPL produces or 36.28x for the FCF that PEP produces?
|
Price to Free Cash Flow |
|||
|
Ticker |
Market Cap |
Total Free Cash Flow |
Price to Free Cash Flow Multiple |
|
AMZN |
$1,169,530,771,089.00 |
-$29,784,000,000.00 |
-39.27 |
|
META |
$366,608,432,522.00 |
$35,830,000,000.00 |
10.23 |
|
GOOGL |
$1,274,379,247,847.00 |
$60,697,000,000.00 |
21.00 |
|
AAPL |
$2,289,758,966,538.00 |
$107,582,000,000.00 |
21.28 |
|
KMB |
$38,819,813,187.00 |
$1,810,000,000.00 |
21.45 |
|
PG |
$307,013,714,020.00 |
$13,567,000,000.00 |
22.63 |
|
KO |
$244,644,261,210.00 |
$10,242,000,000.00 |
23.89 |
|
MSFT |
$1,771,248,875,000.00 |
$65,149,000,000.00 |
27.19 |
|
PEP |
$229,935,796,082.00 |
$6,338,000,000.00 |
36.28 |
|
TSLA |
$840,427,961,924.00 |
$6,937,000,000.00 |
121.15 |
Steven Fiorillo, Seeking Alpha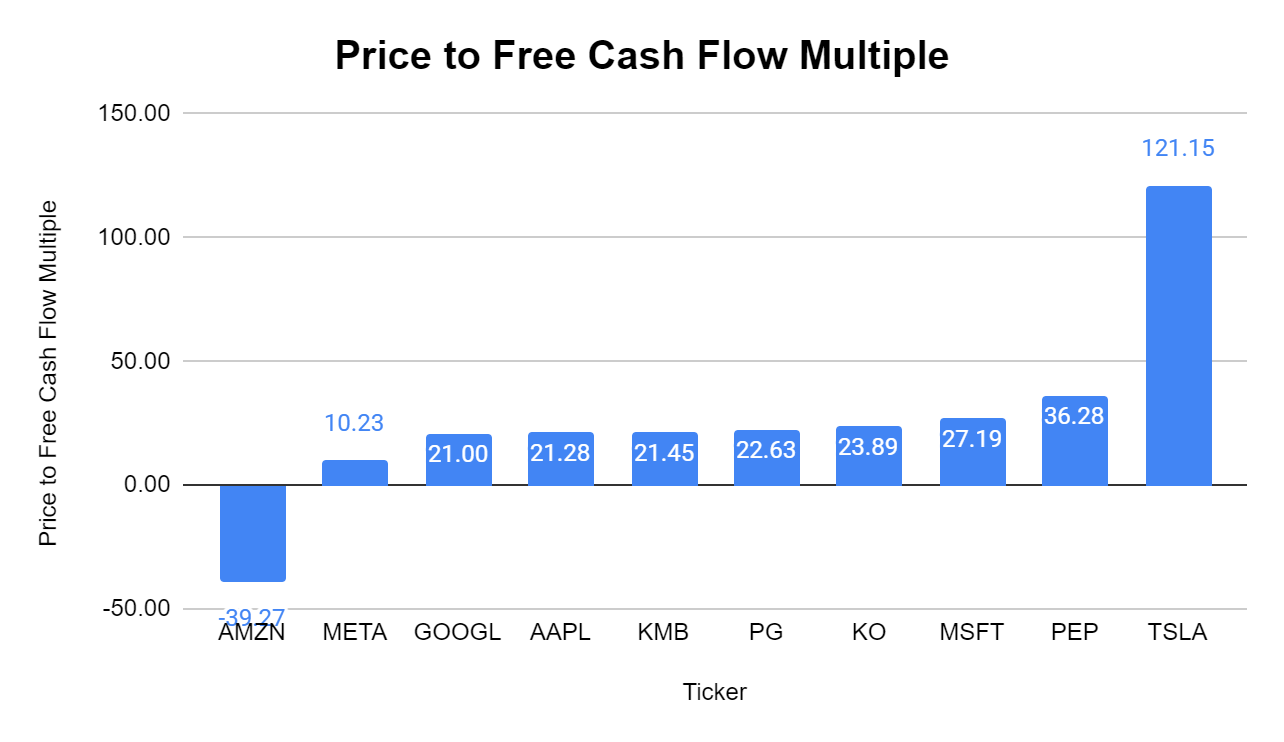
Looking at AAPL’s FCF growth, I would rather pay for AAPL’s FCF than any of the consumer staples I added in the comparison tables. PEP has grown its FCF by $1.1 billion since the 2018 fiscal year, and KO has grown its FCF by $4.16 billion. The market has placed a 36.28x multiple on PEP’s FCF and a 23.89x multiple on KO’s. AAPL has grown its FCF by $54.09 billion, which is more than 10x KO’s and 50x PEP’s, yet the market has placed a lower multiple on AAPL’s FCF at 21.28x. AAPL looks significantly undervalued compared to what many consider defensive plays. I think the narrative needs to change to companies that consistently generate large amounts of FCF as defensive plays during an inflationary period, rather than specific sectors. The best defense against uncertainty is generating as much FCF and net income as possible.
|
Three Fiscal Years & TTM Free Cash Flow Growth |
|||||
|
Ticker |
2018 FCF |
TTM FCF |
FCF Growth |
Growth % |
|
|
AMZN |
$9,399,000,000.00 |
-$29,784,000,000.00 |
-$39,183,000,000.00 |
||
|
KMB |
$2,093,000,000.00 |
$1,810,000,000.00 |
-$283,000,000.00 |
-13.52% |
|
|
PEP |
$5,237,000,000.00 |
$6,338,000,000.00 |
$1,101,000,000.00 |
21.02% |
|
|
PG |
$11,895,000,000.00 |
$13,567,000,000.00 |
$1,672,000,000.00 |
14.06% |
|
|
KO |
$6,079,000,000.00 |
$10,242,000,000.00 |
$4,163,000,000.00 |
68.48% |
|
|
TSLA |
-$221,000,000.00 |
$6,937,000,000.00 |
$7,158,000,000.00 |
||
|
META |
$16,359,000,000.00 |
$35,830,000,000.00 |
$19,471,000,000.00 |
119.02% |
|
|
MSFT |
$32,253,000,000.00 |
$65,149,000,000.00 |
$32,896,000,000.00 |
101.99% |
|
|
GOOGL |
$22,832,000,000.00 |
$60,697,000,000.00 |
$37,865,000,000.00 |
165.84% |
|
|
AAPL |
$53,497,000,000.00 |
$107,582,000,000.00 |
$54,085,000,000.00 |
101.10% |
|
Steven Fiorillo, Seeking Alpha
Conclusion
AAPL is still holding up better than the S&P 500 as its declined -21.72% in 2022 compared to -24.06% for SPY. I am a big believer in owning AAPL for the long haul and adding to the position when opportunities present themselves. I think this move to the downside was overdone, but AAPL is still off its June lows and could trend lower going into earnings. I think now is a great time to add shares of AAPL and if it goes lower, just add more shares if you can. In 2021 AAPL generated $365.82 billion in revenue, $152.84 billion in gross profit, and $94.68 billion in net income. For the first 9 months of its 2022 fiscal year, AAPL has generated $304.18 billion in revenue, $132.69 billion of gross profit, and $79.08 billion of net income. When AAPL releases earnings at the end of October, we’re going to see tens of billions in buybacks, and probably the largest revenue and profitable year in AAPL’s history. If you believe the markets will rebound sometime in the future, it’s hard not to be bullish on the market’s most profitable company and arguably the greatest consumer product company in the world.
Be the first to comment