

Nikada/iStock Unreleased via Getty Images
Apple just unveiled updates for the iPhone, AirPods, and Apple Watch. There are quite a few upgrades and additions to the iPhone’s capabilities, most notably the addition of satellite communications for emergency services. The company reported record FY Q3 results on July 28th, beating expectations on earnings but slightly missing on revenues. The shares rose almost 14% in the 2 ½ weeks following the earnings report, but have since fallen back to a level below the share price on July 28th.
The shares are currently trading at about 15.5% below the 12-month-high closing price of $182.01 on January 3rd. AAPL has a 12-month total return of 0.1% vs. -21.3% for the NASDAQ 100 (QQQ) and -10.6% for the S&P 500 (SPY). For the company to have maintained its share price as the market declined is a testament to the durability of consumer demand for Apple products.
Seeking Alpha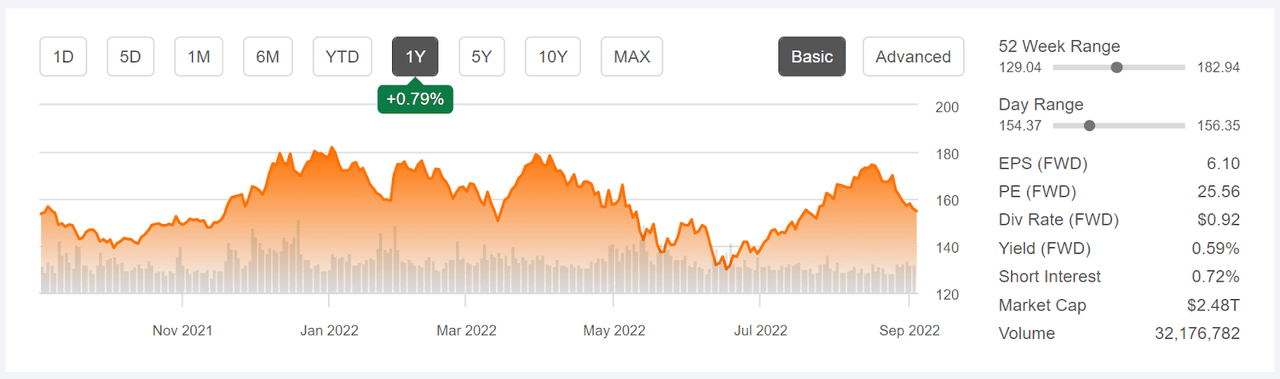
12-Month price history and basic statistics for AAPL (Source: Seeking Alpha)
AAPL earnings have maintained an upward trend over the last several years. The company even managed to maintain EPS through the worst of the COVID months and in the face of supply chain constraints and chip shortages. This highlights some of the durability in Apple’s value proposition. People use Apple’s products and services whether they are commuting or working from home, and when they are not working perhaps as much as when they are working. The consensus outlook for EPS growth over the next 3 to 5 years is a modest 11.6% per year.
ETrade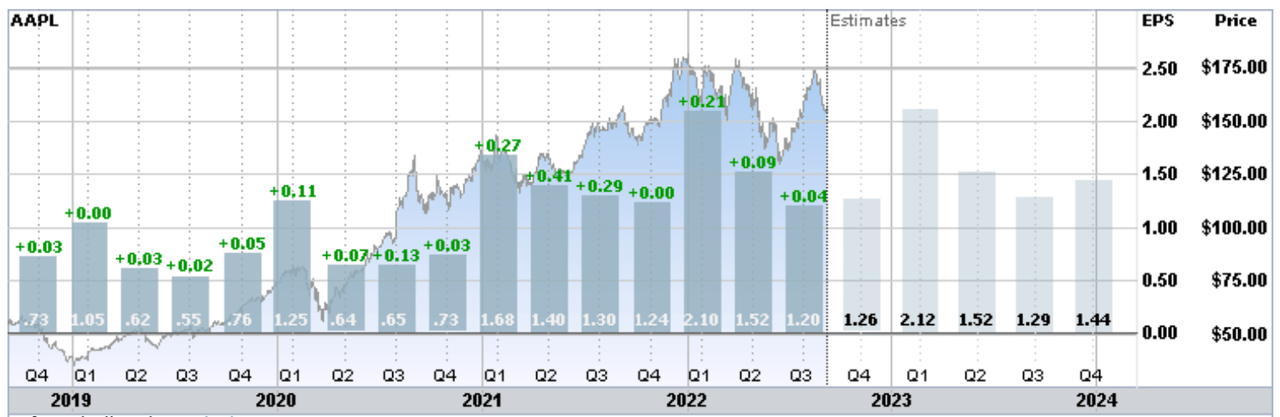
Historical (4 years) and estimated future quarterly EPS for AAPL. Green values are amounts by which EPS beat expectations (Source: ETrade)
With a forward P/E of 25.6 and a TTM P/E of 25.5, AAPL is relatively expensive compared to values over the past 10+ years. Over this period, AAPL’s P/E has often had a P/E in the range of 10 to 12. Since the beginning of 2017, however, there has been an upward trend in the valuation, as the company grew its way out of a slump.
Along with looking at fundamentals when analyzing a stock, I rely on two forms of consensus outlooks. The first is the well-known Wall Street analyst consensus rating and price target. The second is a probabilistic outlook that is calculated from the prices of call and put options on a stock, the market-implied outlook. The price of an option on a stock is largely determined by the market’s consensus estimate of the probability that the stock price will rise above (call option) or fall below (put option) a specific level (the option strike price) between now and when the option expires. By analyzing the prices of call and put options at a range of strike prices, all with the same expiration date, it is possible to calculate a probabilistic price forecast that reconciles the options prices. This is the market-implied outlook and represents the consensus view among buyers and sellers of options. For a deeper explanation and background, I recommend this monograph published by the CFA Institute.
Wall Street Consensus Outlook for AAPL
ETrade calculates the Wall Street consensus outlook for AAPL by aggregating the views of 28 ranked analysts who have published ratings and price targets over the past 3 months. The consensus rating is a buy and the consensus 12-month price target is 19.7% above the current share price. Research shows that the consensus price target tends to have predictive value, as long as the dispersion among the individual price targets is not too high. In this case, the dispersion is somewhat high. As a rule of thumb, I discount the consensus price target when the highest price target is more than twice the lowest. For AAPL, the ratio is 1.6 ($220/$136). Compare this ratio, for example, to my recent analysis of Broadcom, with a ratio of 1.25.
ETrade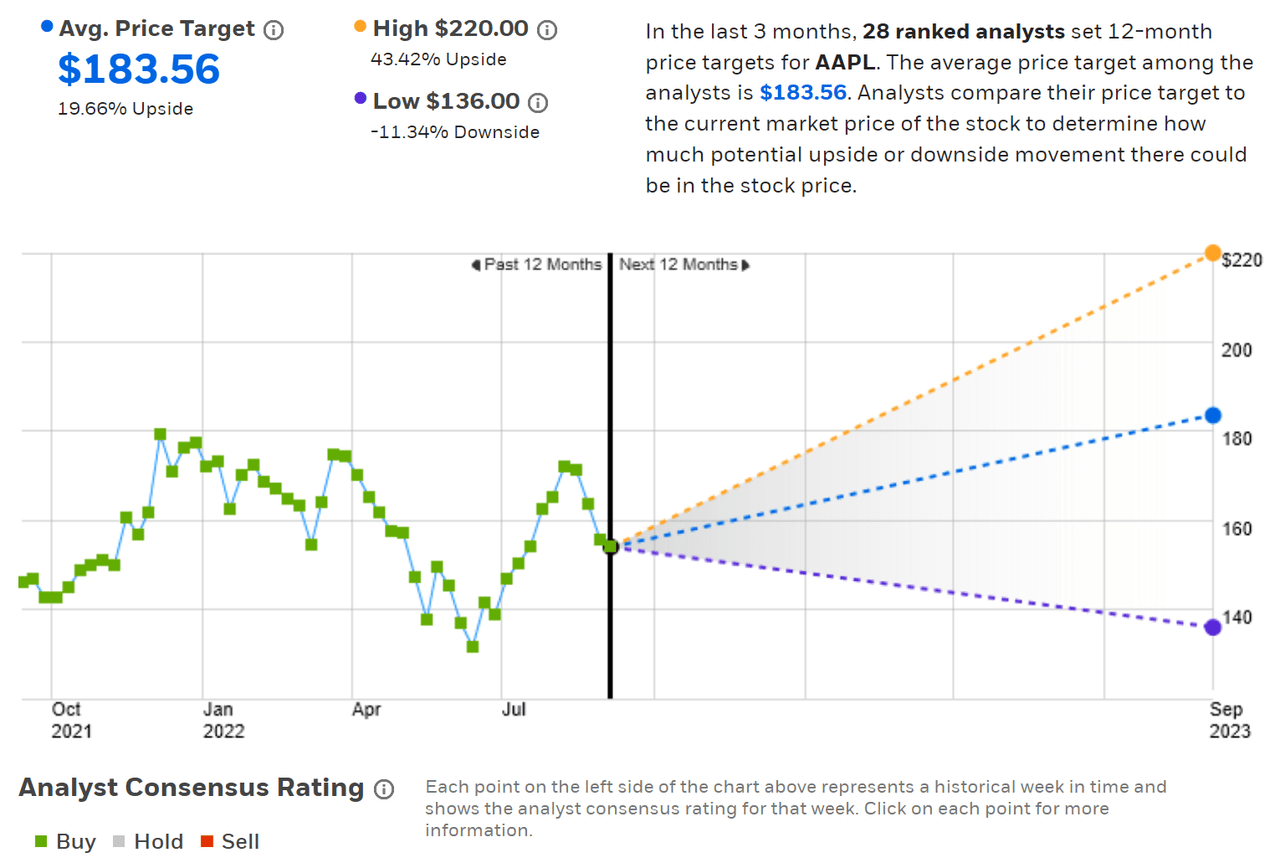
Wall Street analyst consensus rating and 12-month price target for AAPL (Source: ETrade)
Seeking Alpha’s version of the Wall Street consensus outlook is calculated using ratings and price targets from 45 analysts who have published their views over the past 90 days. The consensus rating is a buy and the consensus 12-month price target is 18.3% above the current share price.
Seeking Alpha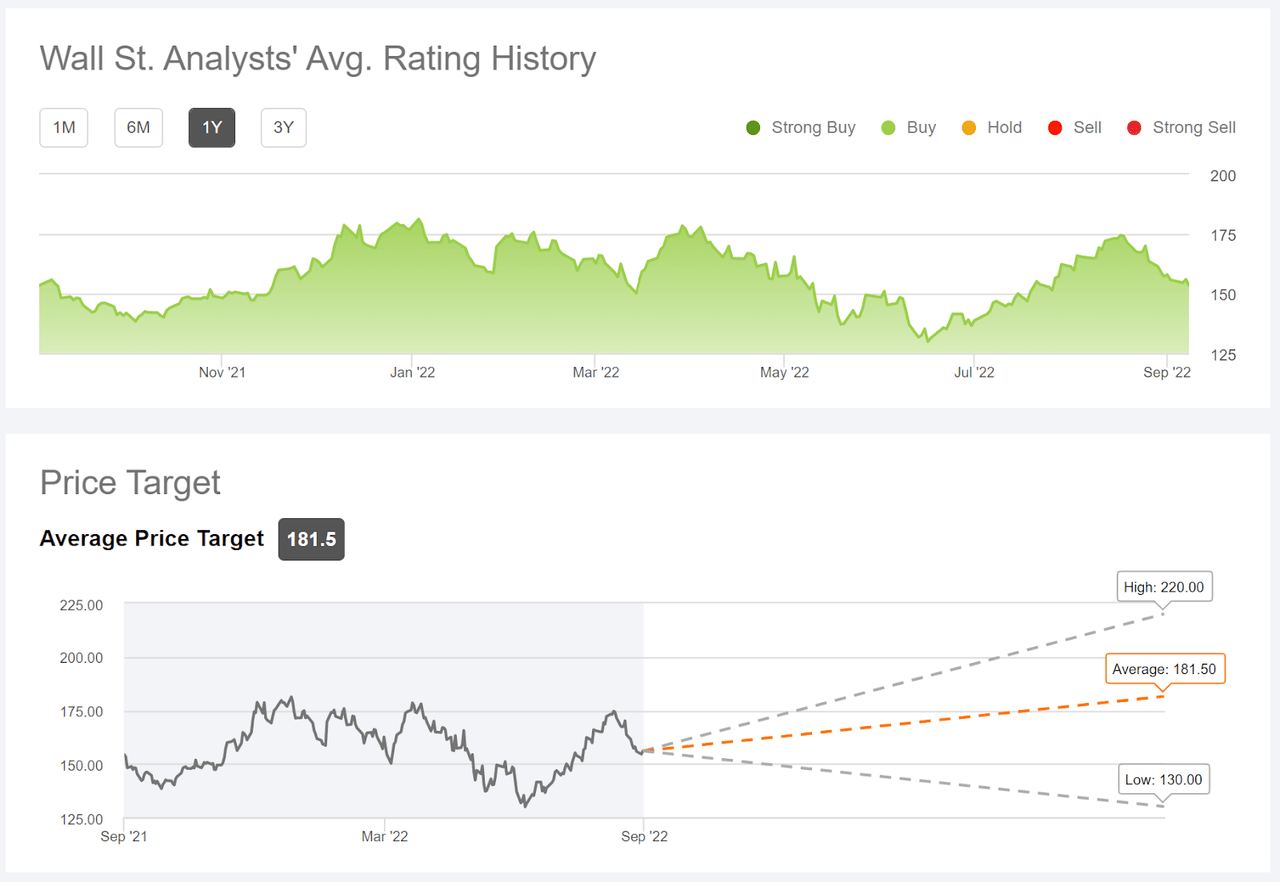
Wall Street analyst consensus rating and 12-month price target for AAPL (Source: Seeking Alpha)
Given the large number of analysts who follow AAPL, it is not surprising that these two forms of consensus outlooks agree very closely, although the fairly large spread in the individual price targets is notable.
Market-Implied Outlook for AAPL
I have calculated the market-implied outlook for AAPL for the 4.4-month period from now until January 20, 2023 and for the 9.2-month period from now until June 16, 2023, using the prices of call and put options that expire on these dates. I selected these two expiration dates to provide a view to the start and to the middle of 2023.
The standard presentation of the market-implied outlook is a probability distribution of price return, with probability on the vertical axis and return on the horizontal.
Geoff Considine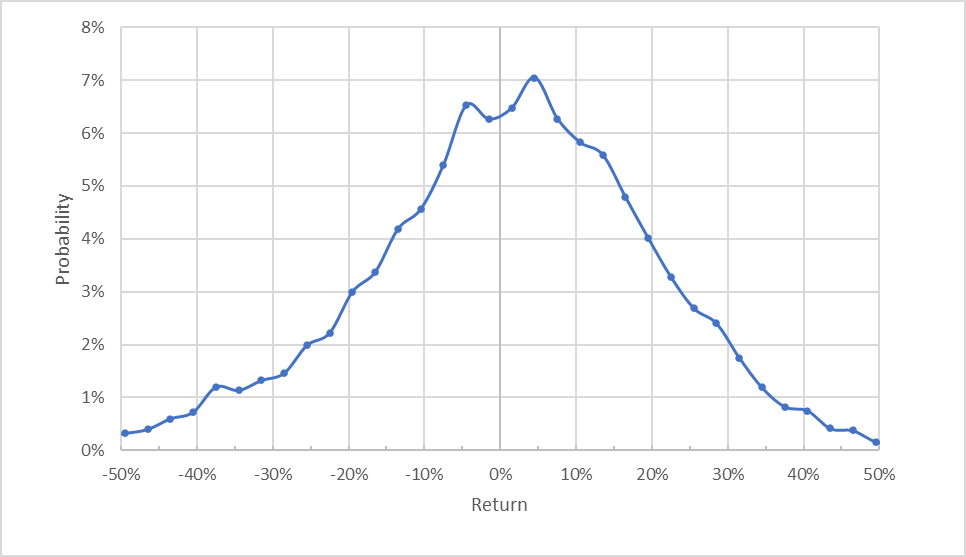
Market-implied price return probabilities for AAPL for the 4.4-month period from now until January 20, 2023 (Source: Author’s calculations using options quotes from ETrade)
The expected distribution of returns over the next 4.4 months is generally symmetric, with comparable probabilities for positive and negative returns of the same size, although the peak in probability is slightly tilted to favor positive returns. The maximum probability corresponds to a price return of 4.5%. The expected volatility calculated from this distribution is 32.7% (annualized).
To make it easier to compare the relative probabilities of positive and negative returns, I rotate the negative return side of the distribution about the vertical axis (see chart below).
Geoff Considine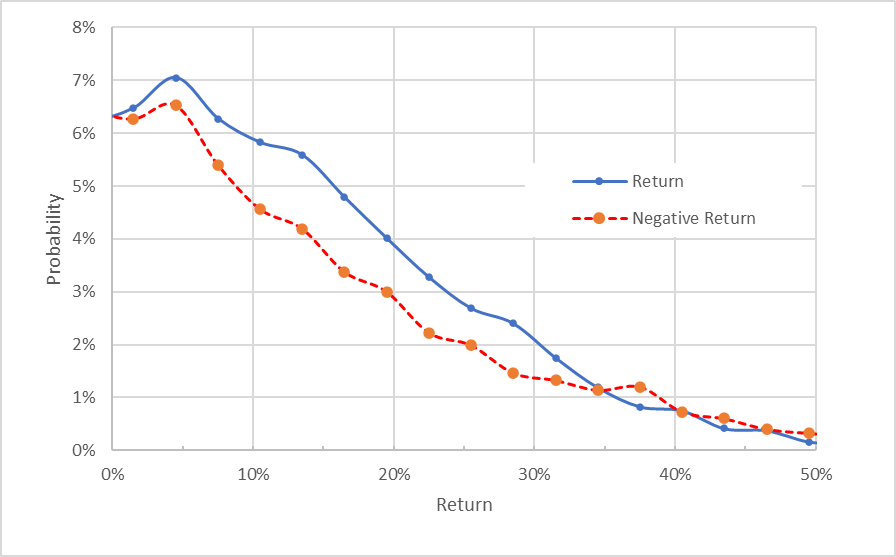
Market-implied price return probabilities for AAPL for the 4.4-month period from now until January 20, 2023. The negative return side of the distribution has been rotated about the vertical axis (Source: Author’s calculations using options quotes from ETrade)
This view highlights the tilt in the 4.4-month outlook to favor positive returns. The probabilities for positive returns are consistently higher than the probabilities of negative returns, across a wide range of the most probable outcomes (the solid blue line is above the dashed red line over the left ¾ of the chart above). This is a bullish outlook from now until January 20, 2023.
Theory indicates that the market-implied outlook is expected to have a negative bias because investors, in aggregate, are risk averse and thus tend to pay more than fair value for downside protection. There is no way to measure the magnitude of this bias, or whether it is even present, however. The expectation of a negative bias reinforces the bullish interpretation of this outlook.
The market-implied outlook for the 9.2-month period, from now until June 16, 2023, has closely matching probabilities for positive and negative returns (the solid blue line is close to the dashed red line) although the probabilities for positive returns are consistently, albeit modestly, higher than for negative returns. With the expected negative bias, I interpret this outlook as slightly bullish. The expected volatility calculated from this distribution is 33.4%.
Geoff Considine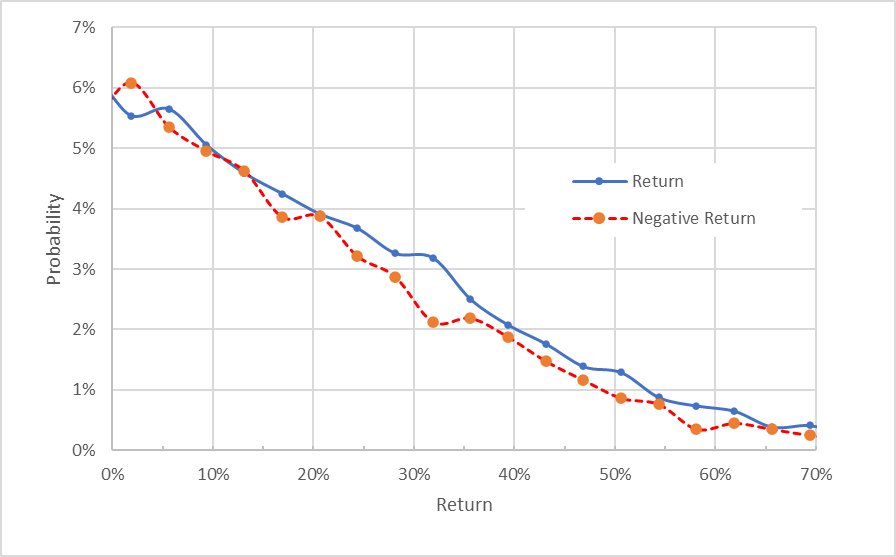
Market-implied price return probabilities for AAPL for the 9.2-month period from now until June 16, 2023. The negative return side of the distribution has been rotated about the vertical axis (Source: Author’s calculations using options quotes from ETrade)
The market-implied outlooks calculated using January- and June-expiring options tell a consistent story. The outlook is bullish to early 2023 and slightly bullish from now until mid-2023. The expected volatility is consistent over these two periods, at about 33%. For comparison, ETrade calculates 34% implied volatility for the January options and the June options.
Summary
Apple has done an impressive job of maintaining and growing earnings through years of challenges, including COVID-19, supply chain disruptions, and chip shortages. This is especially impressive given the discretionary nature of the company’s products. The shares are currently trading at more than 15% below the 12-month-high closing price from early 2022. The latest product rollouts continue to provide incremental improvements that are quite compelling. The Wall Street consensus outlook continues to be bullish, with a buy rating and a 12-month price target that implies a total return of about 19%-20% over the next year. As a rule of thumb for a buy rating, I want to see expected total return that is at least ½ the expected (annualized) volatility (33%). AAPL exceeds this threshold. The market-implied outlook to mid-January of 2023 is bullish, and the outlook from now until mid-June of 2023 is slightly bullish. My overall rating on AAPL is a buy.
Be the first to comment