

Hailshadow/iStock via Getty Images
Q3 recap and investment thesis
My last article on Apple (NASDAQ:AAPL) and Berkshire Hathaway (NYSE:BRK.A)(NYSE:BRK.B) is co-produced with Sensor Unlimited and published about a month ago in early November. That article argued that share repurchases at both AAPL and BRK are far more potent when considered together than viewed separately. Such “double buybacks” are compounding on steroids in our view.
In this article, we want to switch the focus entirely. We will argue A) why buying/adding AAPL around its current price (which translates to about 20x owners’ earnings) is a no-brainer, and B) why owning AAPL via BRK is an even better idea.
Both AAPL and BRK have posted strong Q3 earnings. The key results are shown in the two charts below, and I will dive into the highlights as we go. These strong results, when combined with the price corrections during Q3 due to (or thanks to) market volatilities, investors have some great opportunities to buy or add these perpetual compounders at enticing entry valuations.
For AAPL, its TTM EPS as of Q3 2022 (i.e., its FY Q4) came in at $6.11 per share as you can see from the first chart below. Later, you will see that such accounting EPS underestimates its owners’ earnings (“OE”), and its OE is around $7.18, which translates into a share price near ~$145 at a 20x OE multiple. And I kept telling my readers buying/adding stock like AAPL near or below 20x OE is a no-brainer. Stocks like AAPL (or BRK) are quintessential examples of equity bonds as explained in my earlier article because:
To me, any valuation near or below 20x OE is very attractive for a stock with ROCE (return on capital employed) near 100% like AAPL. At about 100% ROCE, a 5% investment rate would provide 5% organic real growth rates (i.e., before inflation adjustments). And a 20x OE would provide about 5% owners earnings yield, leading to a total return in the double digits. Once you adjust for the risks (and I consider the risks from AAPL similar to treasury bonds), a 10%+ annual return is ~3x of what you can get from bonds in the long term.
In this article, I will focus on an alternative way to own AAPL, a sort of backdoor, through BRK. And I will explain why owning AAPL this way is even more attractive under current conditions. And this brings me to the financials of BRK, as shown in the second chart in this section.
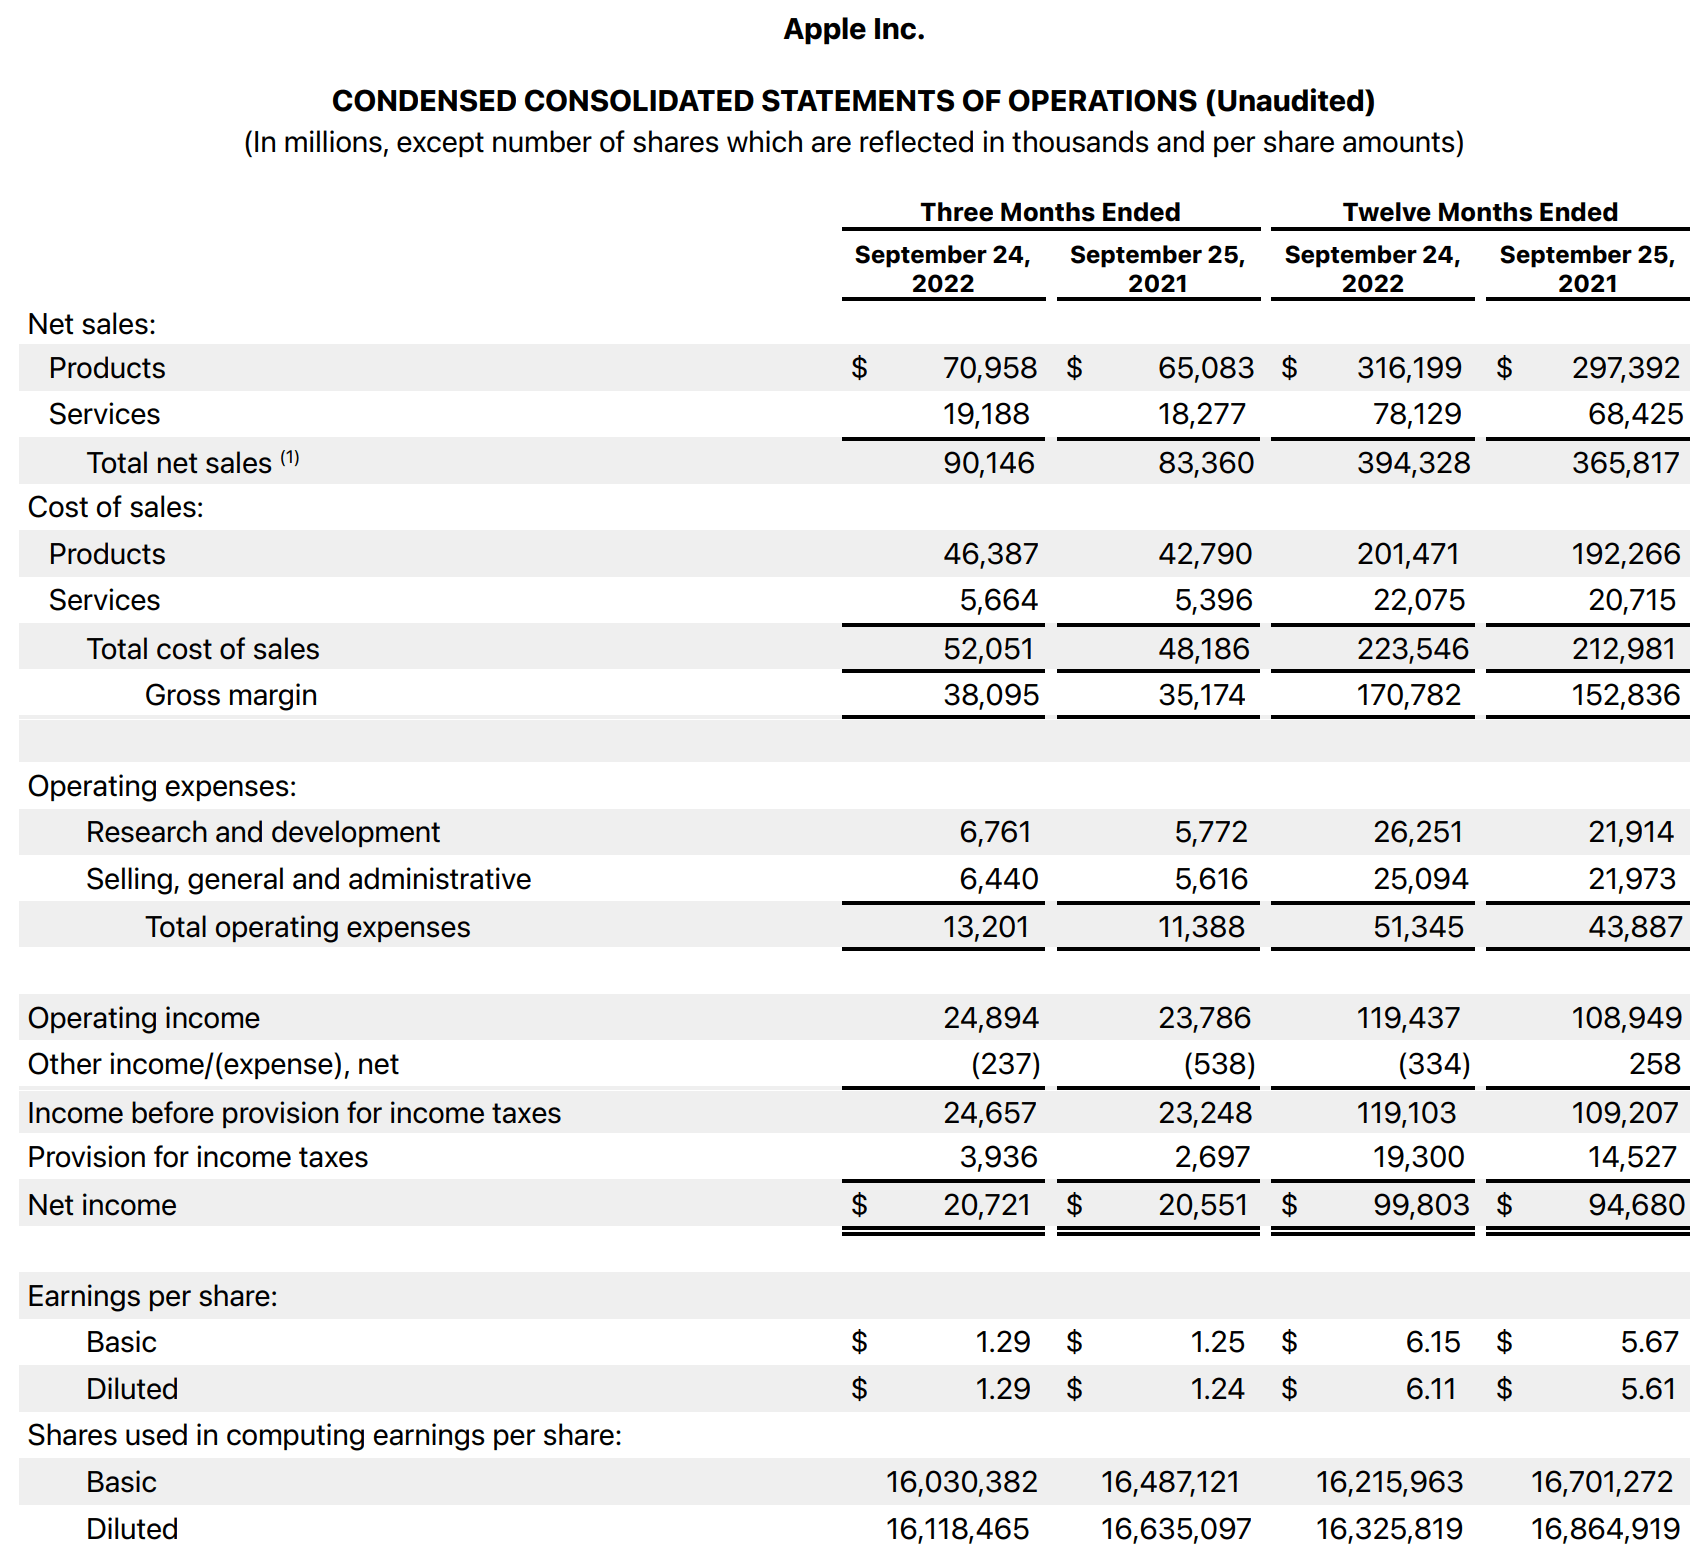
Source: AAPL Q3 ER
BRK reported strong operating results for Q3 also and is on pace for a solid 2022. Operating earnings per share, which excludes capital gains and losses from the investment portfolio, clocked in at $3.00 in Q3, translating into an annual growth rate of almost 20% YOY. This was particularly impressive considering that its insurance segment suffered higher-than-usual operations losses due to hurricane Ida, Ian, and also the floods in Europe. The remainder of this analysis also will involve its balance sheet, which is posted below. And a couple of highlights relevant to the subsequent analyses:
- All my following per-share numbers for BRK (e.g., OE, equity, cash, et al) are quoted per Berkshire Hathaway B share, not A shares. Given that the focus here is on the financial (not voting power), the analysis should be perfectly applicable for A shares.
- Its equivalent Class B shares outstanding is taken to be 2.2B shares according to its most recent 10-K filing. The market value of its equity investment portfolio is taken from dataroma. And as of this writing, the portfolio value is reported to be $296.1B, slightly below the $306B shown in its 10-K below due to market fluctuations since the filing.
With these parameters, let’s dive in and see how we can own AAPL through BRK at an effective PE of ~12x or below.
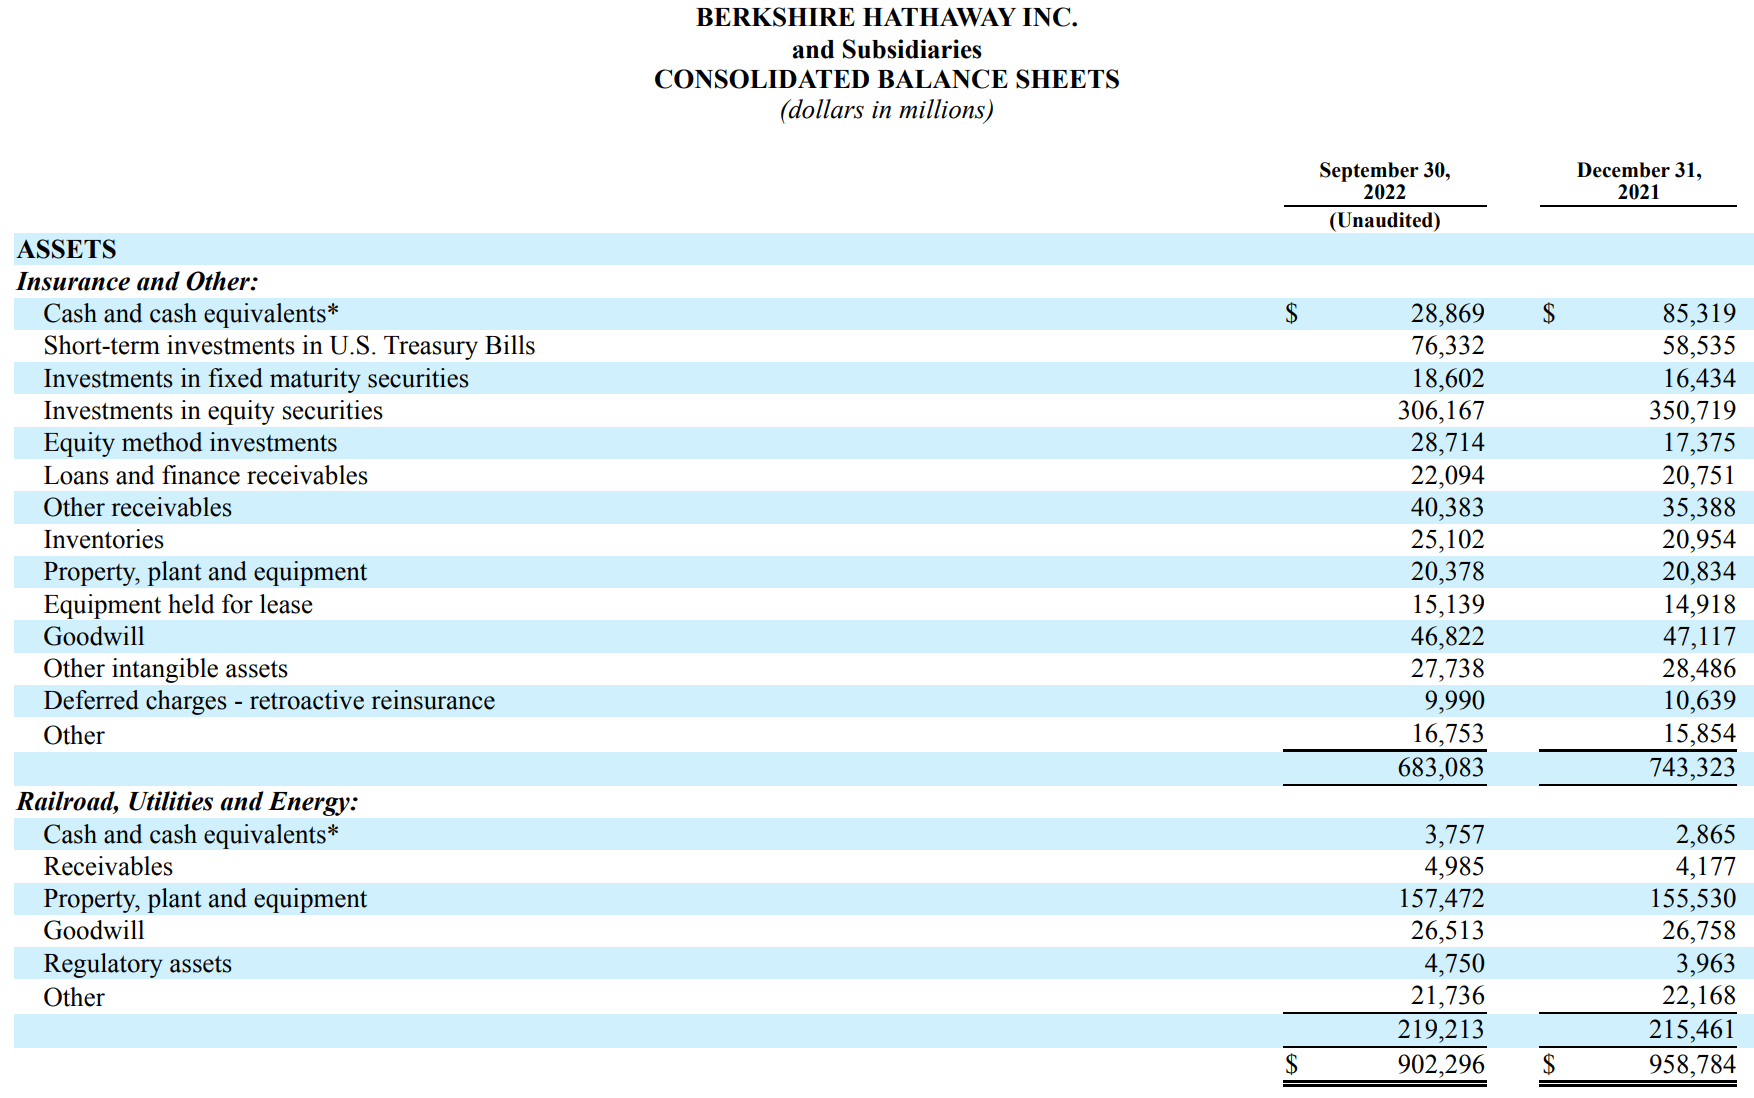
Source: BRK Q3 ER
AAPL’s EPS and OE
Since we are analyzing AAPL and BRK, it’s only fitting to start with a quote from Warren Buffett on the difference between accounting EPS and owners’ earnings (“OE”). The following is taken from Berkshire Hathaway’s 1986 annual report (slightly edited with emphases added by me):
These represent (“a”) reported earnings plus (“b”) depreciation, depletion, amortization, and certain other non-cash charges…less (“c”) the average annual amount of capitalized expenditures for plant and equipment, etc. that the business requires to fully maintain its long-term competitive position and its unit volume…Our owner-earnings equation does not yield the deceptively precise figures provided by GAAP, since (“c”) must be a guess – and one sometimes very difficult to make. Despite this problem, we consider the owner earnings figure, not the GAAP figure, to be the relevant item for valuation purposes…All of this points up the absurdity of the ‘cash flow’ numbers that are often set forth in Wall Street reports. These numbers routinely include (“a”) plus (“b”) – but do not subtract (“c”).
The key is to estimate item c, and my analysis of item c for AAPL is shown in the table below. This table is based off Bruce Greenwald’s method (detailed in his book Value Investing) to separate maintenance capex and growth capex. Readers interested in the details could find them in my earlier article or his book.
To wit, AAPL’s TTM accounting EPS came in at $6.11 per share as aforementioned. However, its OE is about $7.18 per share, about 18% higher. The reason for this higher OE is the accounting EPS considered all CAPEX to be a cost, while only the maintenance capex should be considered as costs as Buffett explained above. In AAPL’s case, the discrepancy should be obvious as its accounting EPS is even lower than its FCF (free cash flow) by about 13%, and then even the FCF is an underestimate of the true OE (again because the FCF calculation also considered all the capex expenses to costs). The third column in the table shows my forecast for the next year. And as you can see, the OE for Apple in the next year is projected to be $7.33 per share.
All told, Apple’s accounting PE is about 23x, a number all AAPL investors must be very familiar with. However, once you consider its OE, then the multiple is actually on the order of 20x for this year and slightly below 20x on an FW basis.
Then finally, remember that Apple also carries a net cash position on its balance sheet (about $2.27 per share under its current conditions). Once you adjust the cash position too, its OE PE is on the order of 19.9x for this year and only 19.5x for next year.
And in the next section, we will see how we can do even better through BRK.
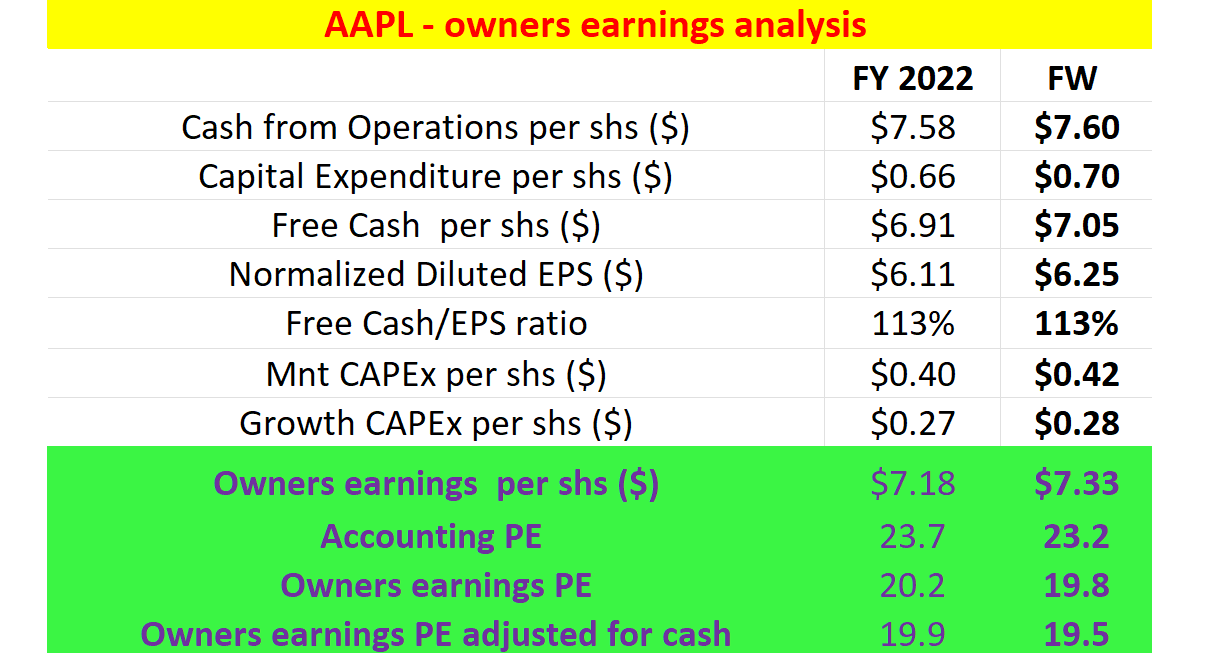
Source: Author based on Seeking Alpha data.
Backdoor AAPL via BRK
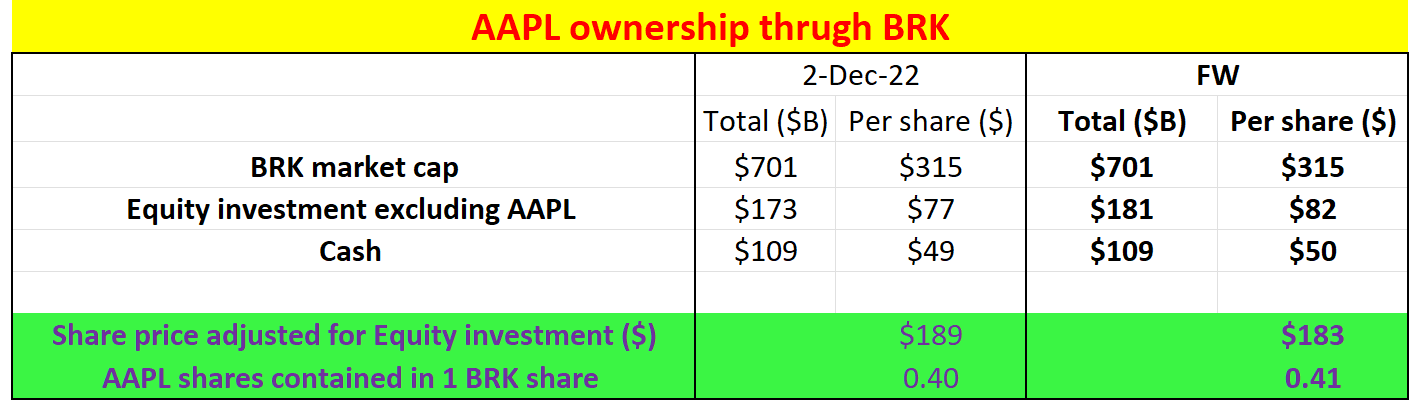
As mentioned earlier, the market value of BRK’s equity investment portfolio (based on dataroma) is at $296.1B As of this writing. AAPL is the largest position and is valued at $123.6B. So BRK’s equity investment excluding AAPL is worth about $173B, or $77 per share. The market capitalization for BRK is about $701B ($315 share price). Then also recall from its balance sheet, we know that there is $109 billion worth of cash sitting on its ledger.
Putting all these above numbers together, we can show that:
- If we take out all the other equity investments except AAPL and the cash, BRK’s adjusted market cap is $420B (or $189 per share). This means if we buy BRK shares at $315 and then liquidate the cash and all other equity investments except AAPL, we effectively paid $189 for each BRK share only.
- Why does this $189 buy us then? First, we bought all the AAPL shares that BRK owns. As of this writing, BRK owns a total of 894.8 million shares of AAPL, translating into 0.40 AAPL shares contained per BRK share. BRK has been consistently buying back its own shares. And I project this trend to continue. Extrapolating its share repurchase from the previous quarters, the AAPL shares contained in each BRK share would increase to 0.41 next year as shown.
- Second, we also bought all the BRK operating segments too, which is what we will examine next.
Source: Author based on Seeking Alpha data.
AAPL’s ownership PE via BRK
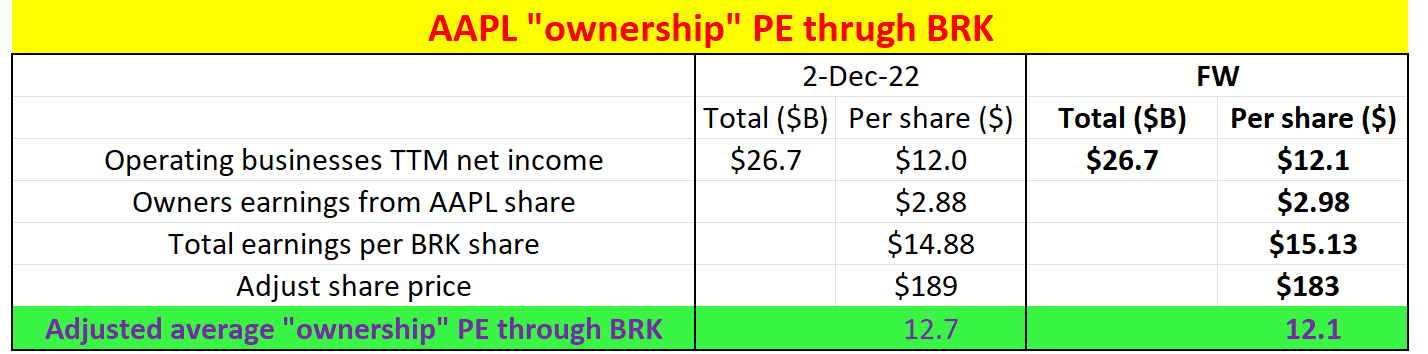
BRK is projected to earn $12.9 per share of operating income in 2022, although 2022 may not be the most representative year. My best estimate for its normalized operating income is about $12 per share (or $26.7B in total), which is the assumption that I used in the analysis shown in the following table.
Source: Author based on Seeking Alpha data.
Now just as established above, if we buy BRK shares at $315, we are effectively buying 0.40 AAPL shares (or 0.41 on an FW basis) and all the BRK operating segments for $189. The BRK operating segments would provide earnings of $12 per share as assumed above, and the 0.4 AAPL shares would provide an OE of $2.88 (=0.40*$7.18). Thus, we paid $189 and got a total of $14.88 per share of OE ($12 from BRK operations plus $2.88 from AAPL). On an FW basis, the earnings would further increase to $15.13 per share due to a combination of AAPL earnings growth and BRK’s share repurchases as discussed above.
Now, how you compute the PE multiple here depends on how you value BRK’s operating income. The last row of the table shows an aggregated average, a sort of effective “ownership” PE of AAPL and BRK together, which turned out to be 12.7x based on 2022 financials and 12.1x on an FW basis.
If BRK’s operating income is priced at a 15x multiple – a quite reasonable multiple in my view, then BRK’s operating income would be worth $180 per share. Hence, we would be paying only $9 ($189-$12*15) for the 0.4 AAPL share, which provides $2.88 of OE. This means we would be owning the AAPL shares at a PE of about 3.1x only.
Risks and final thoughts
Specific risks for AAPL or BRK have been thoroughly discussed in other SA articles (including some of our own), and I won’t further add them here. Here I will focus on the risks and limitations associated with the particular backdoor idea described in this article.
- BRK’s cash position. In this analysis, I assumed that you could liquidate all the cash on its ledger. But of course, a good part of the cash is insurance float and cannot be liquidated (at least cannot be entirely liquidated). But there also are good reasons behind the approach that I used – at least as a thought experiment to analyze the financials and valuation. After all, cash is cash. If you buy BRK completely, every $1 in the insurance float still counts as $1.
- Worth of BRK’s equity portfolio. The market valuation of BRK’s equity portfolio is always a moving target and changes on a daily basis with the market volatilities. Hence, there is some uncertainty here too. As aforementioned, the current portfolio value of $296.1B is already below the $306B disclosed in its 10-K back in September.
Nonetheless, it’s always better to be approximately right than precisely wrong. And the bigger picture I see here are:
- Owning a perpetual compounder like AAPL near or below 20x OE is a no-brainer to me. And under Apple’s current conditions, with the cash position and underestimation of accounting EPS adjusted, a ~$145 stock price should translate into a 20x OE or below.
- The discrepancy between accounting PE and OE PE is even larger than BRK. And once these discrepancies are corrected, we can own Apple shares with an effective “ownership” PE through BRK at heavy discounts. The exact discounts depend on how your value BRK’s operating income, which can lead to an ownership PE of AAPL in the range of ~12x to free based on my analyses.
Be the first to comment