

ThitareeSarmkasat
Written by Nick Ackerman, co-produced by Stanford Chemist. This article was originally published to members of the CEF/ETF Income Laboratory on September 27th, 2022.
We originally took a look at Apollo Senior Floating Rate Fund (NYSE:AFT) at the end of 2021. It was an interesting candidate then, and it certainly still is now while rate hikes are still coming. That should lead to further distribution boosts on the horizon, even after several aggressive hikes this year.
The fund’s discount has widened substantially, which has put pressure on the actual performance of the shares. Now, it could be a more interesting name at a deeper discount and lower price. The attractive characteristics of the floating rate have only marginally helped in terms of total return performance relative to the broader market as measured by the S&P 500. On price alone, the CEF has fallen even further.
AFT Performance Since Previous Update (Seeking Alpha)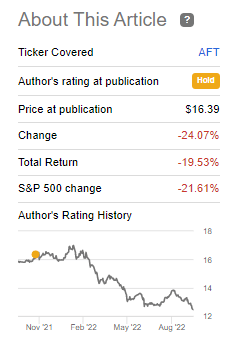
That doesn’t mean there aren’t any risks, though. Further discount widening and rates actually going too high could put further pressure on the fund. The reason being is that below-investment-grade companies generally issue floating rate loans. These are companies that are more susceptible to downturns when economies sour.
The Basics
- 1-Year Z-score: -1.31
- Discount: -13.48%
- Distribution Yield: 9.84%
- Expense Ratio: 2.36%
- Leverage: 36.72%
- Managed Assets: $353.98 million
- Structure: Perpetual
AFT’s investment objective is “to generate current income and preservation of capital through a disciplined approach to credit selection.” To achieve this, the fund will invest “at least 80% of its managed assets in floating rate senior loans and investments with similar economic characteristics.”
One thing that jumps out at me about AFT is the fund’s expense ratio. According to CEFConnect, without including leverage, the expense ratio stood at 2.36%. It is definitely putting it on the higher end, even relative to other floating rate peers.
When including leverage expenses, it comes to 3.53%. That was a jump from the 2.91% total expense ratio last year. The reason for this is the borrowings the fund has are also based on floating rates. This isn’t unusual for closed-end funds. For AFT, it is LIBOR plus 0.825%.
Unlike some other funds, though, AFT hasn’t hedged against this. Presumably, it is because their underlying portfolio is one big hedge, with the vast majority of the portfolio in floating rate securities. That will keep the spread between what the credit facility costs them and what the underlying portfolio is paying out.
Additionally, their leverage ratio is starting to become elevated. Any further downside push could put pressure on needing to reduce that leverage. In 2020, they went from $141 million to $121 million, meaning they did leverage at some point through the pandemic.
AFT Performance – Attractive Discount
On a YTD basis, the fund is underperforming Invesco Senior Income Trust (VVR) and BlackRock Floating Rate Strategies (FRA). These are funds that I would consider peers. However, they weren’t chosen randomly. I’m biased as I’ve leaned into these funds for my floating rate exposure.
One quality of VVR and FRA that’s helping performance is the lower underlying expense ratios. While I don’t focus on expenses as much as some folks do, it has seemed to play a role in these three similar funds. However, the underperformance here seems to be beyond just a higher expense ratio.
Ycharts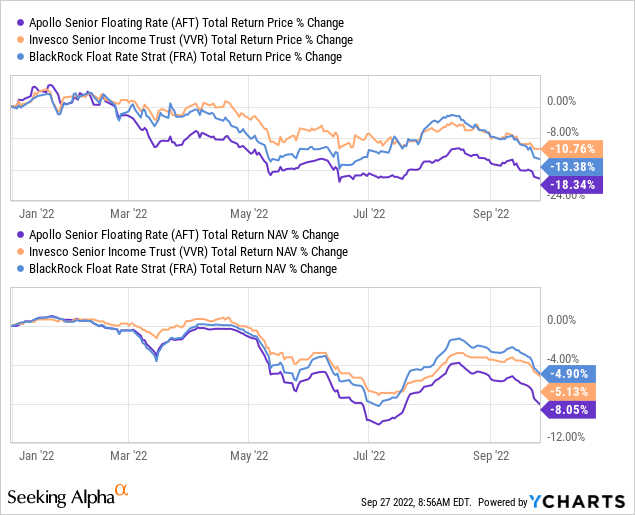
Over the longer term, the results haven’t been as drastically different in terms of the total NAV return. Though AFT has underperformed these other two positions nonetheless.
Ycharts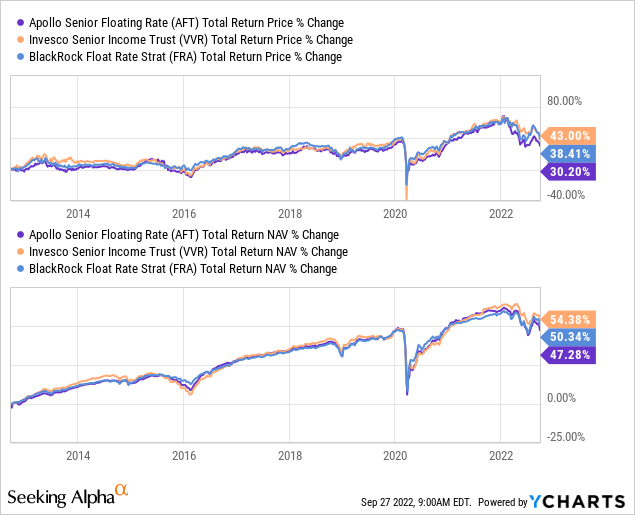
Past performance is no guarantee of future results. However, longer-term results showed that AFT underperformed when rates were essentially zero. Now, YTD results would show that even during a rising interest rate environment – where these funds should benefit the most – they are still underperforming peers. That’s certainly not a good look for Apollo.
One thing that has happened to all three of these funds is the discounts widening out. On that basis, the edge is slightly in favor of AFT based on these three funds.
Ycharts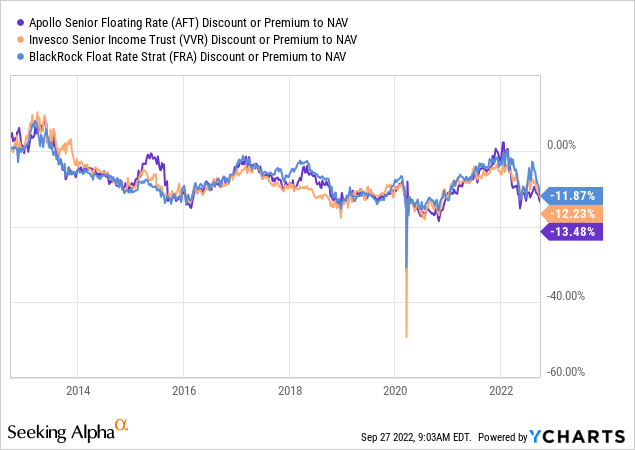
Distribution – Heading North
The share prices have been unpredictable due to credit risks in the market and discount widening in the closed-end fund structure. However, what has been more of a reliable trend is the generally trending higher distributions. For AFT, there was a pause and reduction to start the year, but since then, it has been up and up.
AFT Distribution History (CEFConnect)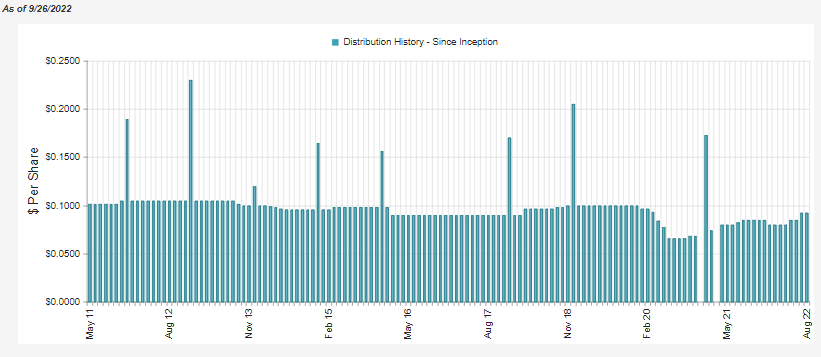
The latest increase was 20% to get to $0.102. That puts it at a level that has topped out the pre-COVID $0.10 monthly payout.
Helping to support that was a rising net investment income. If we annualized the latest figure, it would touch $0.94. That was at the end of June 2022. Since then, the Fed has only raised even further. That means the 98% NII distribution coverage has only improved, which is likely why the fund has raised the distribution even further.
AFT Semi-Annual Report (Apollo)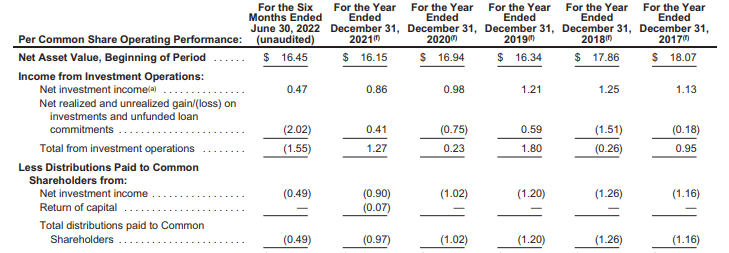
Those additional raises since will have pushed the NII even higher due to the underlying portfolio yields rising. That means more raises on the horizon are more likely than not.
That being said, there is a certain level where increases in interest rates will become damaging. As mentioned above, these are less financially stable companies. Rising interest rate costs will put pressure on them. A recession would squeeze many of these companies on both ends.
AFT’s Portfolio
Over 93% of AFT’s portfolio is invested in loans. The other small slice of the pie is in high-yield bonds and even an immaterial 0.7% in equity/other.
AFT Portfolio Exposure (Apollo)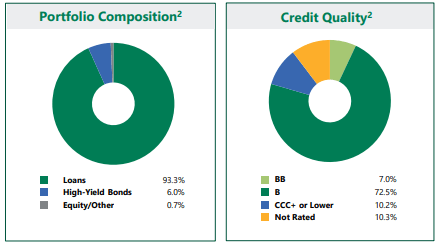
The credit breakdown shows that the bulk of the portfolio is invested in B rated debt. BB is the first rung that is considered high-yield or junk. Therefore, we are two rungs into below-investment-grade debt. We also even see a fairly material ~10% allocation to CCC debt. That is debt that is highly susceptible to nonpayment and needs just about everything to go right.
That being said, they are invested in 93 issuers and 142 holdings, according to CEFConnect. Diversification can help a CEF invested in riskier assets by spreading the risk through companies and industries. The top five industries make up a fairly weighty 55.3%, but we see that healthcare is a fairly larger weighting.
Healthcare can be more defensive, generally speaking. However, we are still looking at below-investment-grade rated healthcare companies, so risks still exist. These aren’t the Johnson & Johnson (JNJ) or Pfizer’s (PFE) of the world.
AFT Top Five Industries (Apollo)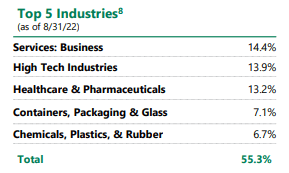
This sort of diversification is reflected in the fund’s top ten issuers. We can see that the top ten make up around 23% of the portfolio.
AFT Top Ten (Apollo)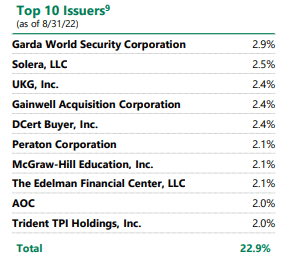
For some comparison, going back to VVR again. VVR holds 384 issuers with 572 holdings. The top five industries make up around 47.5% of the fund. FRA has 452 holdings. The top five industries make up a considerable 78.5% of FRA’s portfolio.
That being said, BlackRock’s definition of industries resembles more sector-like classifications. So, it isn’t necessarily a direct comparison of industry breakdown. As for the number of holdings, we can clearly see that AFT’s running with a more narrowly focused number of positions. So far, that hasn’t seemed to be benefiting the fund. At least, it hasn’t benefited the fund in terms of total NAV performance relative to VVR and FRA.
Conclusion
AFT’s discount and reduced share price combine to make it a more interesting choice at this time. AFT, VVR and FRA are all similar funds, except AFT’s portfolio is more concentrated and running with a meaningfully higher expense ratio.
In terms of distributions, all funds should be experiencing better distribution coverage going forward, with chances of increases or further distribution increases on the horizon. All three payout quite attractive distribution yields already. The larger payout for AFT might appear even more attractive. However, it has shown inferior results when compared to VVR and FRA. That’s both in the longer-term, mostly zero interest rate environment and the shorter-term, where rates have been rising rapidly.
Be the first to comment