

Spencer Platt/Getty Images News
Introduction
Houston-based APA Corp. (NASDAQ:APA) released its first-quarter of 2022 results on May 4, 2022.
Note: I have followed APA quarterly since 2017 with 24 articles and counting. This new article is a quarterly update of my article published on March 4, 2022.
1 – 1Q22 results snapshot
During the first quarter of 2022, APA reported a net income attributable to common stock of $1,813 million, or $5.43 per share on a fully diluted basis. When adjusted for certain items that impact the comparability of results, APA’s first-quarter earnings totaled $468 million or $1.29 on a diluted share.
Net cash provided by operating activities was $891 million, and adjusted EBITDAX was $1,707 million this quarter.
APA 1Q22 Highlights Presentation (APA Corporation)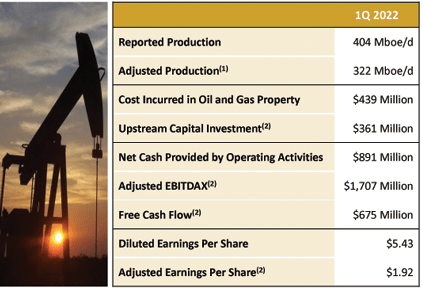
CEO John Christmann said in the conference call:
The first quarter brought a strengthening in both oil and gas prices to levels unseen since 2014. This quickly shifted the prevailing energy narrative to questions about spare capacity, energy security and whether producers could realistically deliver more reliable and affordable oil and natural gas. These are all very good questions and hopefully represent a more thoughtful outlook for our energy dialogue.
2 – Stock performance
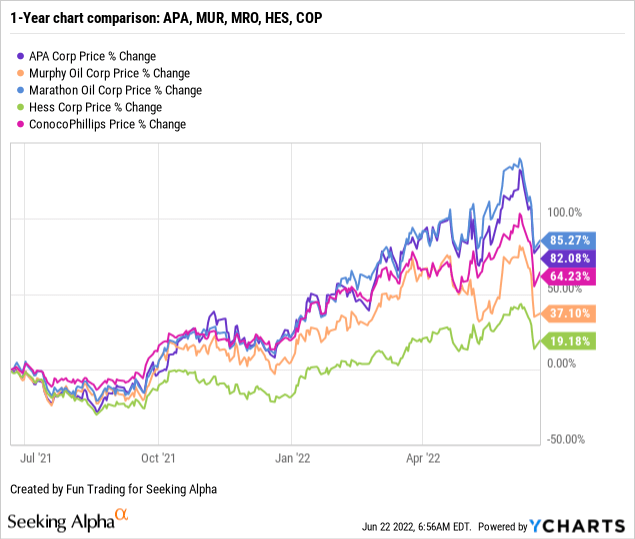
Let’s compare APA to a few other E&P oil and gas companies (e.g., Murphy Oil (NYSE: MUR) or Marathon Oil (NYSE: MRO), etc.).
We can see that APA has followed the group and is up only 82% on a one-year basis, down from a recent peak.
Balance sheet and production history for 1Q22: The raw numbers
| APA | 1Q21 | 2Q21 | 3Q21 | 4Q21 | 1Q22 |
| Revenues from oil and gas in $ billion | 1.871 | 1.756 | 2.059 | 2.299 | 2.669 |
| Total Revenues and others in $ Billion | 2.092 | 1.782 | 1.651 | 2.403 | 3.828 |
| Net Income in $ Billion | 0.407 | 0.340 | -0.083 | 0.471 | 1.813 |
| EBITDA $ Billion | 1.07 | 0.95 | 0.56 | 1.08 | 2.68 |
| EPS diluted in $/share | 1.02 | 0.82 | -0.30 | 1.05 | 5.43 |
| Cash from Operating activities in $ Million | 671 | 969 | 771 | 1,085 | 891 |
| CapEx in $ Million | 256 | 306 | 236 | 315 | 379 |
| Free Cash Flow in $ Million | 415 | 663 | 535 | 770 | 512 |
| Total cash $ Billion | 0.54 | 1.25 | 0.38 | 0.30 | 0.23 |
| Total LT Debt in $ Billion | 8.72 | 8.64 | 7.41 | 7.51 | 5.89 |
| Dividend per share in $ | 0.025 | 0.025 | 0.025 | 0.025 | |
| Shares outstanding (diluted) in Million | 379 | 379 | 379 | 363 | 347 |
| Oil Production | 1Q21 | 2Q21 | 3Q21 | 4Q21 | 1Q22 |
| Total Oil Equivalent in K Boepd | 382.4 | 395.2 | 389.0 | 385.6 | |
| International | 172.3 | 153.7 | 151.5 | 187.6 | |
| USA | 210.1 | 241.5 | 237.5 | 228.0 | |
| Global liquid price ($/Boe) | 59.62 | 66.40 | 71.72 | 78.52 | |
| Global Natural gas price ($/MMBtu) | 4.14 | 2.99 | 3.87 | 4.95 |
Source: Company filing
Note: historical data since 2015 are only available to the Gold and Oil Corner subscribers.
Analysis: Revenues, Earnings Details, Free Cash Flow, And Oil Production
1 – Revenues and others were $3,828 million in 1Q22
APA Quarterly total revenues history (Fun Trading)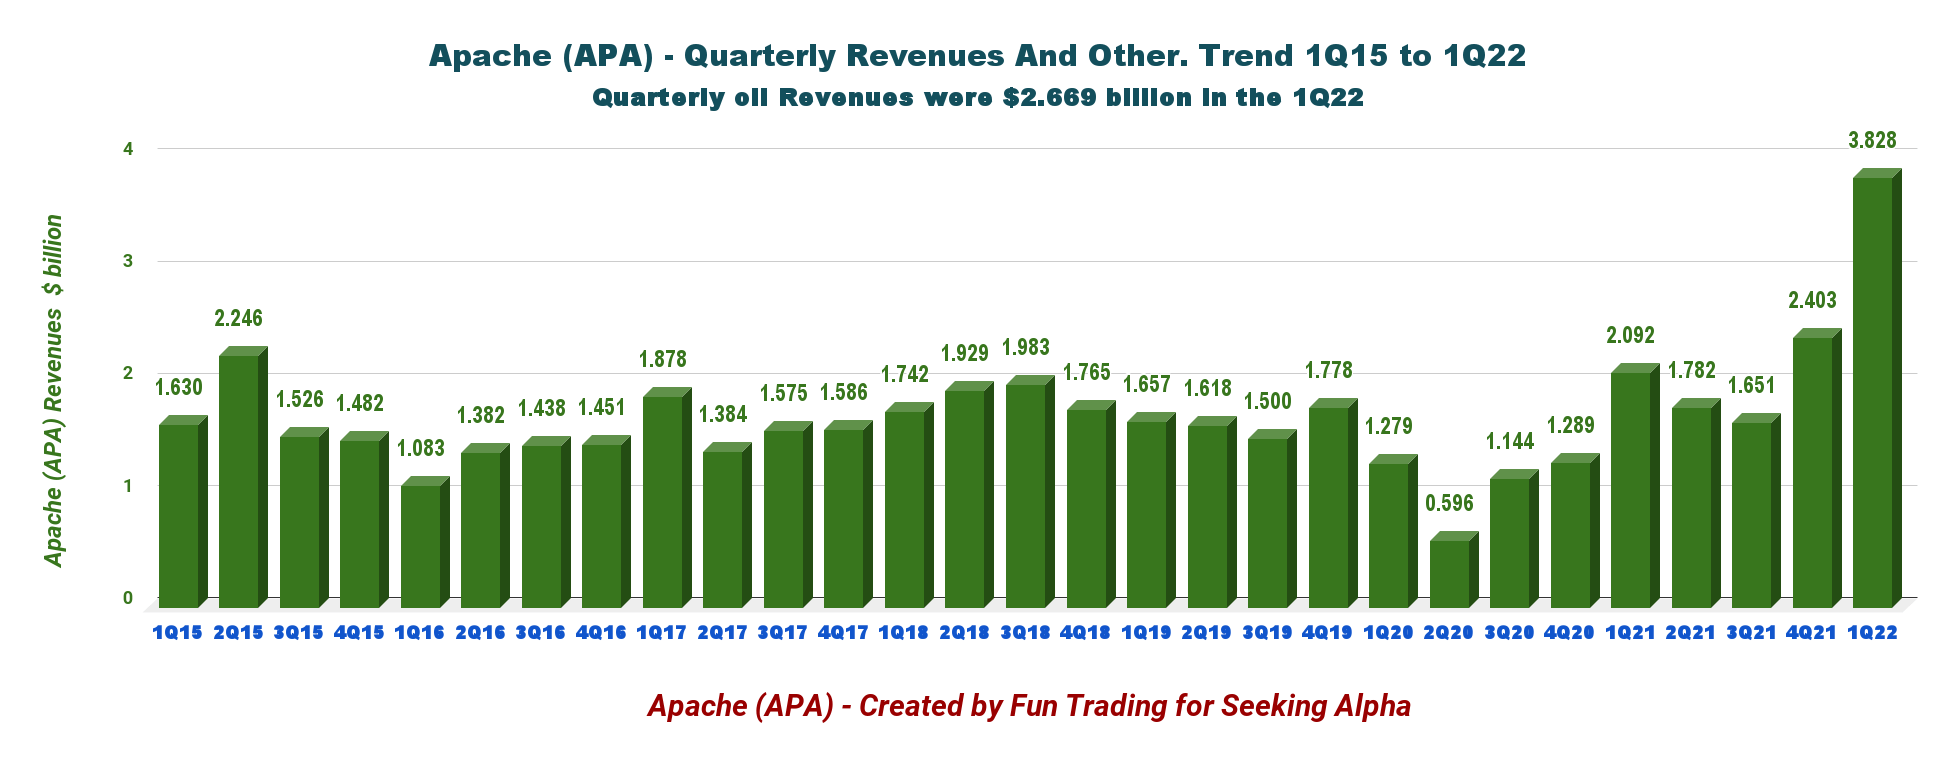
1Q22 total revenues and others were $3.828 billion (with oil revenues of $2.669 billion), up from $2.092 billion the same quarter a year ago. APA received approximately $1 billion in proceeds from previously announced sales of Delaware Basin minerals package and Kinetik common stock (Combination of Altus and BCP Raptor Holdco LP formed on February 22, 2022.)
The indirect ownership of Apache Corporation has been reduced to approximately 20% and the existing Altus public shareholders will own approximately 5% of the combined Company. Apache, Blackstone and I Squared have agreed to customary lock-up provisions of their respective holdings until February 23, 2023. However, Apache is permitted to sell up to 4 million shares until May 23, 2022, provided the first $100 million of proceeds is invested in new development activity within 24 months at Alpine High.
One crucial positive element is that the global liquid price jumped again to a record of $100.23 per barrel in 1Q22 compared to $78.52 in 4Q21, as shown in the chart below.
APA Quarterly NG and Oil prices history (Fun Trading)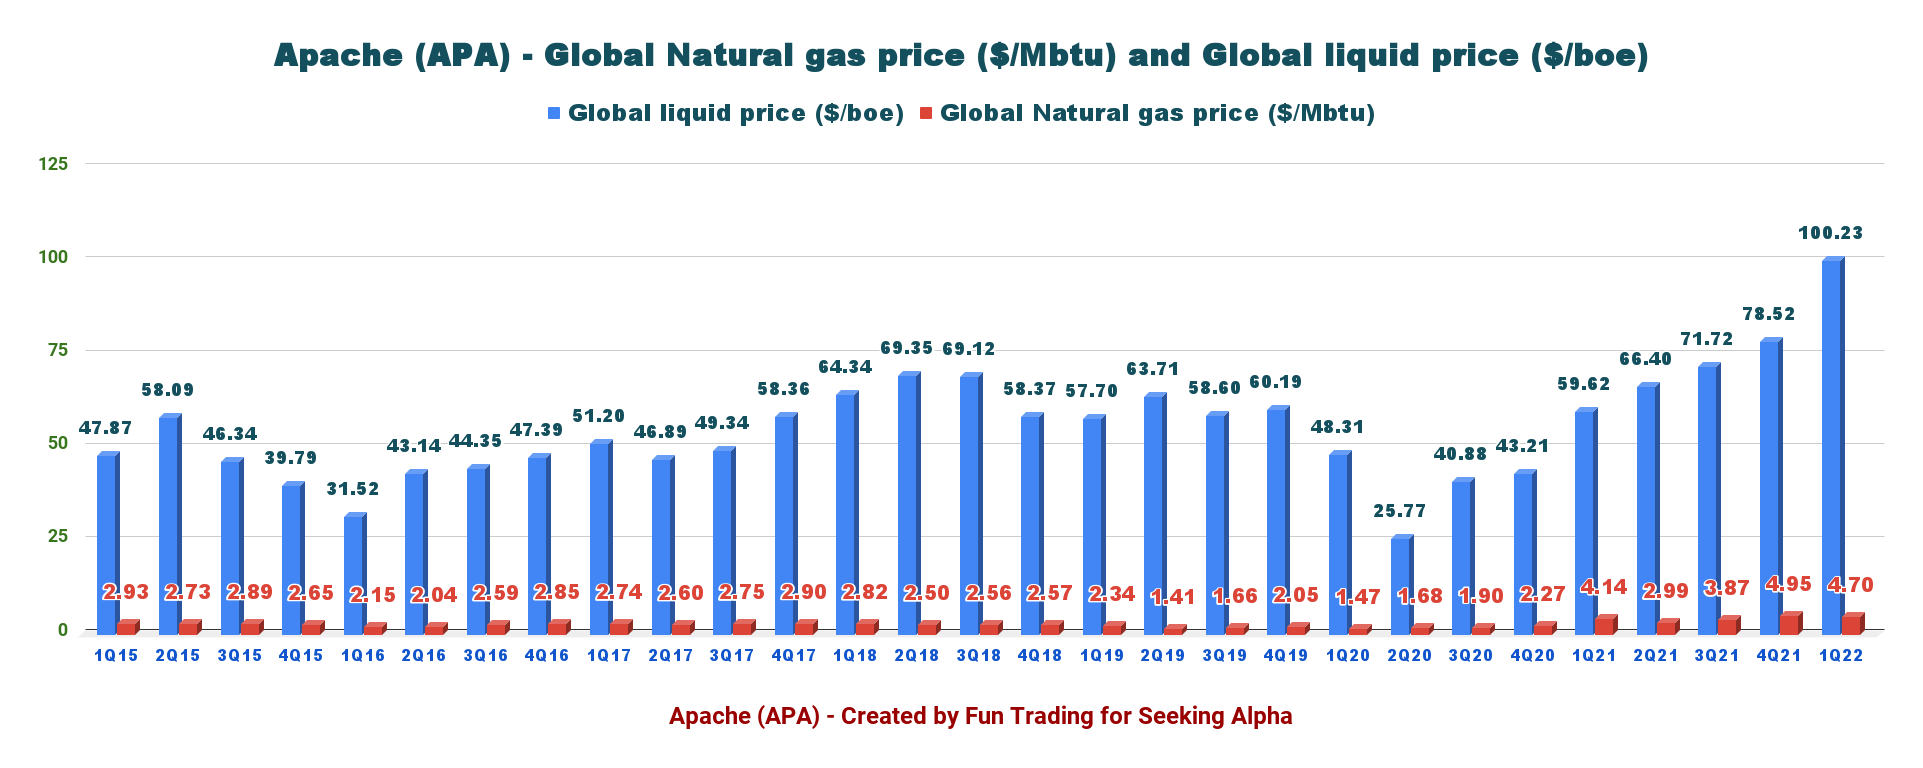
2 – Free cash flow was a gain of $512 million in 1Q22
APA Quarterly Free cash flow history (Fun Trading)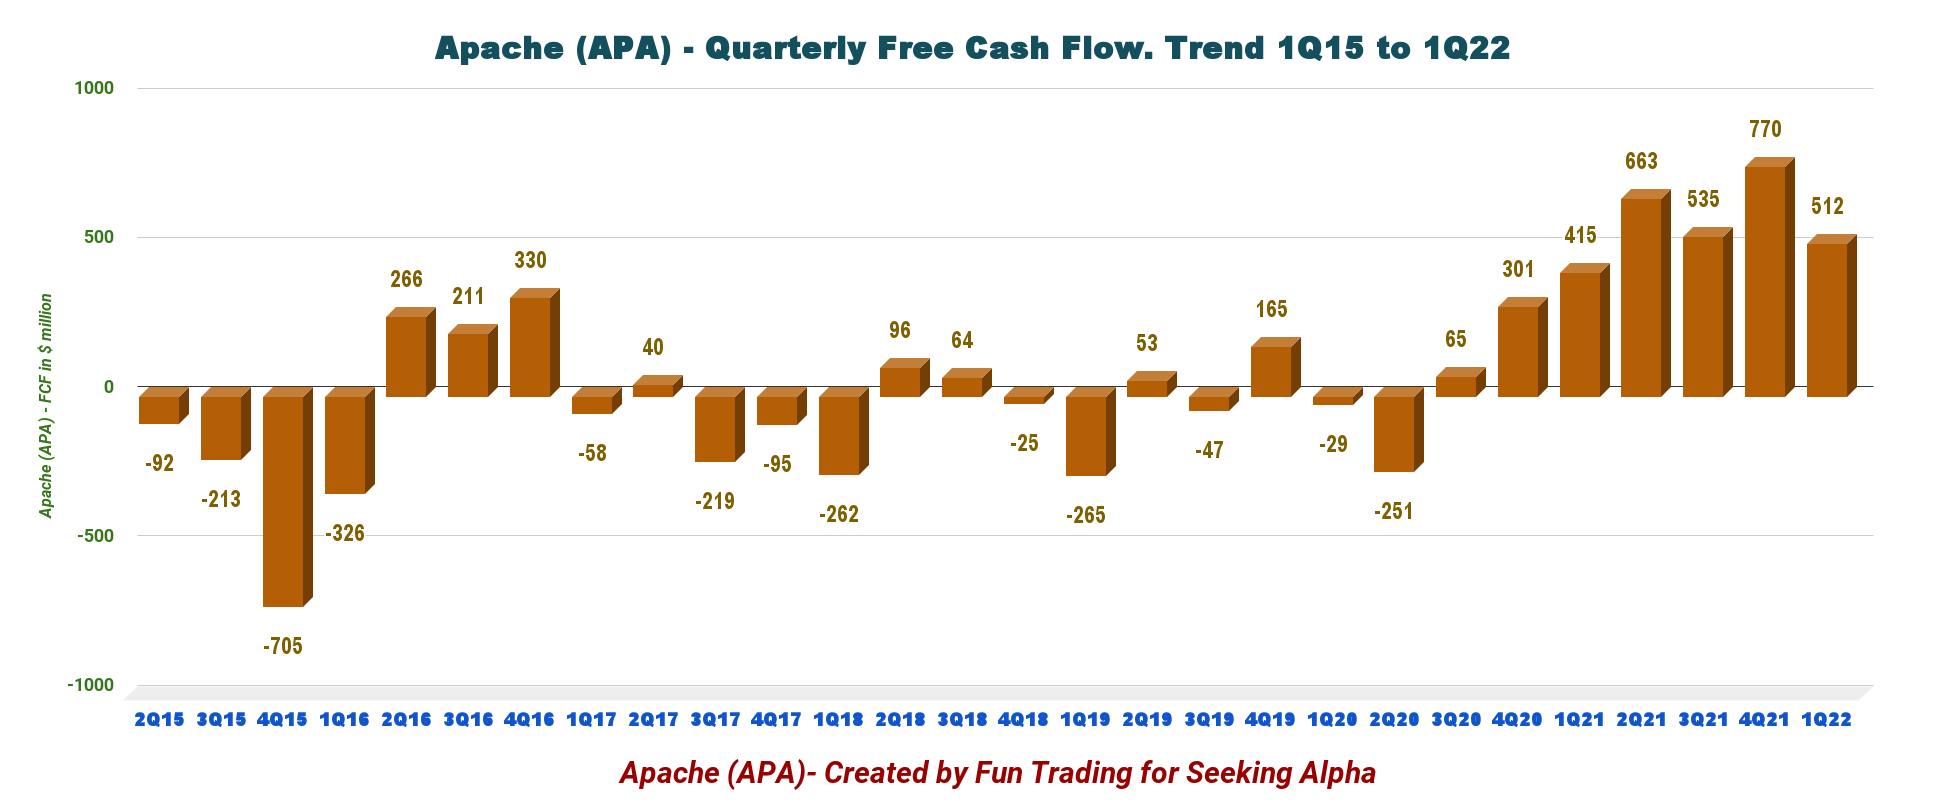
Trailing 12-month free cash flow is now $2,480 million, with a free cash flow of $512 million for the first quarter.
APA repurchased 7.2 million shares of common stock during the quarter at an average price of $36 per share. Also, APA repurchased 38.4 million shares since October 2021. Details are indicated below:
APA Shares repurchased status 1Q22 (APA Corporation)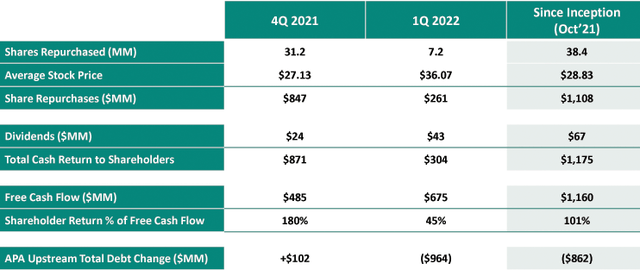
CEO John Christmann said in the conference call:
Since the beginning of 2021, we have made tremendous progress with debt reduction, which enabled the initiation of our capital return framework. In that time frame, we have reduced our outstanding bond debt by $3 billion, repurchased $1.1 billion of APA stock or roughly 10% of shares outstanding and increased annualized dividend to $0.50 per share. At current strip prices, we expect to generate approximately $2.9 billion of free cash flow in 2022.
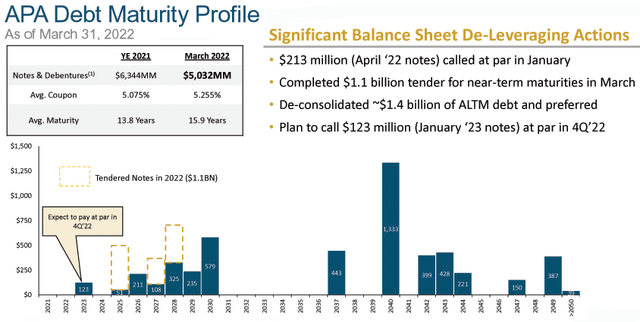
3 – Net debt dropped significantly to $5.655 billion in 1Q22
APA Quarterly Cash versus Debt history (Fun Trading) APA is deleveraging its debt profile and has done an excellent job in the first quarter of 2022. APA de-consolidated about $1.4 billion of ALTM debt and preferred this quarter. As of March 31, 2022, net debt was $5.655 billion. During the first quarter, APA paid off $213 million in bonds that were set to mature in April and completed an upsized tender offer, which eliminated $1.1 billion of additional near-term maturities. At the end of April, APA established new credit facilities comprising a $1.8 billion revolver and £1.5 billion letter of credit facility, the latter to support asset retirement obligations in the North Sea. APA Debt profile 1Q22 Presentation (APA Corporation)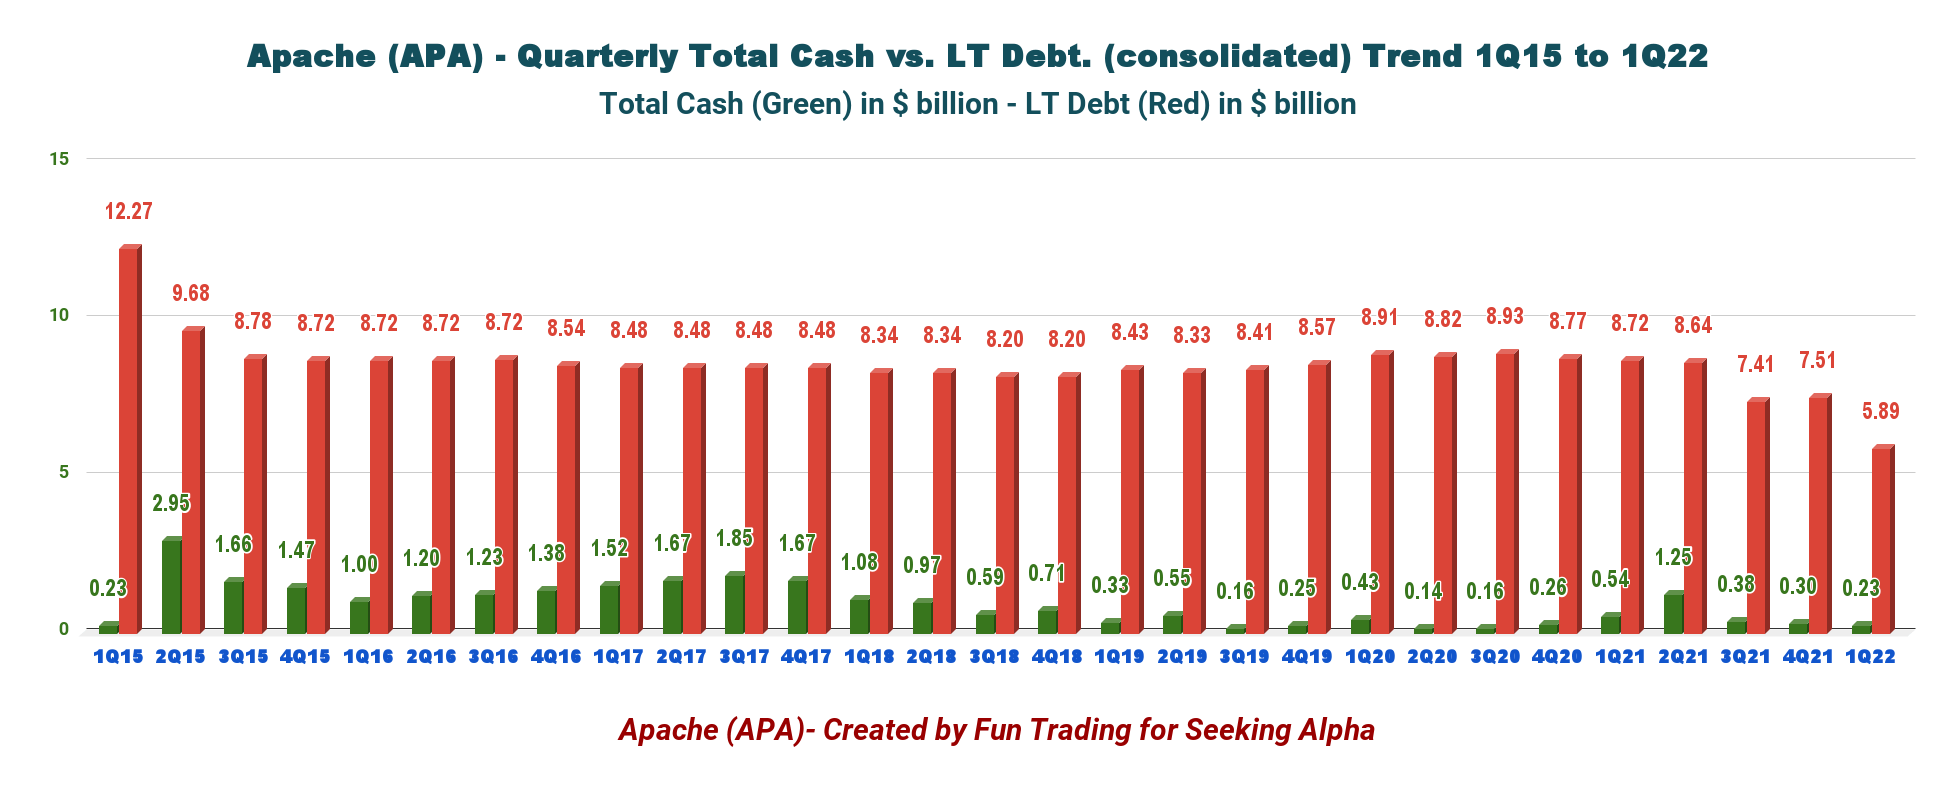
4 – Oil-equivalent production was 404.042K Boep/d in 1Q22 which comprises 63% liquids (oil + NGL).
4.1 – Production Details.
APA Quarterly Oil equivalent Production detail history (Fun Trading) APA Quarterly oil equivalent production history (Fun Trading)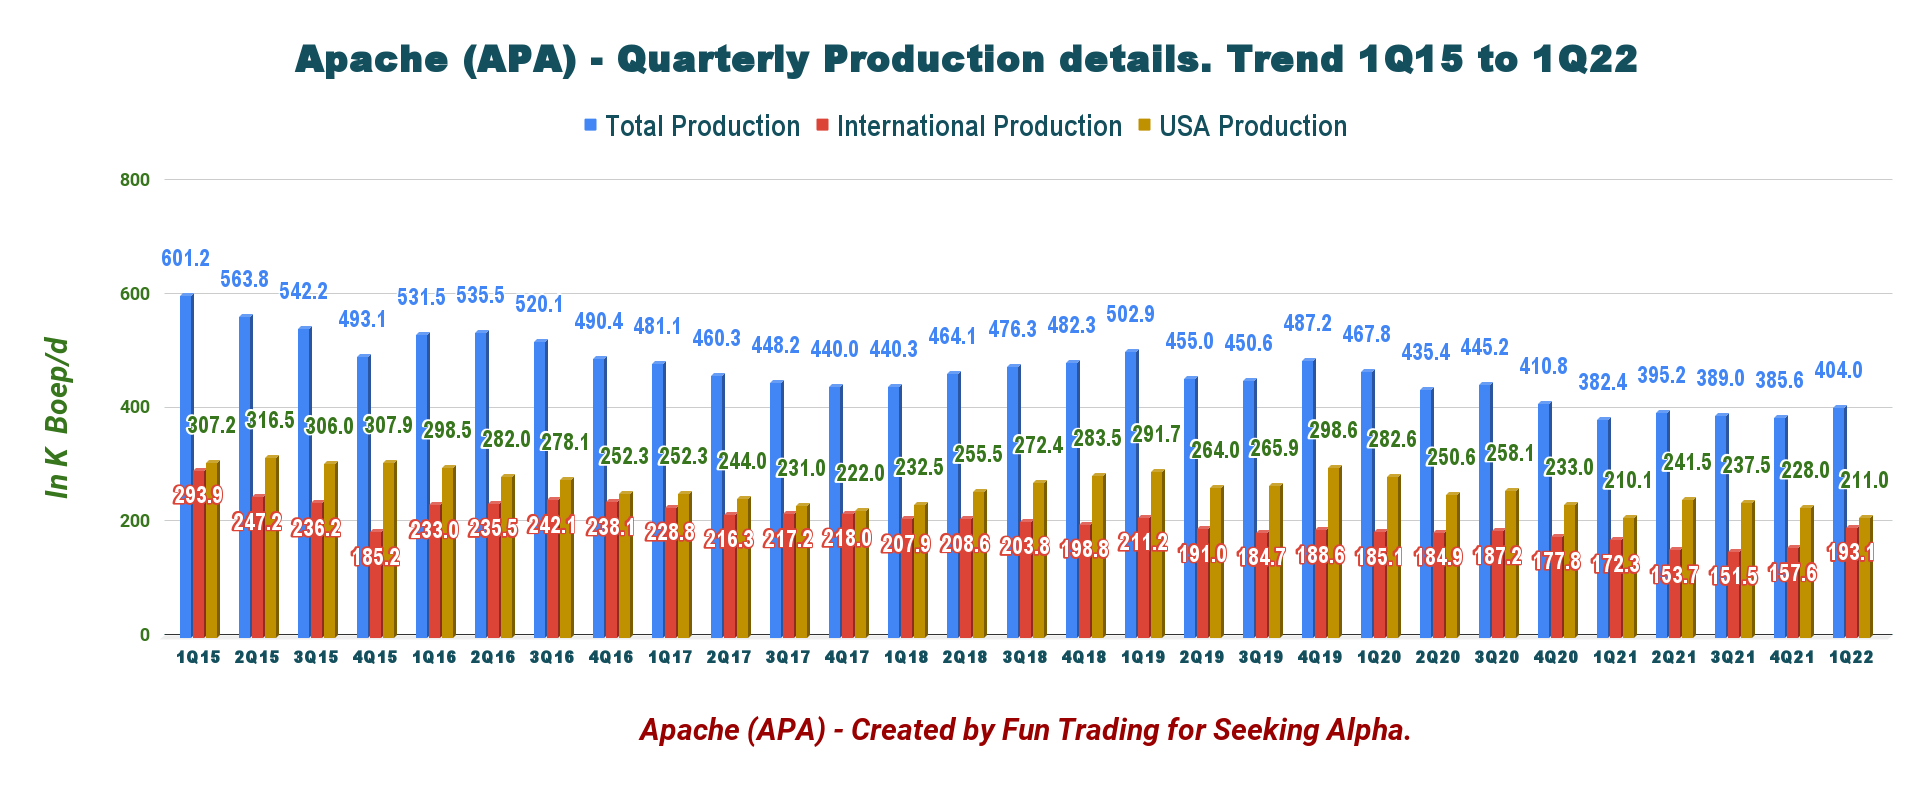
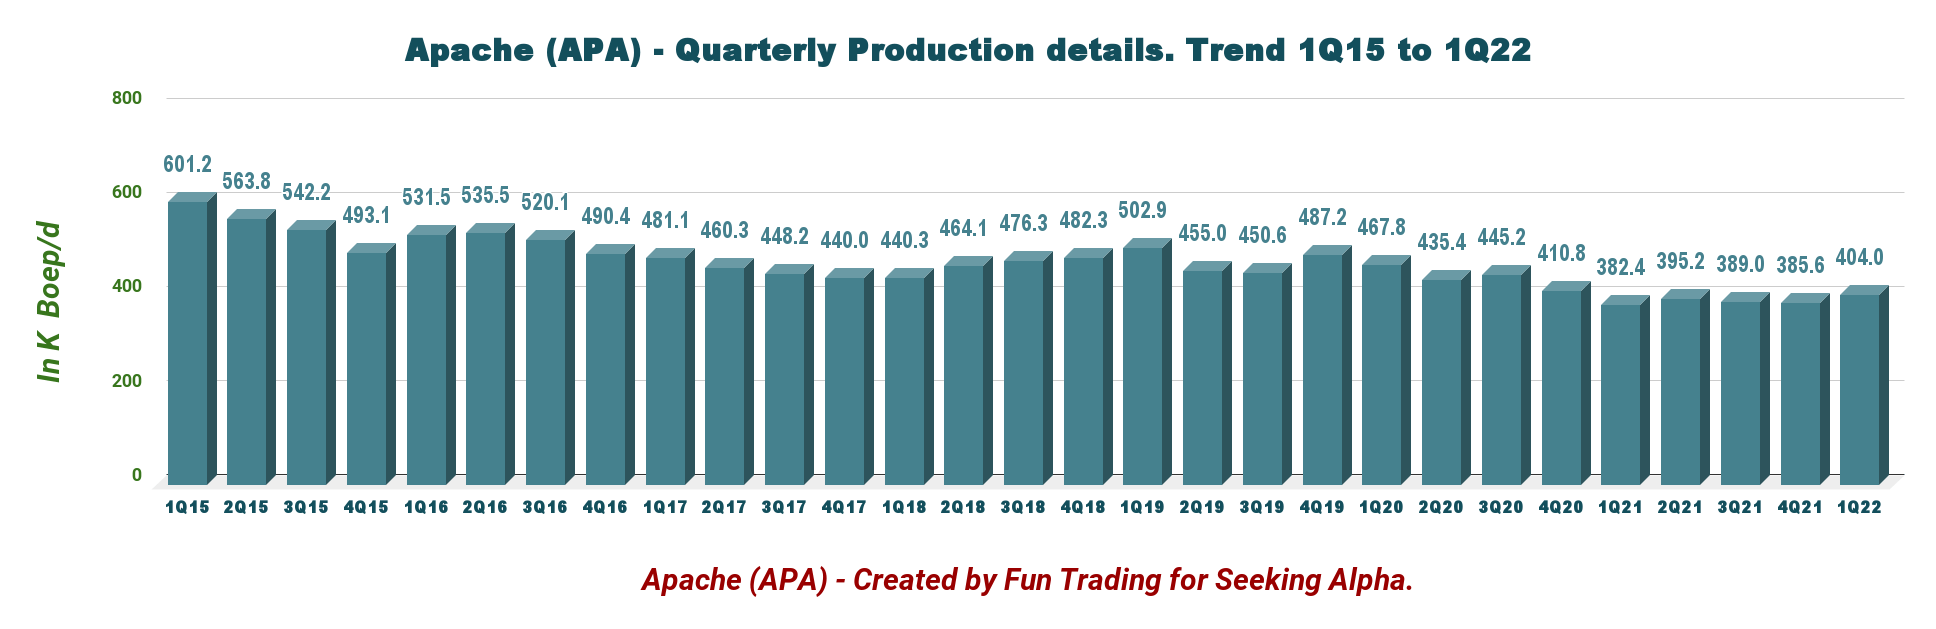
Production in the USA is the most important for the company, with 211K Boep/d in 1Q22 or 52.2% of the total output.
APA Oil equivalent Production per region in 1Q22 (Fun Trading)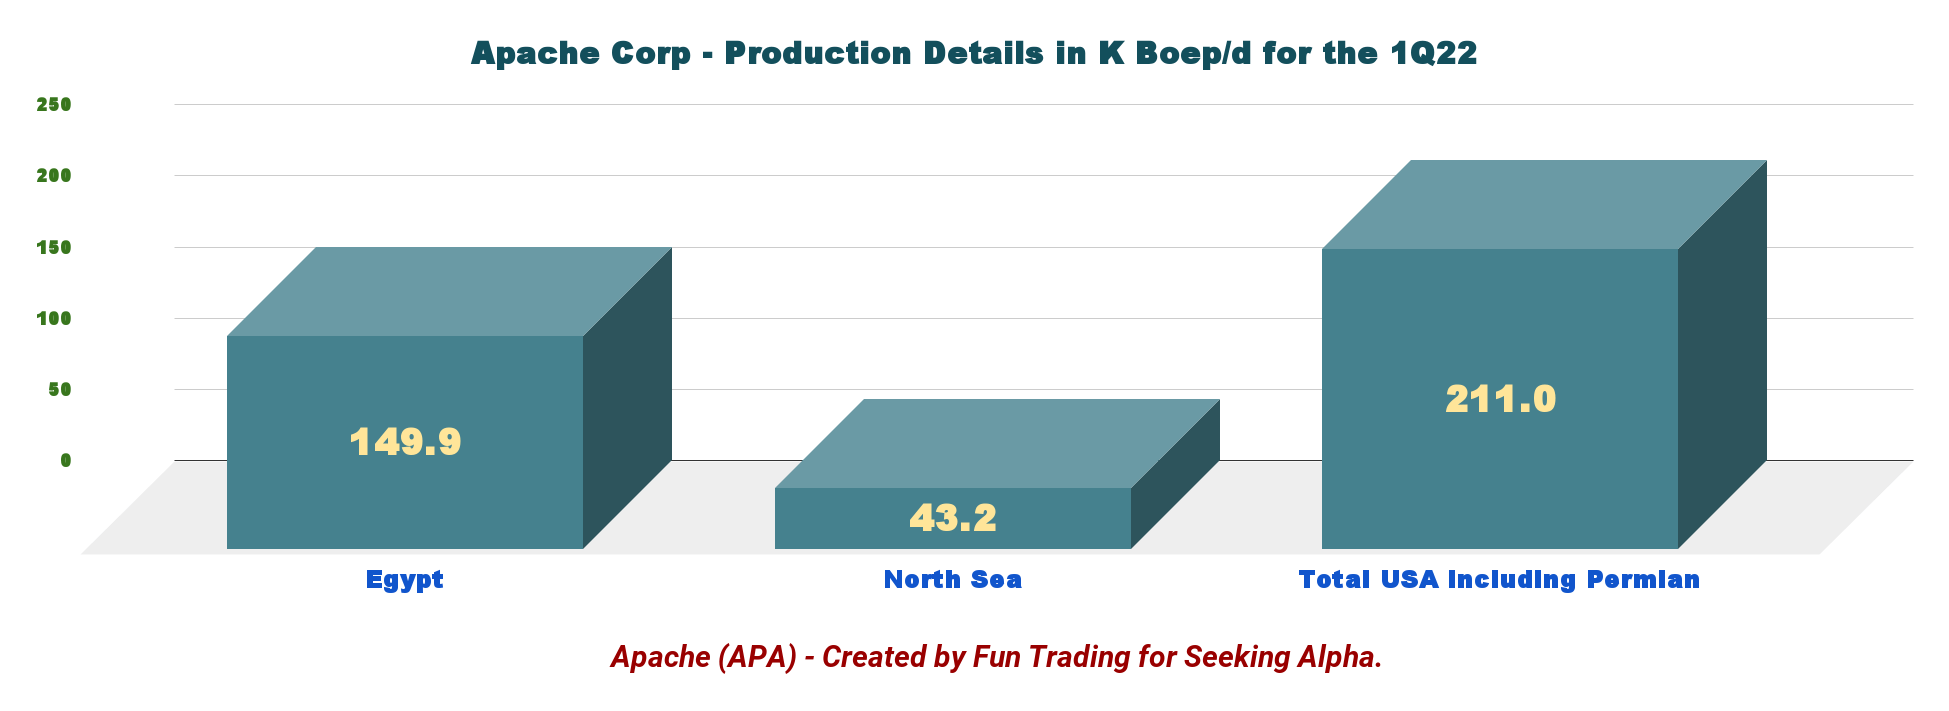
A few productions highlights this quarter:
APA oil equivalent production 1Q22 (APA corporation)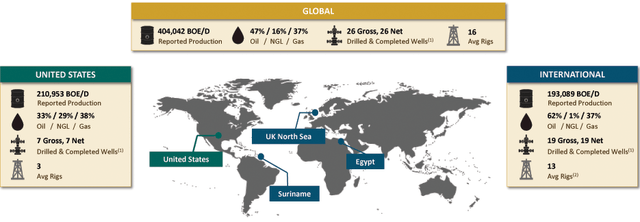
4.2 – Block 58 in Suriname continues to be very promising, and exploration began in block 53 with Rasper exploration well.
Highlight in 1Q22:
APA announced the discovery at Krabdagu exploration well on Block 58 offshore Suriname and completed Rasper exploration well on Block 53 on June 13, 2022.
The Rasper well was disappointing, and I wonder if block 53 will deliver commercial oil? Block 52 is owned by Petronas/Exxon Mobil/Suriname BV, should be a good potential, and has indicated a discovery in 2020 with the Sloanea-1 exploration well.
APA Block 58 and block 53 (APA Corporation)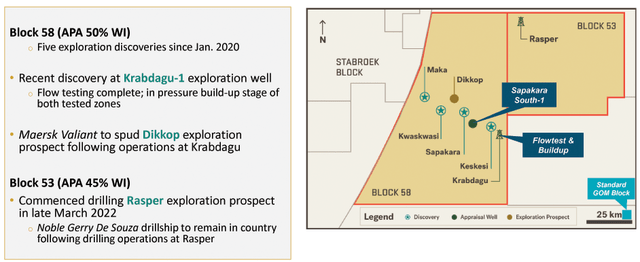
Block 58 is an exciting part of the company and will generate a significant production outlook. Just imagine what Exxon Mobil did in the Stabroek block next door to guess what can be done and produced here.
As a reminder, in December 2019, APA and TotalEnergies (TTE) formed a joint venture to develop the project off Suriname. Under the Suriname deal, Apache and Total hold 50% working interest in Block 58.
Also, APA Suriname is the operator of Block 53 (45%) with partners Petronas Carigali Sdn. Bhd (30%) and CEPSA (25%).
5 – 2022 Guidance
APA 2022 Guidance (APA Corporation)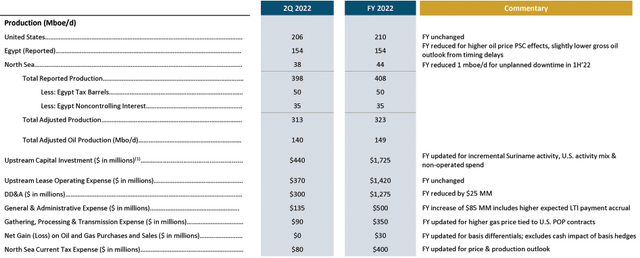
Despite the lower first quarter spend, we are increasing full year capital investment guidance by about 8% to $1.725 billion. Approximately half of this increase is associated with Suriname as we now plan to keep the Noble Jerry Desouza drillship in country following conclusion of operations at the Rasperwell in Block 53. Non-operated spending as well as some changes in our U.S. activity mix account for most of the remaining capital increase.
Commentary and Technical Analysis
APA TA Chart short-term (Fun Trading stock tracker)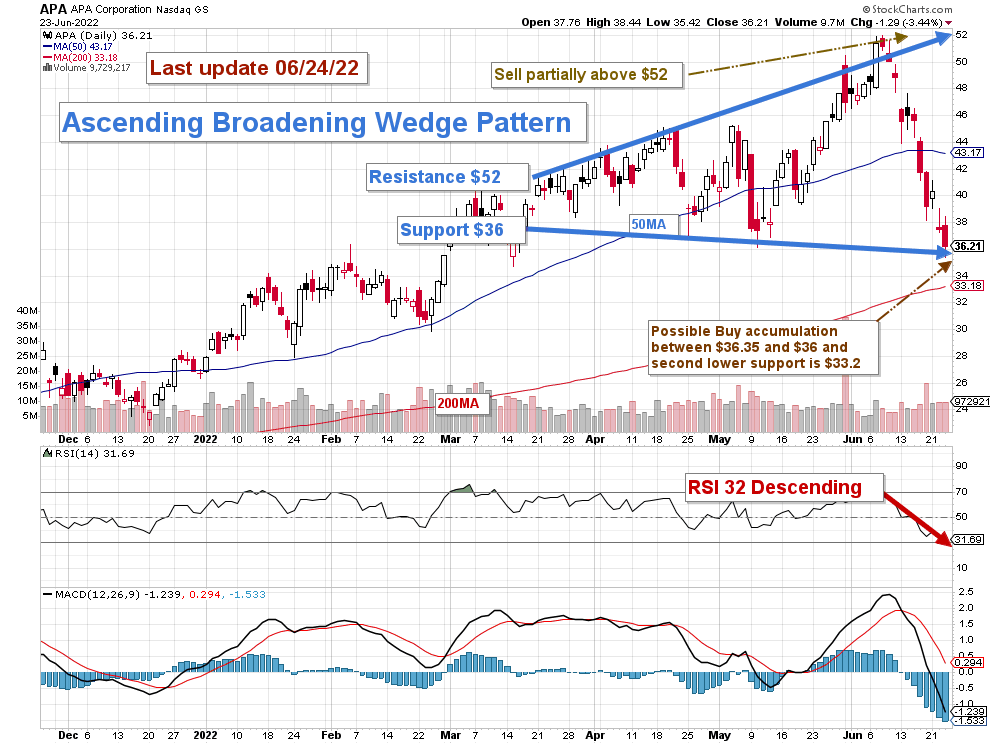
Note: The chart has been adjusted for the dividend.
APA forms an ascending broadening wedge pattern with resistance at $52 and support at $36. An ascending broadening wedge is a generally bearish chart pattern (considered a reversal pattern).
The short-term strategy is regularly trading LIFO at about 30%-35% of your position. I suggest selling above $52 and waiting for a retracement below $36.
However, The pattern is broadening, and it is doubtful that APA will reach the resistance indicated above short-term, and a better short-term strategy should be to take profits at the 50MA at around $42-43.
Also, if we look at the RSI, we can see that APA is close to an oversold position which gives another reason to accumulate at or below $36 with potential lower support at $33.
However, this simple strategy will have to be adjusted depending on the situation in Ukraine and the growing risk of stagflation which could hurt significantly the oil stocks that have been overheating over the past few months.
Watch oil prices like a hawk.
Note: The LIFO method is prohibited under International Financial Reporting Standards (IFRS), though it is permitted in the United States by Generally Accepted Accounting Principles (GAAP). Therefore, only US traders can apply this method. Those who cannot trade LIFO can use an alternative by setting two different accounts for the same stock, one for the long-term and one for short-term trading.
Warning: The TA chart must be updated frequently to be relevant. It is what I am doing in my stock tracker. The chart above has a possible validity of about a week. Remember, the TA chart is a tool only to help you adopt the right strategy. It is not a way to foresee the future. No one and nothing can.
Author’s note: If you find value in this article and would like to encourage such continued efforts, please click the “Like” button below to vote for support. Thanks.
Be the first to comment