

marekuliasz/iStock via Getty Images
Thesis
I published an article published back in March (March 17, 2022, to be exact) on Annaly Capital (NYSE:NLY). The article is entitled “Annaly Capital: Still Attractive Among mREITs, But mREIT Itself Under Pressure“. In that article, I correctly analyzed the macro forces that will continue to pressure the mREIT sector (mainly the narrowing yield spread). But I then went ahead and argued why NLY is still attractive based on the following considerations (I am quoting my own exact words):
- …as a leader in the sector, Annaly offers a reasonable combination of scale, safety, and valuation relative to other peers.
- But investors need to be aware that the mREIT sector itself is under pressure with the start of a new macro credit cycle, and NLY has its own unique challenges in addition.
From what happened afterward, you can see how well the title summarized my mistake. NLY’s stock price was ~$28 back in March when my article was published. And it sank to $15 in Oct, suffering a maximum drawdown of more nearly 50%. The performance of the whole sector (represented by REM) and AGNC Investment Corp (NASDAQ:AGNC) are equally miserable as you can see from the chart below.
The stock prices have recovered substantially from their bottom level thanks to two primary factors. First, the latest CPI data unexpectedly showed a moderation of inflation in October. The data showed a 7.7% inflation in October, slightly lower than the market expectation of 8.0% to 8.2%). The data triggered a large rally for the overall equity market unseen in years, bringing up NLY and AGNC stock prices along the way. The second reason involves their decent Q3 earnings reports (“ER”), as we will elaborate on in the next section immediately below.
However, in the remainder of this article, I will argue against both reasons. For the first reason, the recent lower-than-expected inflation data is only ONE data point, insufficient to establish any trend or draw any conclusion about the worst has passed. For the second reason, despite their decent Q3 results, I am still seeing the same macroscopic headwinds in play and do not see a fundamental change in their profitability outlook.
Source: Author based on Seeking Alpha data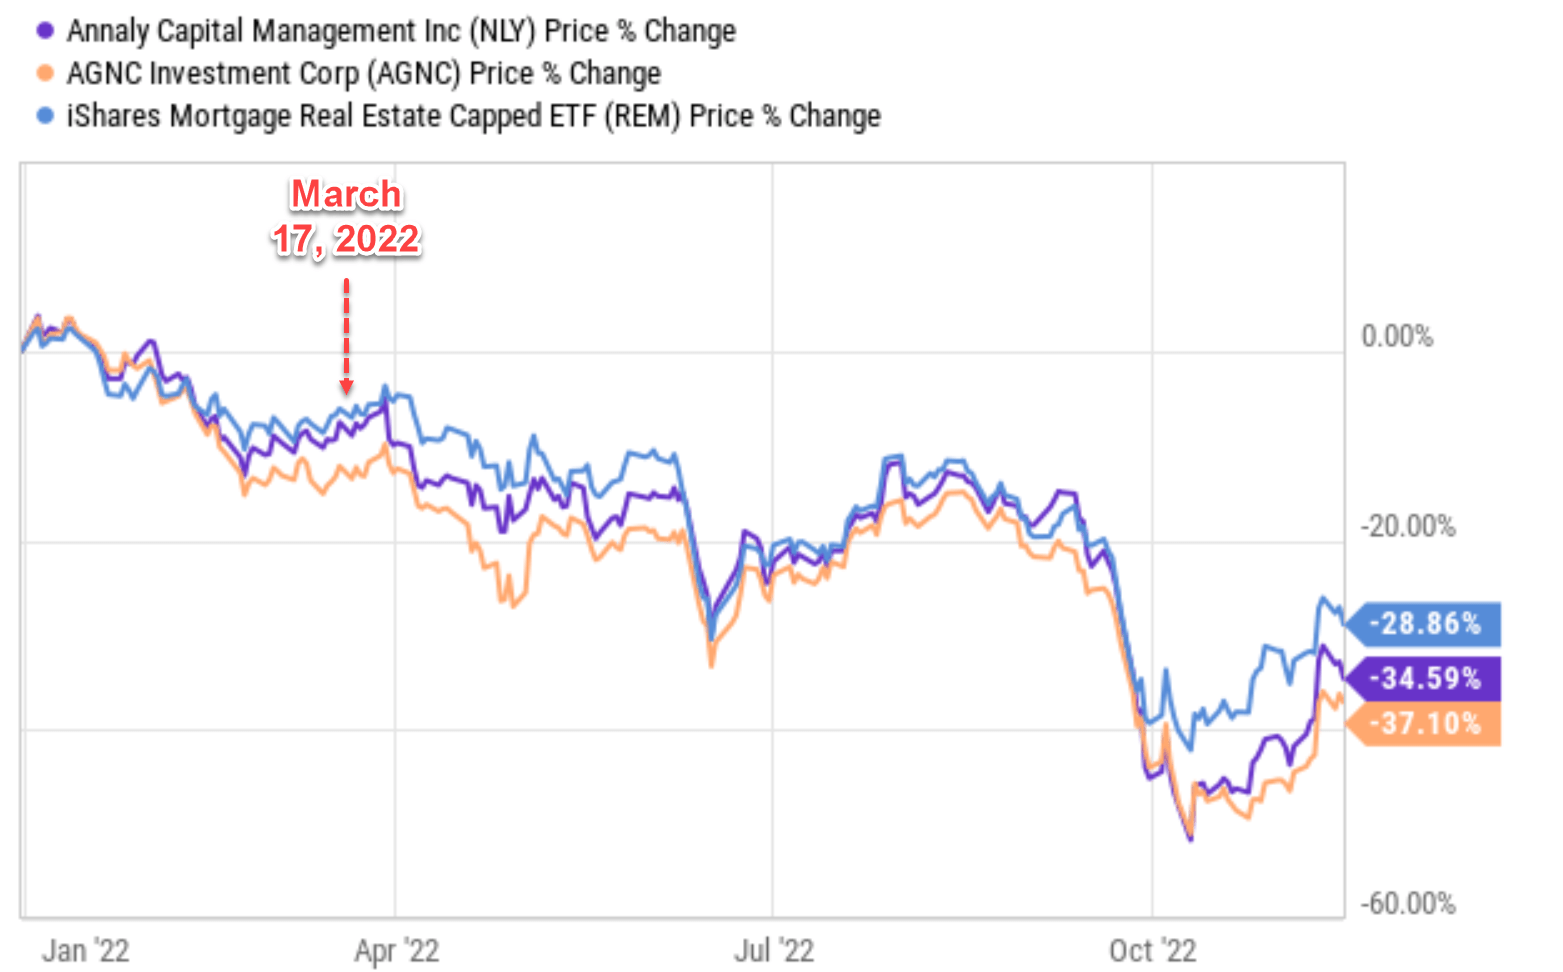
AGNC and NLY: Q3 recap
In their recent Q3 ER, both AGNC and NLY reported decent results. AGNC reported an EPS of $0.84 for Q3 on a Non-GAAP basis, beating consensus estimates by $0.15. And NLY also reported a Q3 Non-GAAP EPS (of $1.06) that beat consensus estimates (by $0.07). However, the picture is more concerning as we dig a bit deeper. Notably:
- Their GAAP net incomes are still in the red. AGNC reported a $2.01 loss per share on GAAP basis, representing a negative 17.4% economic return on tangible common equity. And similarly, NLY reported a loss of $0.70 per share for Q3, representing an economic return of negative 11.7%.
- And their leverages are still elevated due to a combination of book value loss and low equity prices. Take NLY as an example, its book value per common share dropped to $19.94 in Q3, leading to a GAAP leverage of 5.8x and an economic leverage of 7.1x. To provide a reference point, its GAAP leverage ratio was 5.4x in the prior quarter and the economic leverage ratio is 6.6x in the prior quarter.
Next, we will explore the implications of these above issues for their profitability prospects and valuation.
Source: NLY Q3 ER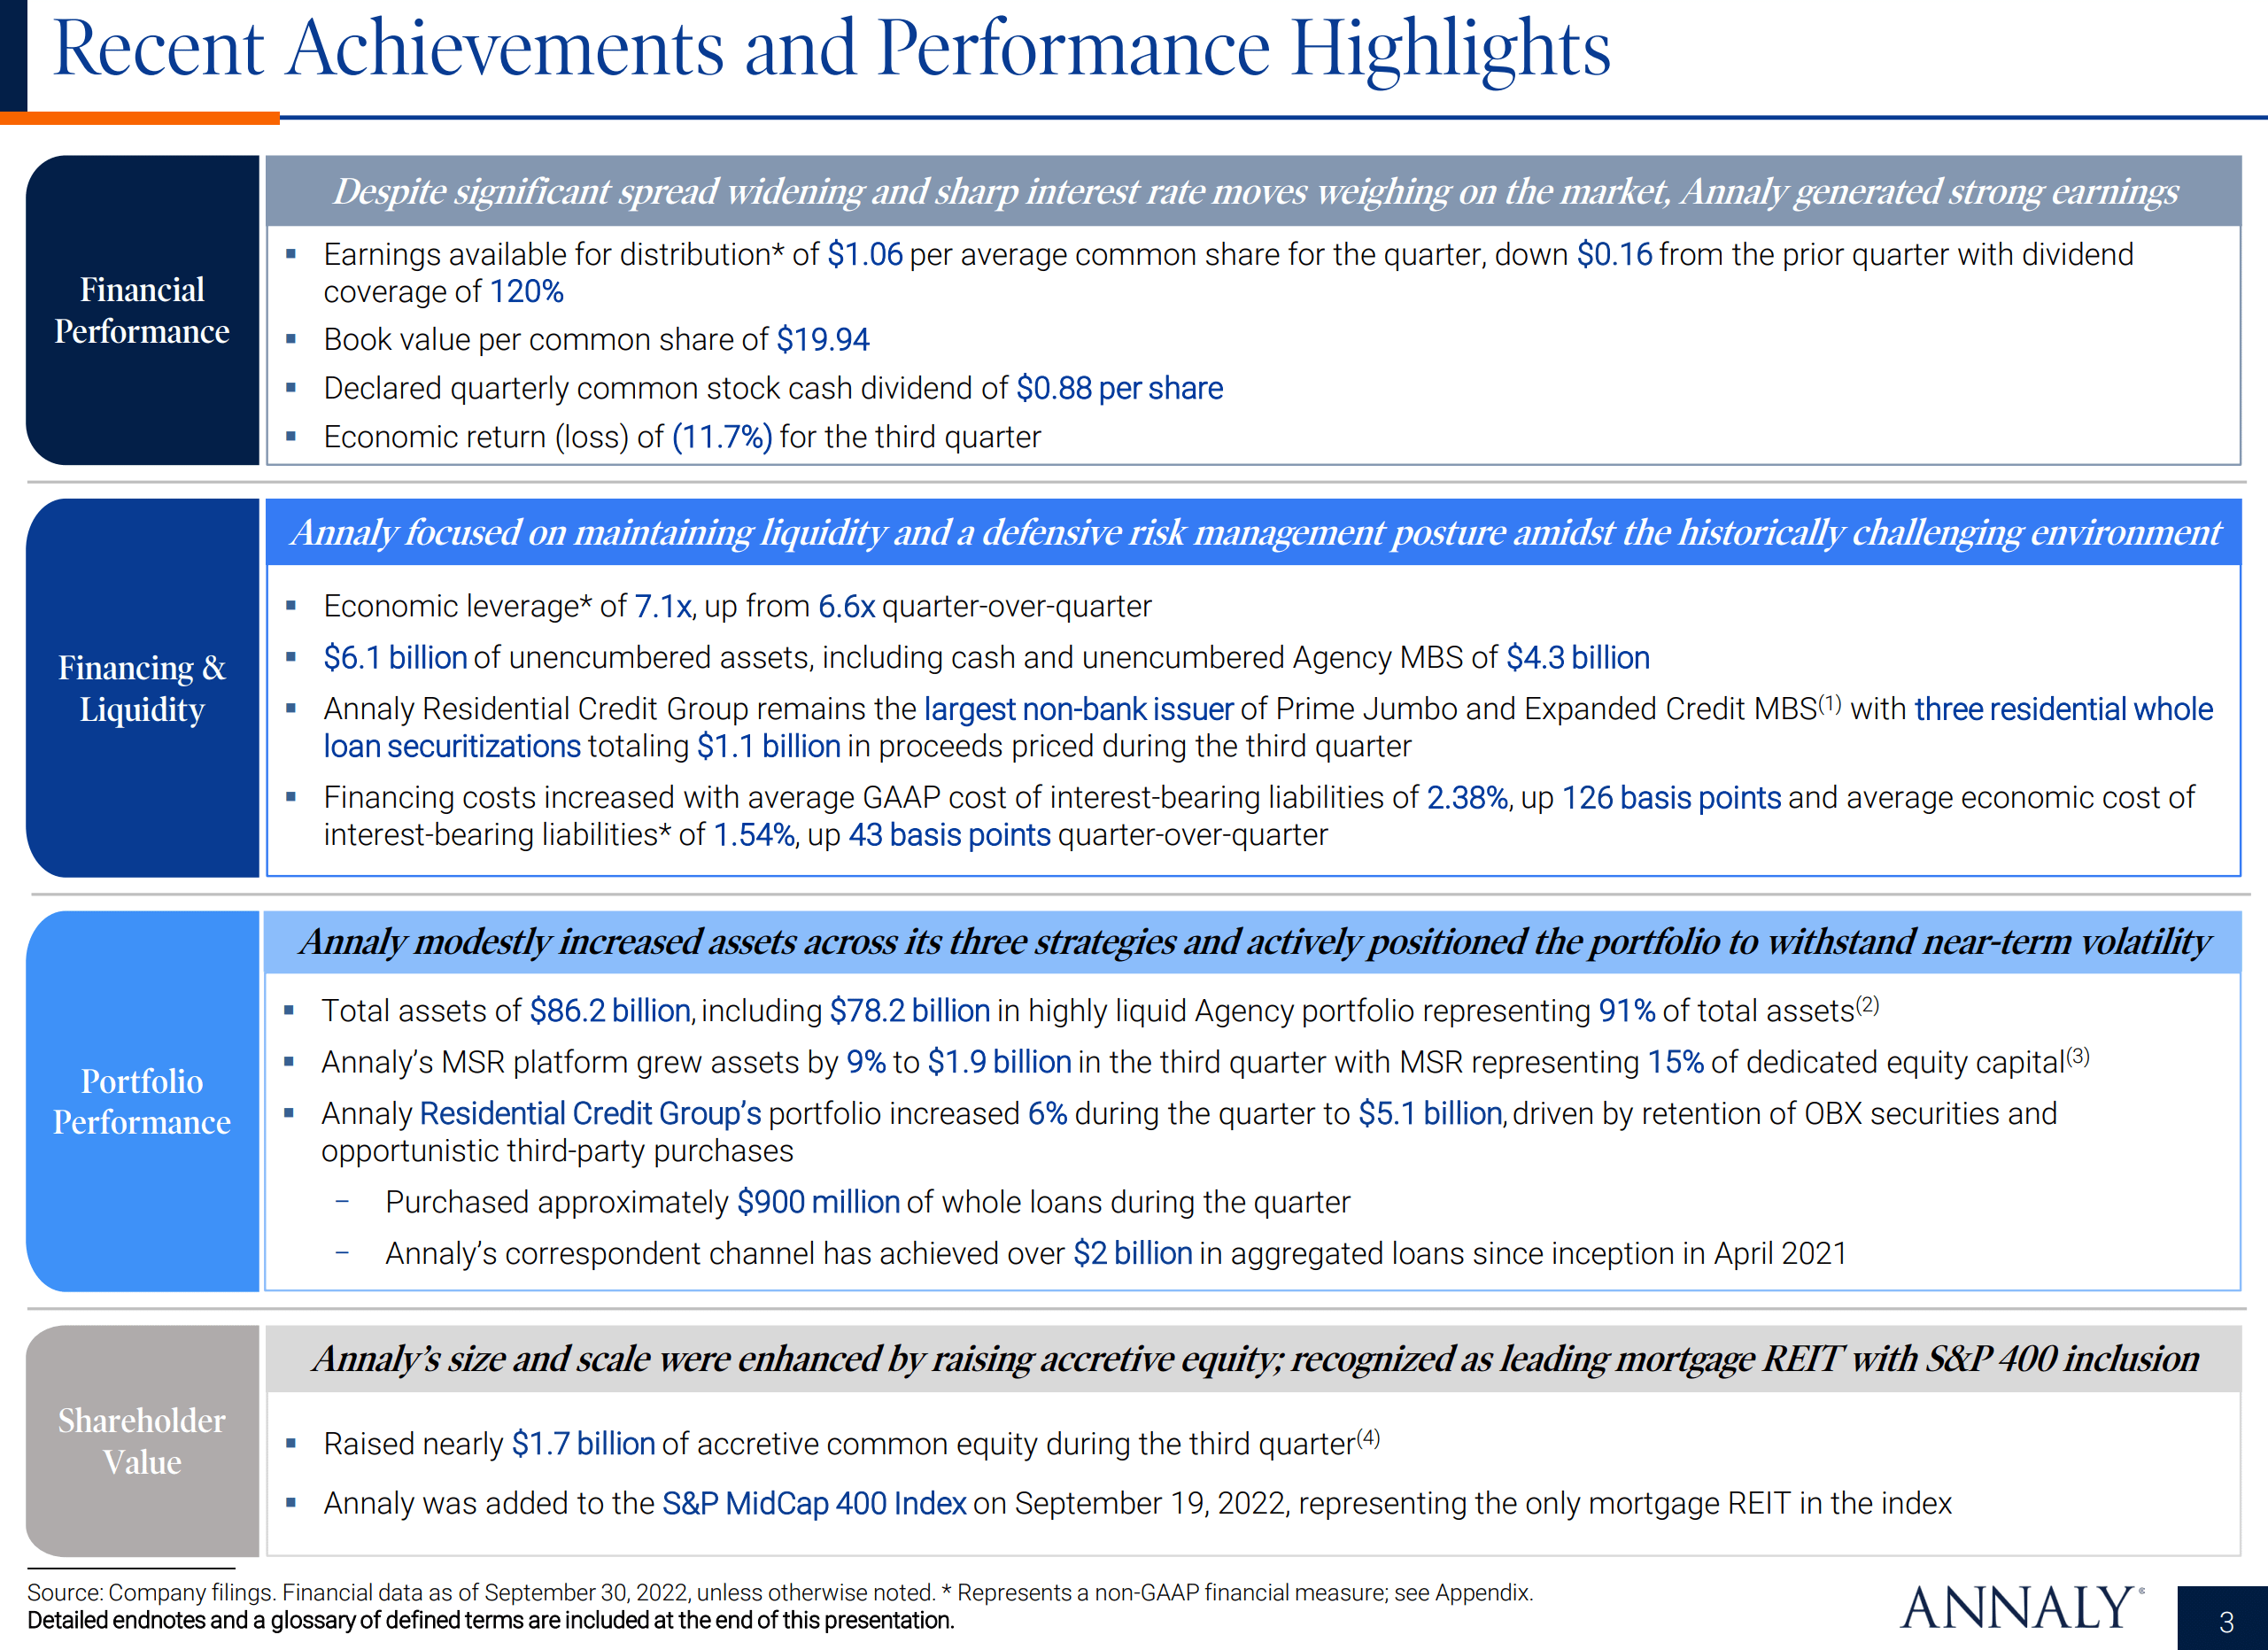
Yield curve still remains inverted
As aforementioned, one of the key reasons for my mistake made in March was that I forgot the fact that the mREIT sector – the whole sector – is one of the most sensitive sectors to the macro-debt cycle. As detailed the article:
The yield spread between short-term debt instruments and long-term instruments is the most effective indicator of the macro-credit (or debt) cycle. When yield spreads expand or contract, it can signal changes in the underlying economy or financial markets. The mREIT stocks like AGNC and NLY are typically the ones that are most sensitive about such yield spread changes because they make money on the spread between the long-term and short-term rates. The thicker the spread, the easier and the more money they can make, as you can clearly see from the following chart.
The chart I was referring to at that time was the one shown below. It displays how AGNC’s dividend payments, which I assumed to represent its economic earnings, change with yield spread (“YS”) over the credit and debt macro-cycle.
Source: Author based on FRED and Seeking Alpha data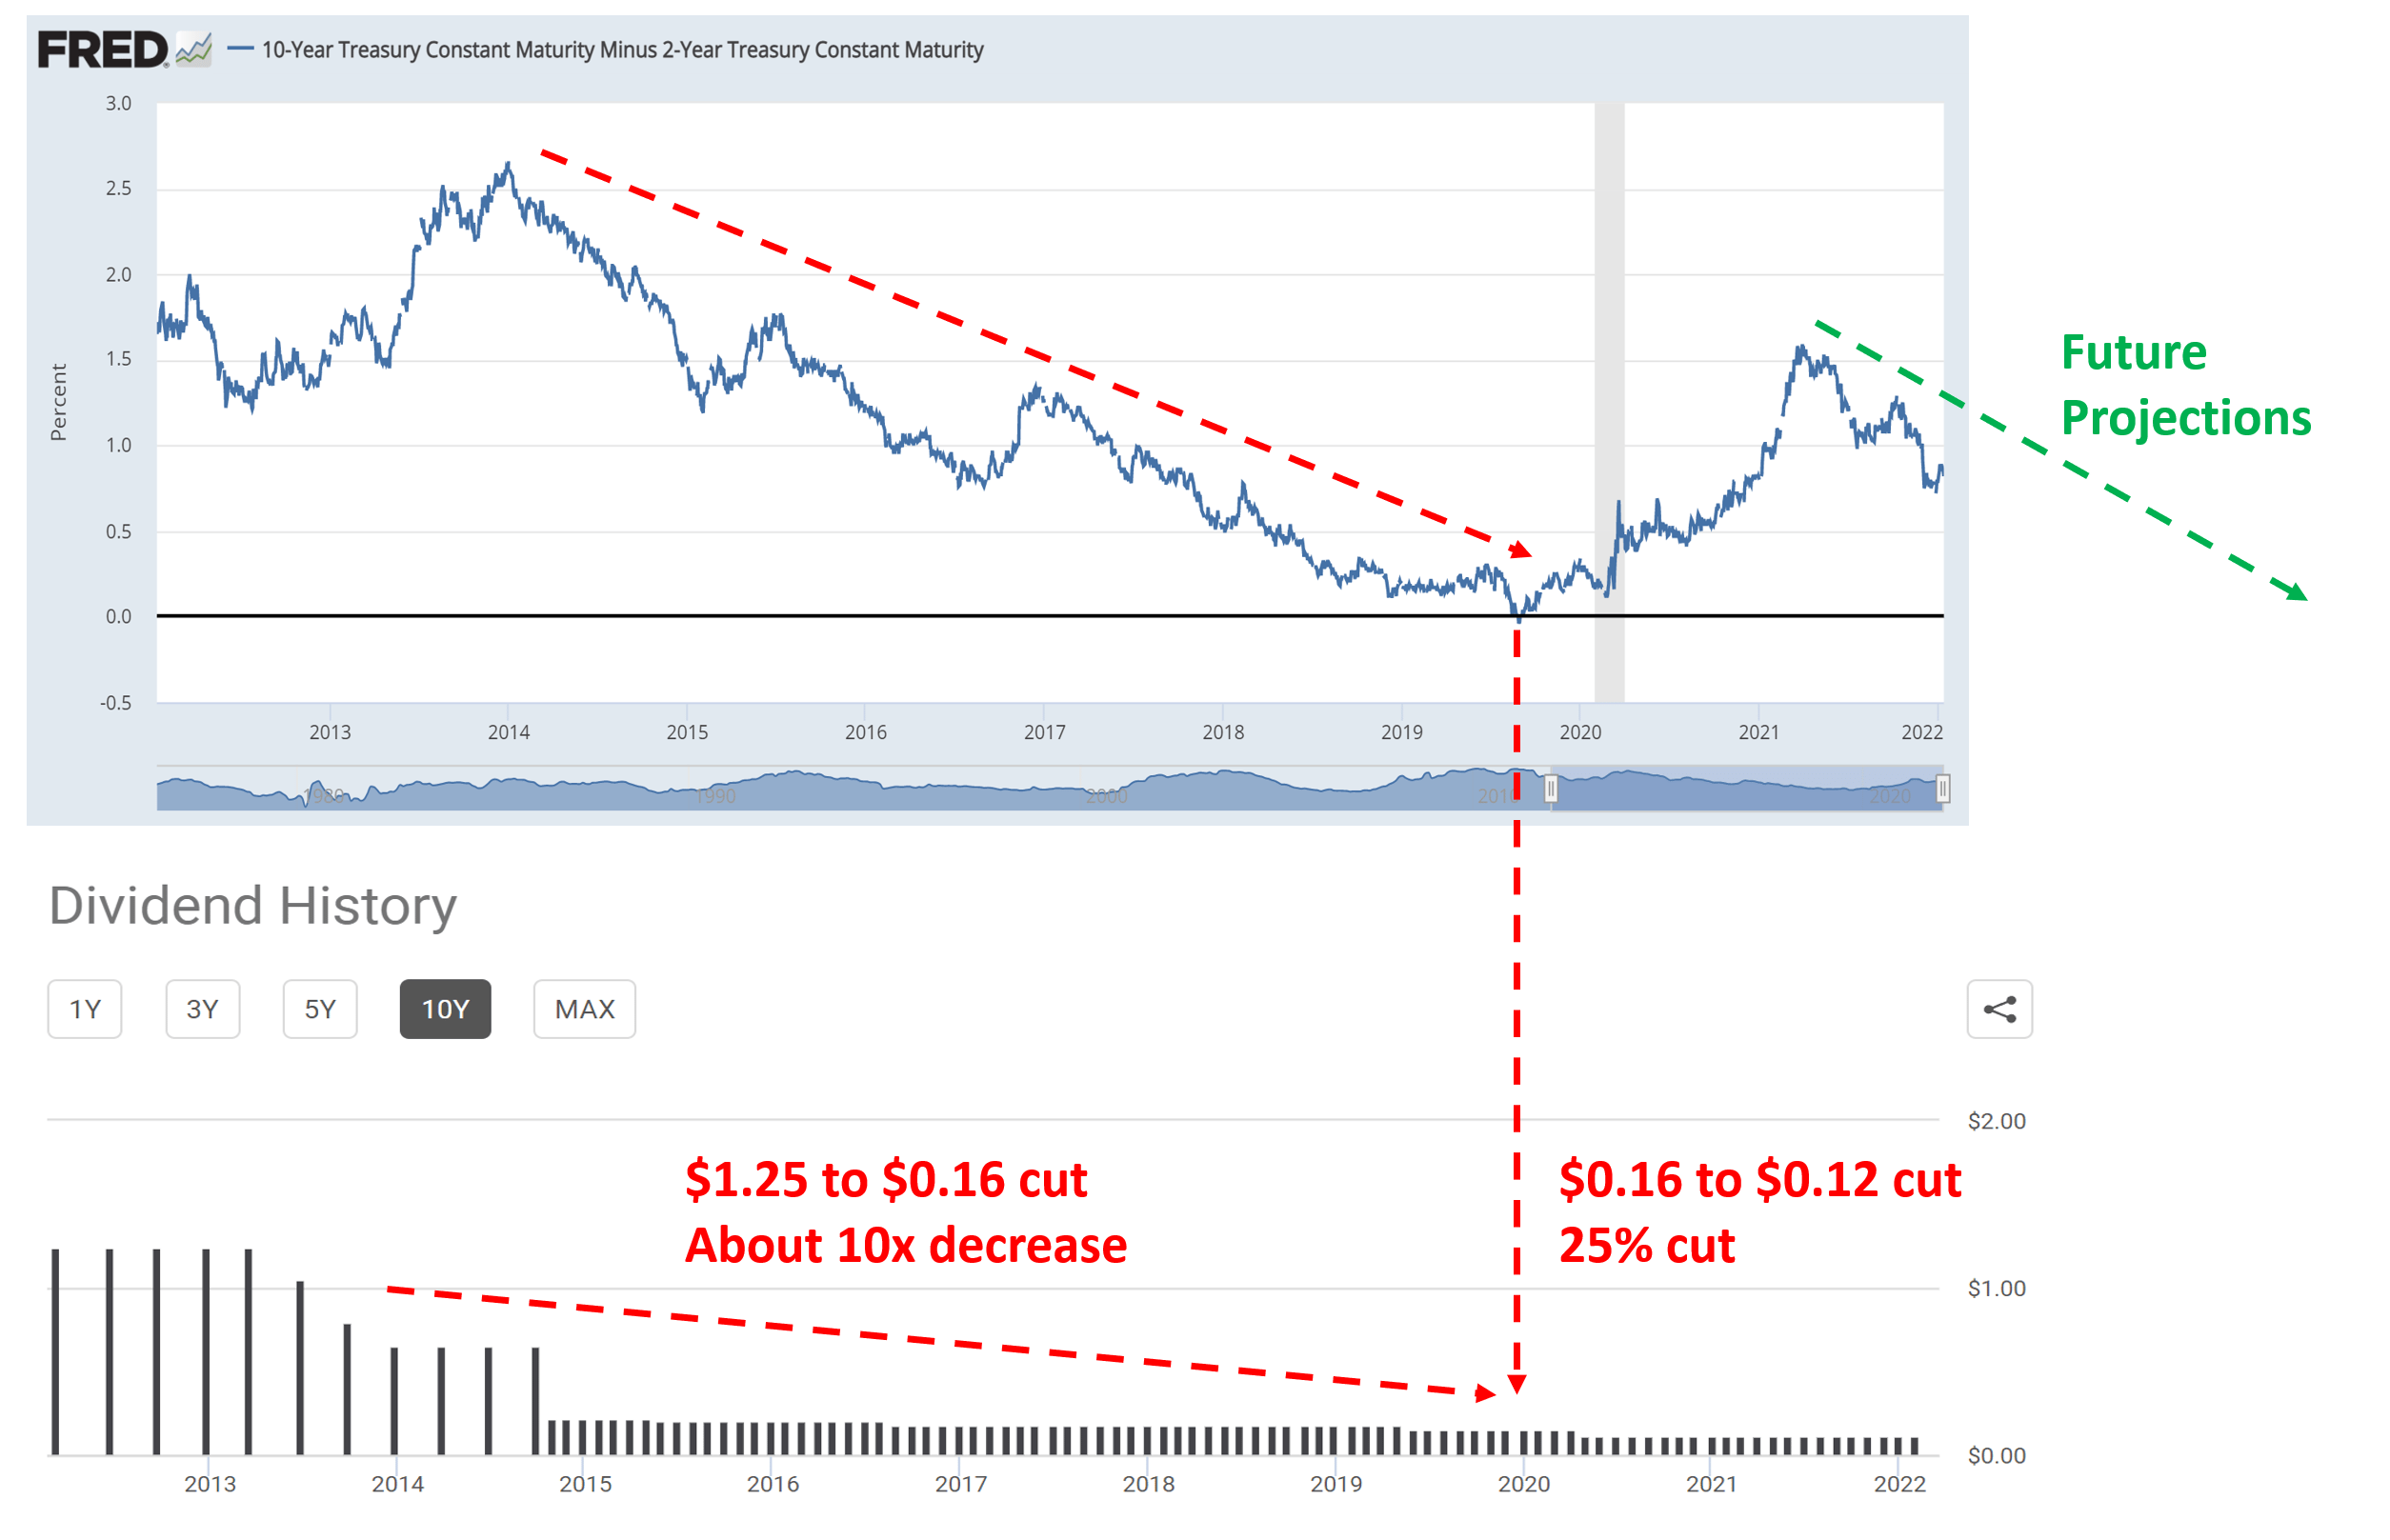
The YS has changed in the direction I predicted at that time. Back in March, the spread between the 10-year and 2-year treasury rates was still positive (although a very thin 0.26%). The YS then briefly dipped below zero in April 2022 as you can see from the chart below, and the yield curve then inverted in earnest starting in June. And as of this writing, the YS between the 10-year and 2-year rates is negative -0.68%. Against this background, the large price corrections mentioned above came as no surprise to me for both the mREIT sectors (as represented by REM) and its component stocks (such as NLY and AGNC).
Looking forward, I anticipate the yield curves to remain inverted for a while. As aforementioned, the recent lower-than-expected inflation data is only ONE data point, and the new inflation data could totally come out to be higher-than-expected. Furthermore, a 7.7% inflation is still quite high, especially when considered in combination with a range of uncertainties ongoing such as the Russian/Ukraine war and the war’s interruptions on the global supply of raw materials, food, and energy. I simply do not see the Fed is done with rate hikes given these factors.
Of course, Fed can only control the short end of the treasury rates. The long-term rates are governed by a completely different set of forces, and I do not see too much room for LT rates to rise above their current levels anymore. As argued in my earlier writings,
At a very fundamental level, in the long term, treasury bond rates cannot rise above long-term inflation or GDP growth. Our government has been relying on inflation and GDP expansion to inflate away and outgrowth its debt obligations for decades in the past. And it will (it will have to) continue doing so.
Given my above view about the long-term and short-term rates, I see the yield curve remaining inverted for a longer period of time to come, which would keep pressuring the mREIT sector. And NLY and AGNC’s profitability is no exception. Next, we will see that these macro forces can also impact their leverage and valuations.
Source: FRED data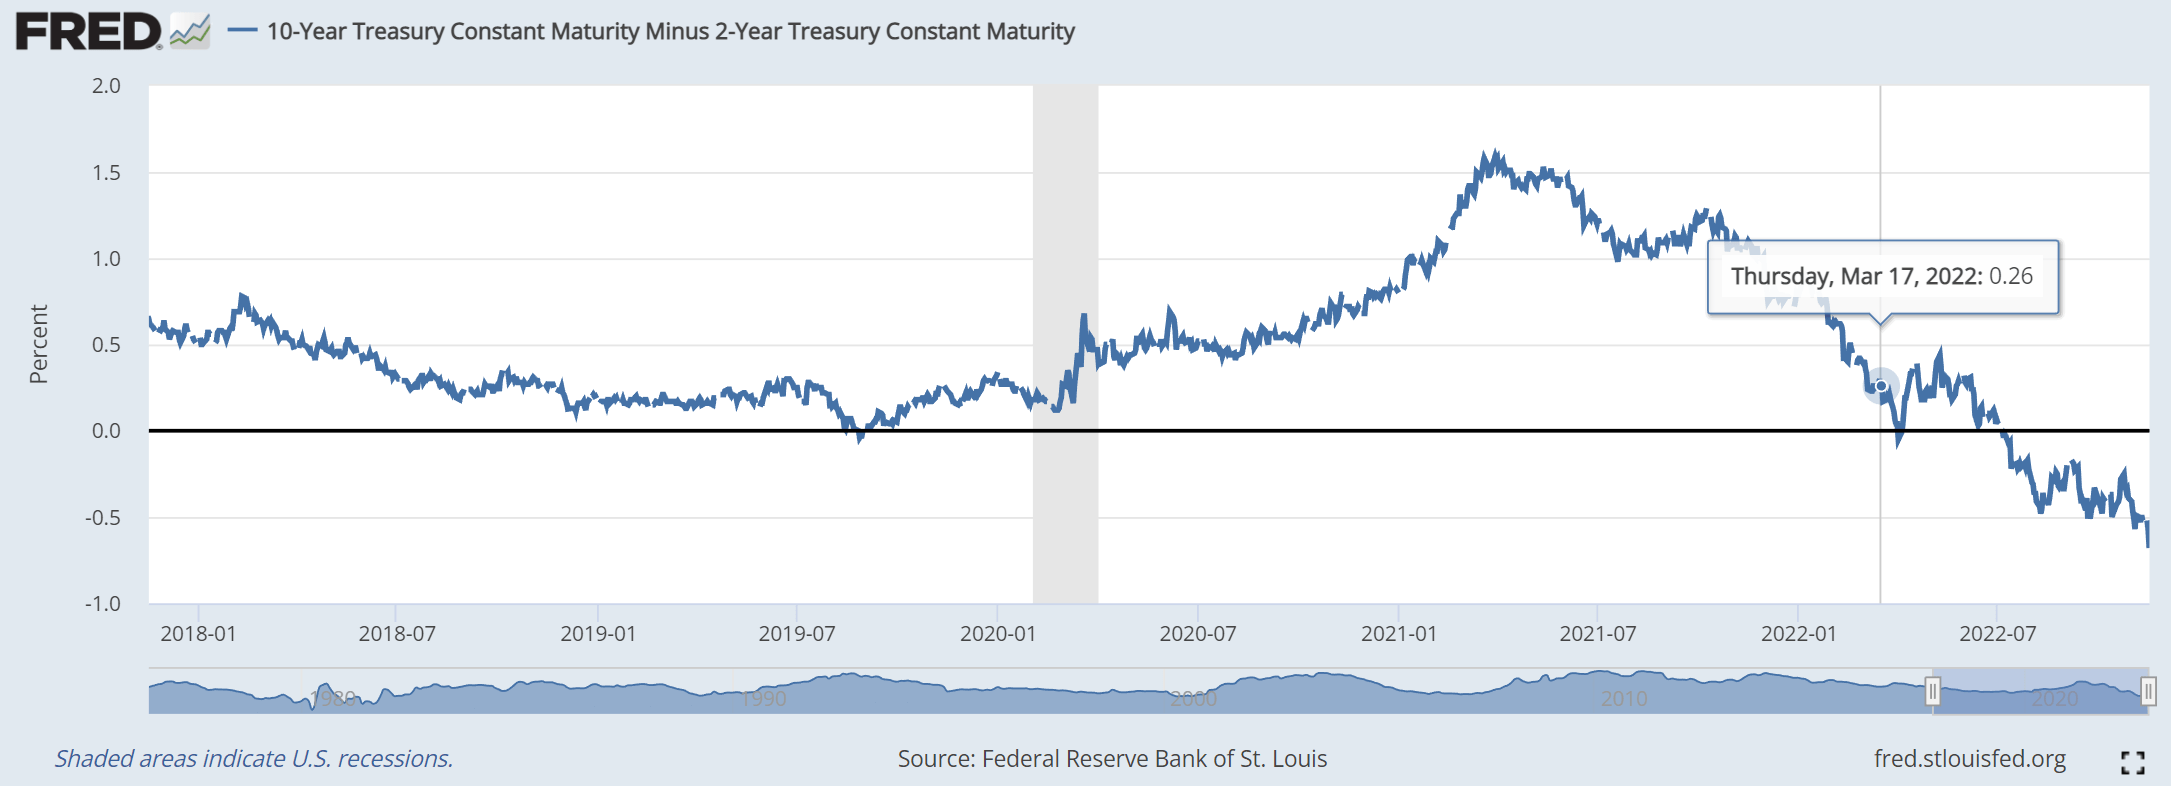
AGNC and NLY: leverage is concerning
As aforementioned, AGNC and NLY’s leverage ratios have been going up in Q3 even with the pressure ahead. Of course, they must have sensed the trouble ahead in early 2020 and started deleveraging, knowing that the Fed’s hard landing and epic QE cannot last forever. To wit, AGNC reduced its leverage ratio from about a peak of 12.8x in early 2020 to a bottom of 8.0x as you can see from the top panel of the following chart. In NLY’s case, it reduced its leverage ratio from a peak of 10.4x in early 2020 to a bottom of 5.9x.
Unfortunately, their leverage ratios have climbed back since then (and in NY’s case, even surpassed its previous peak) – again amid a yield curve inversion. AGNC’s leverage ratio climbed to 11.56x, not only far above its historical average of 9.245x but also very close to its peak value of 12.82x. And NLY’s picture is even more concerning, its current leverage ratio stands at 11.23x, not only far above its historical average of 8.05x but also setting a new record high since 2012.
Source: Seeking Alpha data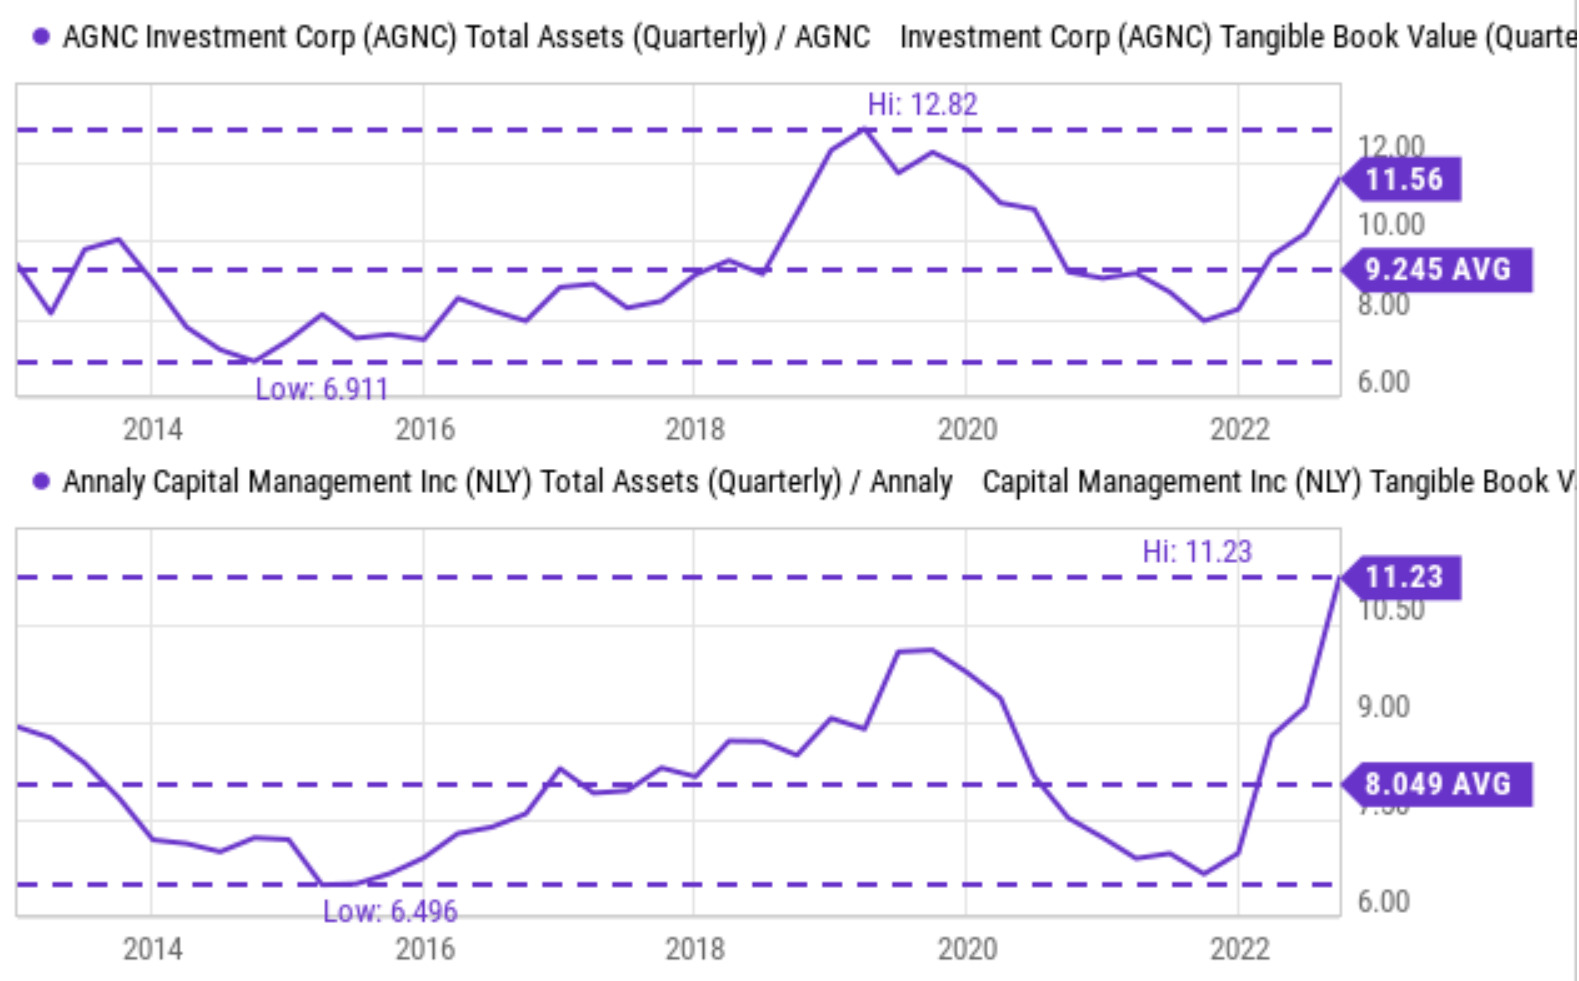
AGNC and NLY: book value losses and valuation concerns
Income-oriented investors might be attracted to AGNC and NLY’s high yields, which are indeed at mouth-watering levels now as you can see in the next chart below. To be specific, AGNC’s dividend yield fluctuated from as low as 7.1% to ~24% in the past 10 years, with an average of 12.2%. Its current yield of 13.95% is about 14% above its historical average. In NLY’s case, its yield fluctuated from about 6.8% to almost 26% in the past 10 years, with an average of 11.66%. Thus, its current yield of 17.2% is almost 50% above its historical average.
However, I want to warn potential investors against such yields. In my view, such yields, as high as they are on the surface, cannot properly compensate for the risks aforementioned. Such yield may not be sustainable with the profitability headwinds. And their loss of book value can trigger further stock price corrections, leading to negative total returns. And finally, their valuations are actually at a premium despite the troubles ahead (as elaborated on next), further shrinking the margin of safety.
Source: Seeking Alpha data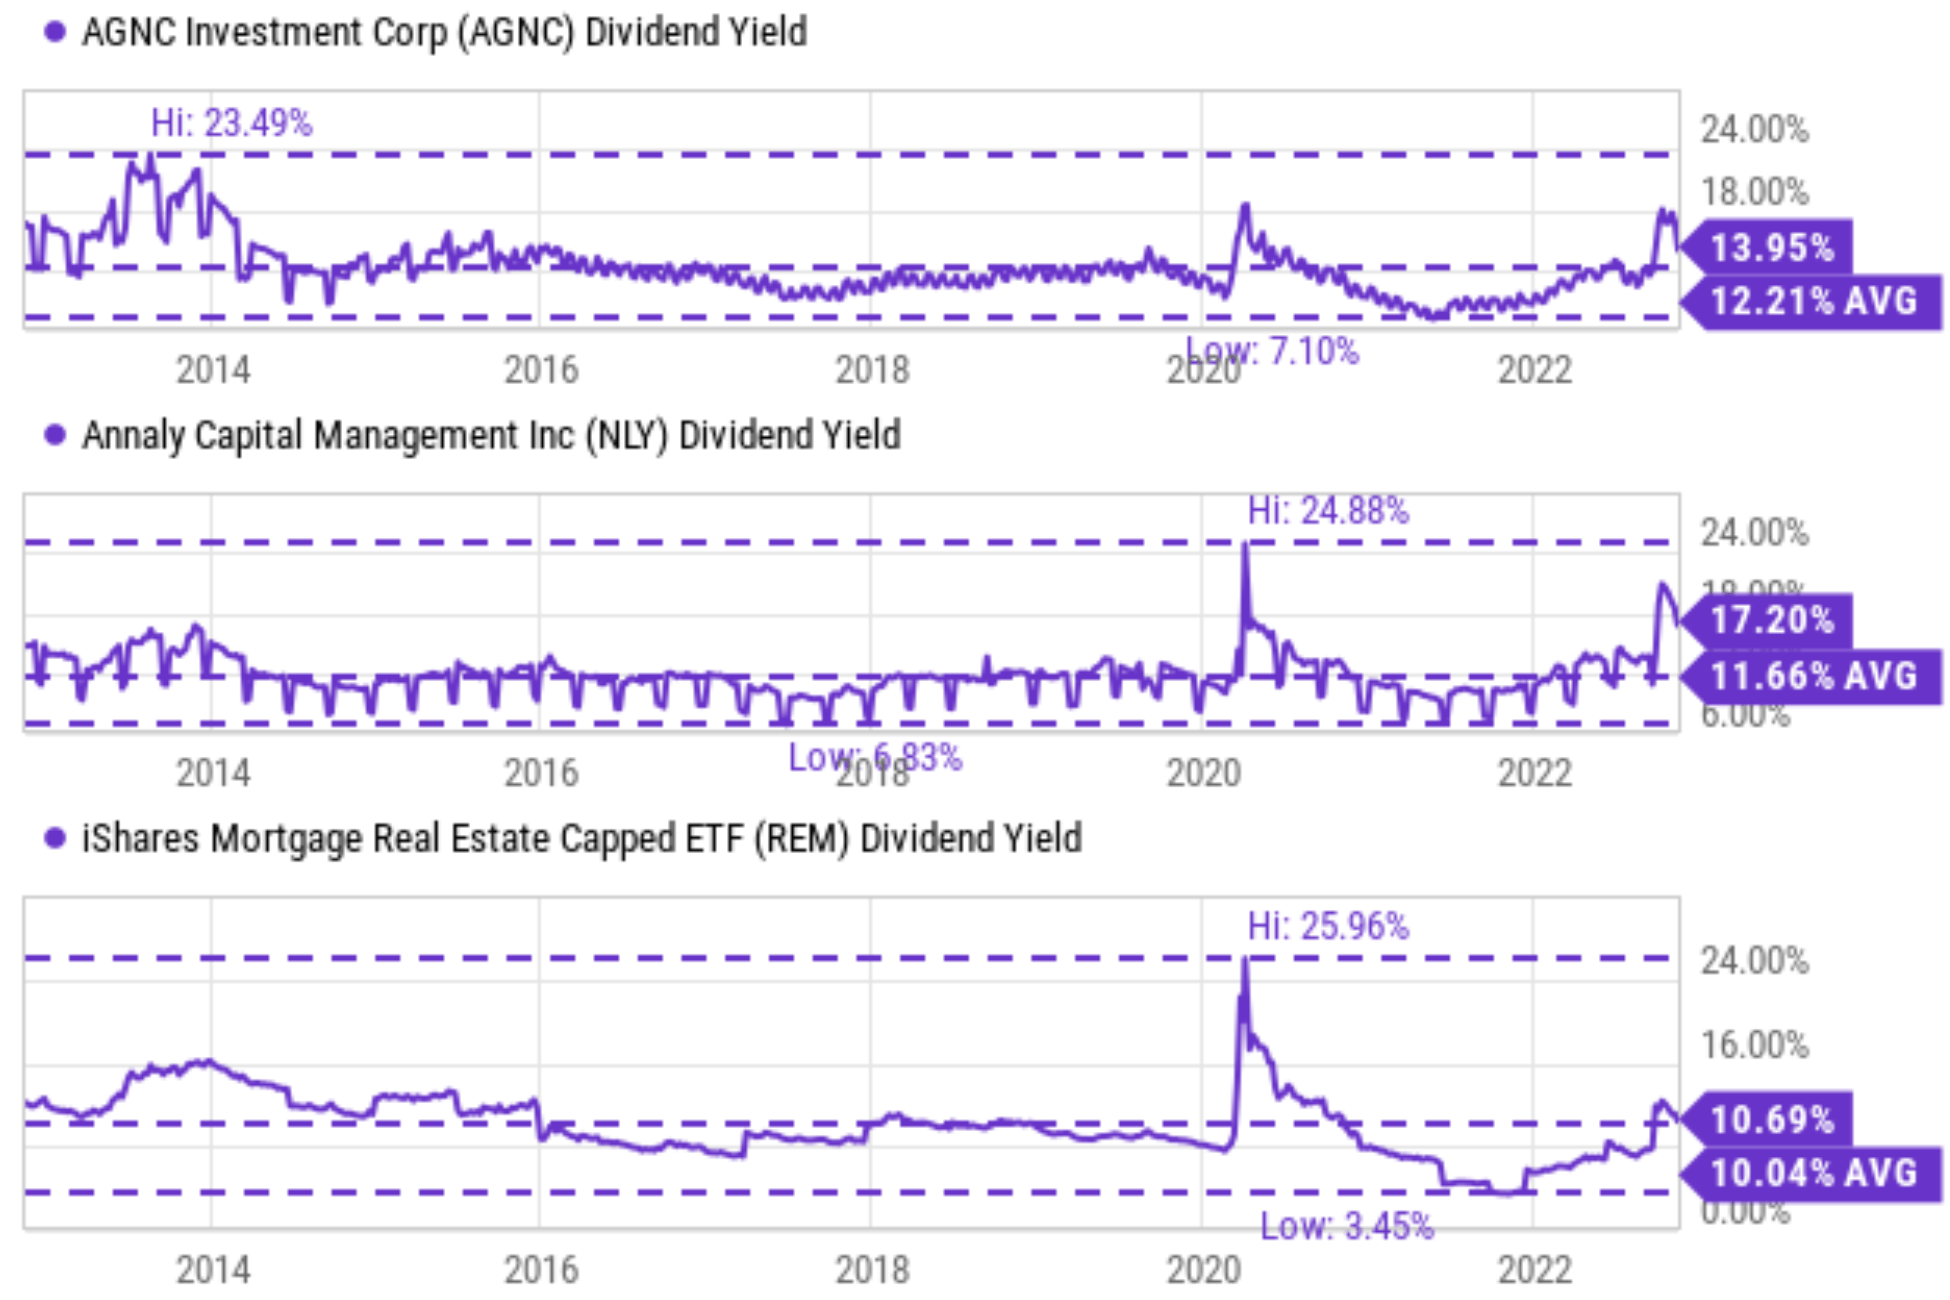
The next chart shows their valuations in terms of price to tangible book value (“TBV”) ratio, the most applicable metric in my view for mREIT stocks. As seen, AGNC’s average P/TBV ratio has been 0.945x historically. Currently, it is priced at 1.068x, a 7.2% premium compared to the historical average. In NLY’s case, it has been priced at an average T/PBV ratio of 0.984x in the past. And currently, it is at 1.258x, a whopping 28% premium compared to its historical average.
Source: Seeking Alpha data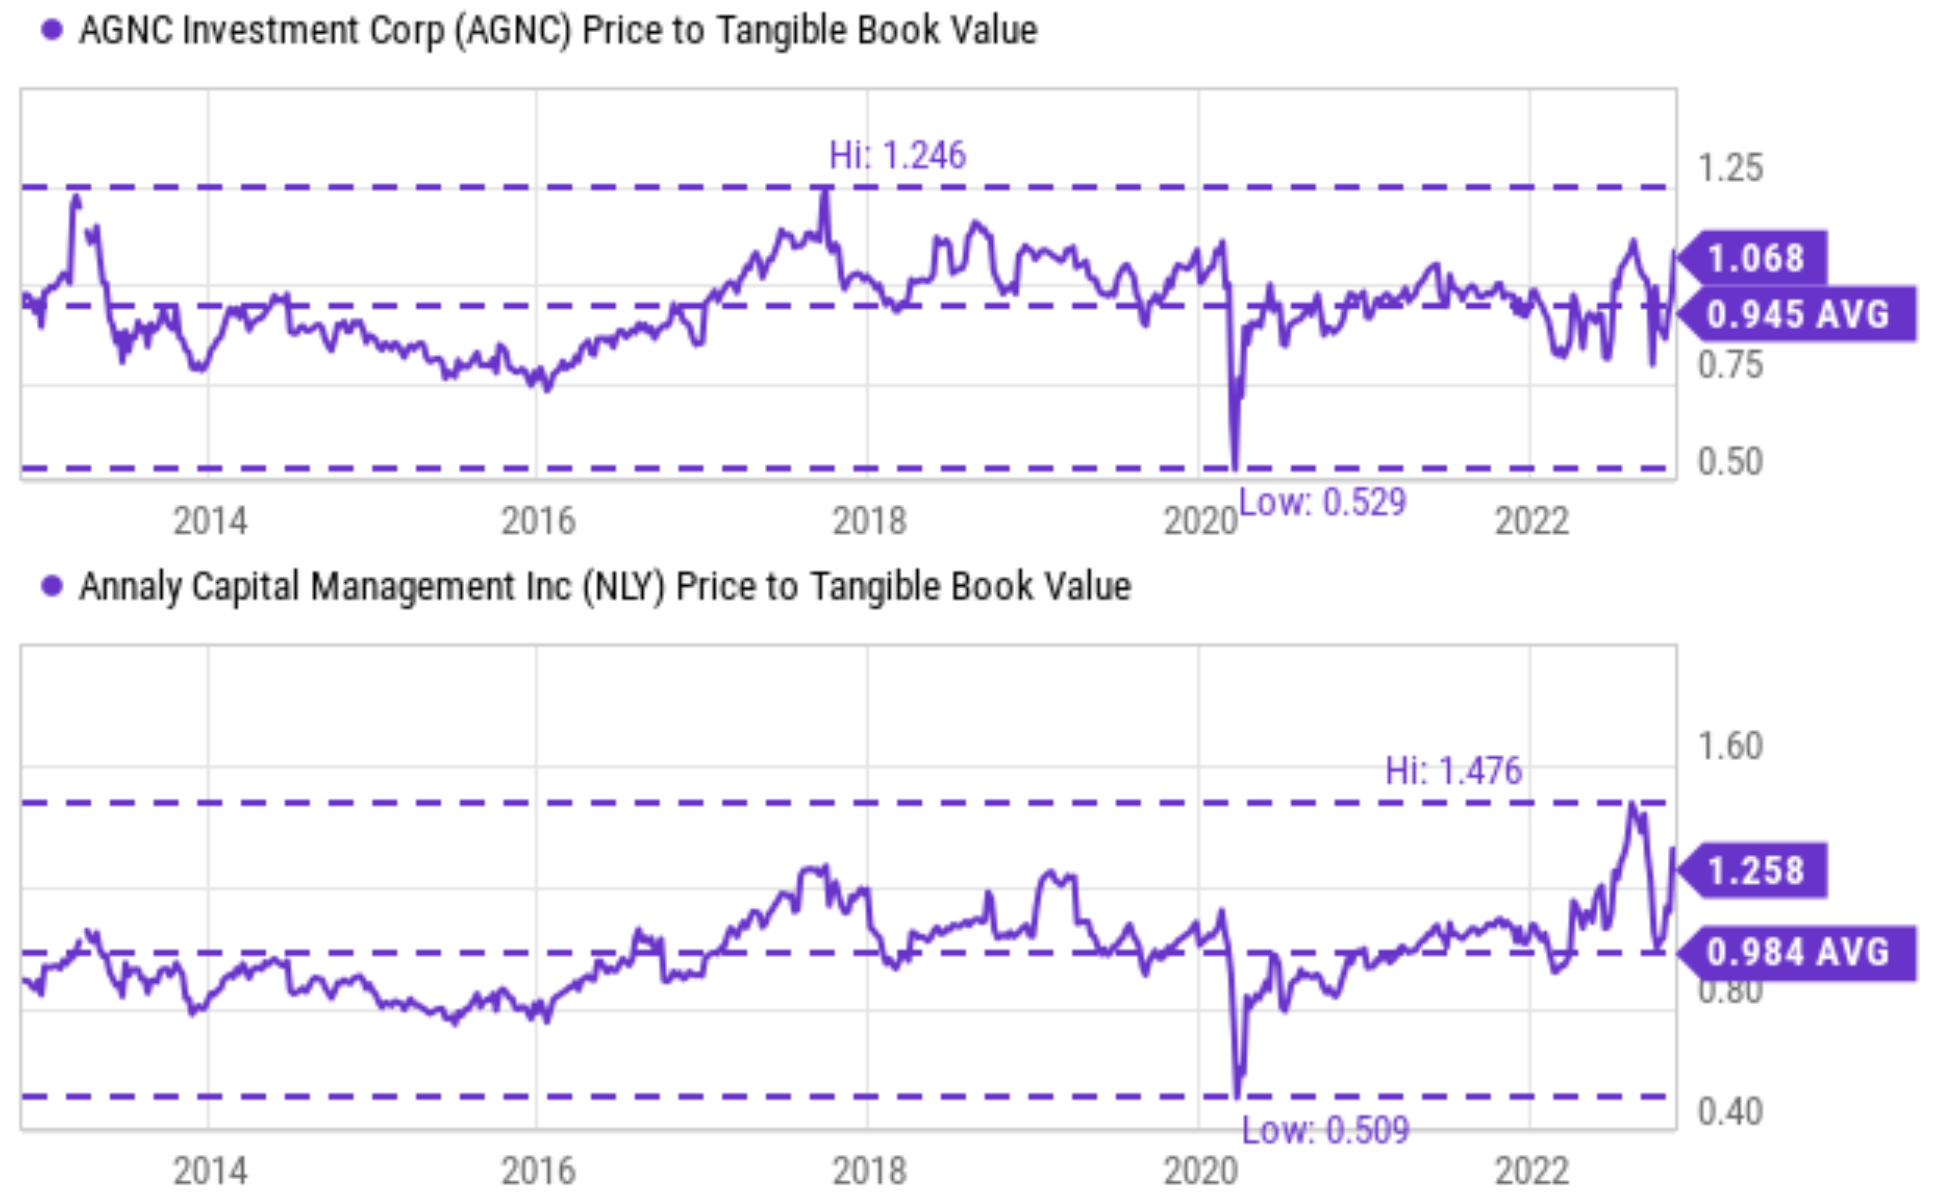
Other risks and final thoughts
To recap, no one is safe on a sinking ship, including the leaders. The whole mREIT sector and its leader both face large profitability risks given the inverted yield curve, the uncertainties of the overall economy, and the housing market. Besides these economic risks, AGNC and NLY (the mREIT sector too) also face substantial geopolitical risks now. The war between Russia and Ukraine could last much longer (it has already lasted longer than most people thought). The war could keep energy prices, raw material prices, and food prices at a high level in the foreseeable future. According to an estimate from Moody’s senior economist Ryan Sweet,
Such price increases are causing about $460 of extra living expenses per month for an average household. That would be $460 less dispensable income that can be applied toward mortgage payment (or to save toward a new mortgage). The issue would only compound on a national level with time if the war keeps dragging on.
To conclude, the key lesson I learned from my March mistake was simply this: it is just a much better idea to short a sinking ship (or at least stay away from it) than to pick survivals with the best chance. Do even take your chances with leaders such as AGNC and NLY. Especially do not be allured to their dividend yields and decent Q3 results. These factors are only secondary in my view compared to the macro headwinds at play. The high yields cannot properly compensate for the risks. They do not even properly compensate for the loss of book value the way I see it. And finally, their valuation premiums (quite sizable premiums especially in the case of NLY) further shrink the margin of safety.
Be the first to comment