

AntonioSolano
Notes to 30 September 2022
Our mission is for people to be surpassingly effective but not outrun machine-learning/AI systems in financial markets. The approach is to exploit the flaws in and users of statistical or mathematical models (e.g. Fermat and Pascal, Bayes), and instead use decision trees, as well as, grow our own collection of input-driven, fundamental predictive systems. More broadly, we aim to preserve and add competitive advantages throughout the investment process – from analysis, security selection, sizing, execution, to risk management.
All of this is utilised to generate investment returns aimed at being substantially in excess of those derived from mainstream equity strategies. When it comes to our performance focus, we believe we have plenty of competition but no peers. We are not in the business of educating but that of managing capital for those who picked us and follow the progress of their asset values.
In an era when most organisations are built with exits in mind, thereby squeezing or sweeping in as many customers as possible before ejecting, we admire organisations that have survived for over three generations and operate similarly in that we are gladly stuck with this business for the long haul without the ability to sell. We manage only one equity strategy.
Gross Investment Returns
|
Features & Portfolio Analytics
|
||||||||||||||||||||||||||||||||||||||||||||||
Portfolio
As you may know, the performance of equity markets and the portfolio were positive in intermittent periods leading up to 13 September. U.S. inflation data, released on 13 September, confirmed a second and consecutive month of flat inflation.
Below is the chart released by the U.S. BLS showing month-on-month CPI trends:
Month-on-month CPI trends (U.S. BLS )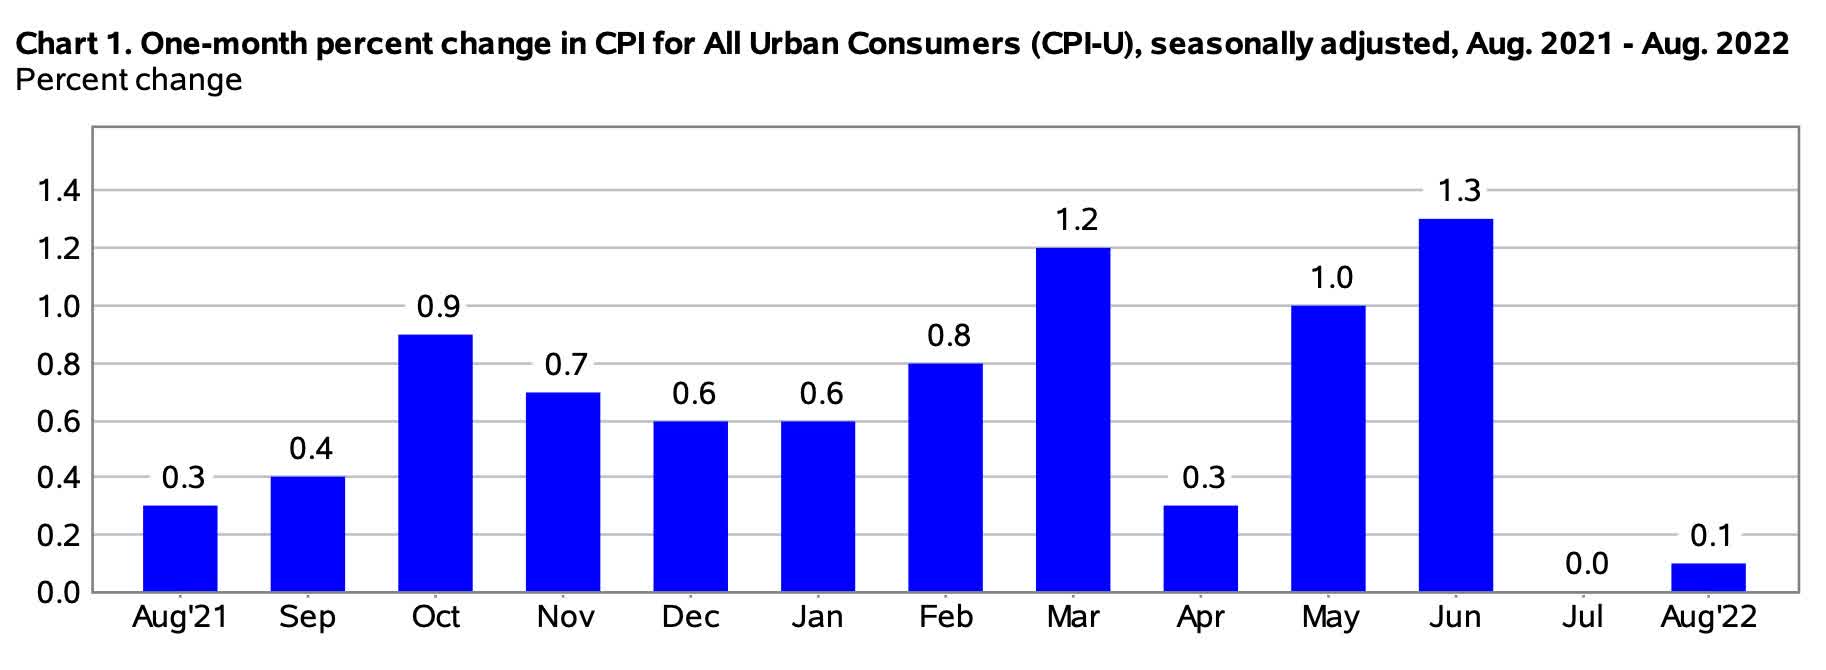
Equity markets declined unsatisfyingly however, as the Federal Reserve insisted on staying on its previously announced path, as opposed to being sensitive to or weighing this incoming data. Just to be clear, the world went from shouting ‘why can’t you see inflation is not transitory’ to ‘why can’t you see inflation is now running at an annualised rate of 1.2% per annum’.
As long as conditions i.e., input costs, consumer behaviour, business decisions on hiring and pricing, expectations of future price increases etc., stay similar to that observed in July/August 2022, CPI on a year-on-year basis will mathematically decline to low levels.
Opinions aside, if CPI is running at an annualised rate of ~1.2% and the Federal Reserve executes on its signaled plans to raise the federal funds rate to 4.25% to 4.50%, the real rate would be markedly positive.
The upside for our portfolio, and investors more broadly, lies in the fact that this level of tightness is well in excess of what is desired by even the most hawkish of central bankers. Particularly so, when considered in the context of large public debt.
Since the August CPI release, the climate has deteriorated and the ratio of job vacancies to unemployed people (which is a metric influencing monetary policy) has declined from 2:1 to 1.67:1 – both of which should be putting further downward pressure on CPI.
The stocks we hold are all great businesses that will steer through the environment. I believe portfolios that can avoid being whipsawed, and tie themselves to great businesses, will be set up for great results two, five, and ten years out.
In the near term, there are three more releases of CPI data in calendar 2022, as well as two more scheduled Federal Reserve meetings, and they cannot come soon enough.
Portfolio Positioning
At month end, the portfolio held 10 stocks – 10 listed in USA. Subsequent to month end, the portfolio exited one stock and reinvested the proceeds into remaining positions.
At month end, the portfolio had a gross exposure of 96.4%, consisting of 96.4% long and 0% short; as well as 3.6% in cash. Subsequent to exiting one stock, the cash weighting increased by a few percentage points.
In terms of liquidity, the weighted average market capitalisation is A$124 billion and the stock with the smallest market capitalisation is circa A$3 billion.
Cumulative Gross Investment Returns
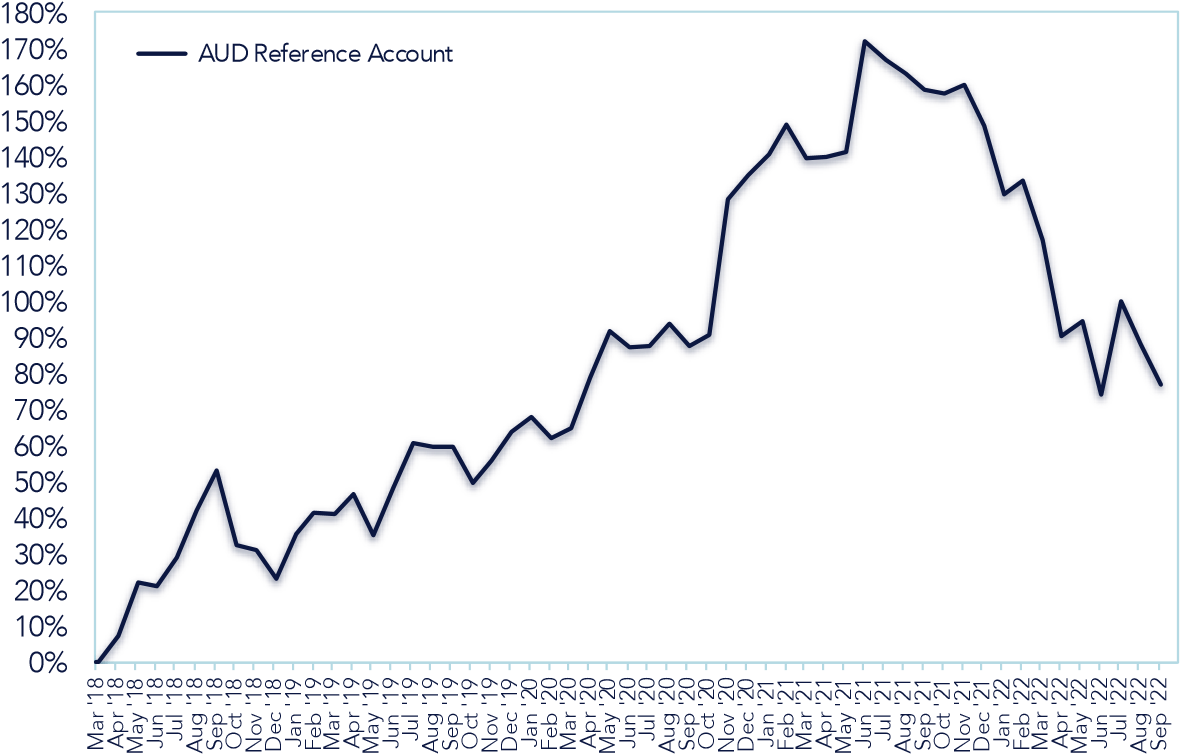
Growth of An Assumed $500,000 Investment in The Reference Account
|
Date |
Gross Returns |
Gross Monthly Returns |
|
27 Mar 18 |
$500,000 |
|
|
Mar 18 |
$500,859 |
+0.17% |
|
Apr 18 |
$536,101 |
+7.04% |
|
May 18 |
$611,001 |
+13.97% |
|
Jun 18 |
$605,669 |
-0.87% |
|
Jul 18 |
$645,902 |
+6.64% |
|
Aug 18 |
$710,053 |
+9.93% |
|
Sep 18 |
$766,429 |
+7.94% |
|
Oct 18 |
$662,130 |
-13.58% |
|
Nov 18 |
$655,769 |
-0.99% |
|
Dec 18 |
$615,634 |
-6.12% |
|
Jan 19 |
$677,324 |
+10.02% |
|
Feb 19 |
$707,893 |
+4.51% |
|
Mar 19 |
$705,362 |
-0.36% |
|
Apr 19 |
$733,917 |
+4.05% |
|
May 19 |
$676,106 |
-7.88% |
|
Jun 19 |
$741,201 |
+9.63% |
|
Jul 19 |
$803,346 |
+8.38% |
|
Aug 19 |
$797,733 |
-0.70% |
|
Sep 19 |
$798,650 |
+0.11% |
|
Oct 19 |
$748,230 |
-6.31% |
|
Nov 19 |
$779,172 |
+4.14% |
|
Dec 19 |
$818,501 |
+5.05% |
|
Jan 20 |
$839,480 |
+2.56% |
|
Feb 20 |
$810,870 |
-3.41% |
|
Mar 20 |
$824,619 |
+1.70% |
|
Apr 20 |
$893,734 |
+8.38% |
|
May 20 |
$958,217 |
+7.22% |
|
Jun 20 |
$935,799 |
-2.34% |
|
Jul 20 |
$937,519 |
+0.18% |
|
Aug 20 |
$968,929 |
+3.35% |
|
Sep 20 |
$937,822 |
-3.21% |
|
Oct 20 |
$953,314 |
+1.65% |
|
Nov 20 |
$1,142,256 |
+19.82% |
|
Dec 20 |
$1,174,271 |
+2.80% |
|
Jan 21 |
$1,203,102 |
+2.46% |
|
Feb 21 |
$1,244,352 |
+3.43% |
|
Mar 21 |
$1,197,558 |
-3.76% |
|
Apr 21 |
$1,200,664 |
+0.26% |
|
May 21 |
$1,207,360 |
+0.56% |
|
Jun 21 |
$1,360,798 |
+12.71% |
|
Jul 21 |
$1,334,451 |
-1.94% |
|
Aug 21 |
$1,316,021 |
-1.38% |
|
Sep 21 |
$1,293,864 |
-1.68% |
|
Oct 21 |
$1,288,297 |
-0.43% |
|
Nov 21 |
$1,300,476 |
+0.95% |
|
Dec 21 |
$1,243,326 |
-4.39% |
|
Jan 22 |
$1,148,822 |
-7.60% |
|
Feb 22 |
$1,166,565 |
+1.54% |
|
Mar 22 |
$1,085,247 |
-6.97% |
|
Apr 22 |
$952,339 |
-12.25% |
|
May 22 |
$973,380 |
+2.21% |
|
Jun 22 |
$871,340 |
-10.48% |
|
Jul 22 |
$1,000,517 |
+14.83% |
|
Aug 22 |
$939,974 |
-6.05% |
|
Sep 22 |
$884,736 |
-5.88% |
Thank You and In Touch
Thank you for reading this Andaz note/update. If you would like to drop us a line, please reach out using the contact form on our website Andaz®.
Yours sincerely,
Yizhong Chan
|
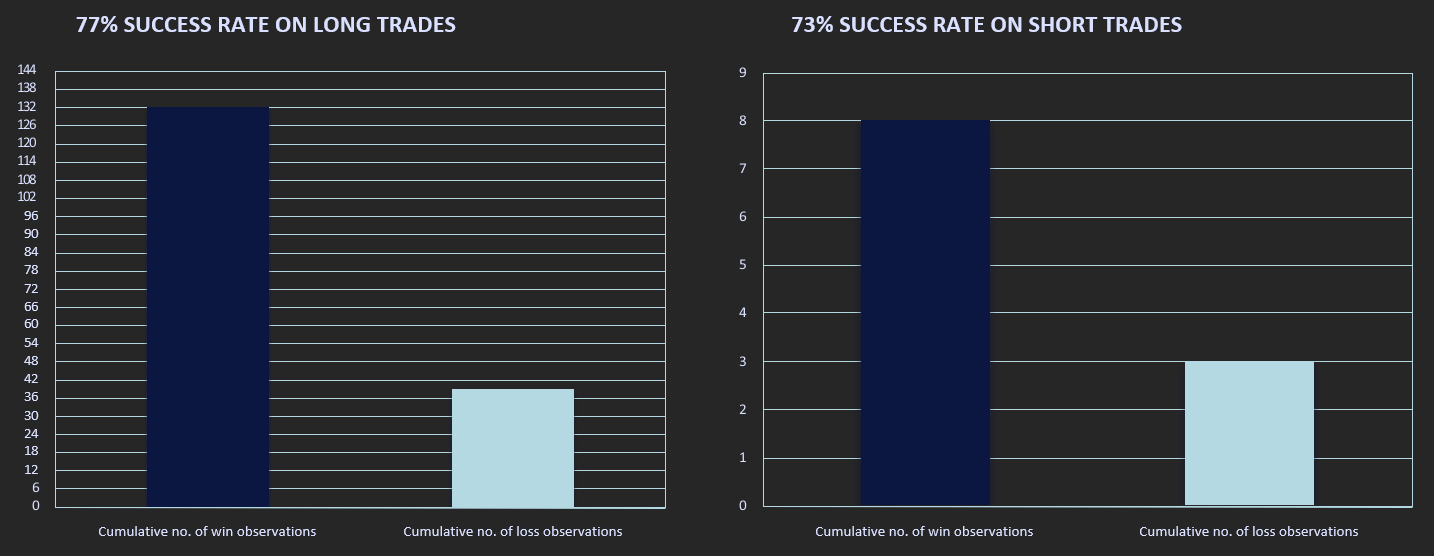
© 2022 Andaz Private Investments Pty Ltd (“Andaz”). The information contained herein is being provided to investors in Andaz products (collectively the “Funds”). This document and the information herein is confidential and not for further dissemination. This report is for distribution only under such circumstances as may be permitted by applicable law. All information contained herein relates to the Andaz AUD product, unless otherwise specified. All NAV figures were taken directly from actual statements generated by Interactive Brokers, and are unaudited. Each client will receive individual statements showing returns from the custodian. Actual results may differ from the data presented due to the timing of each investors’ capital activity, account parameter restrictions, and other such factors. While the performance results of the Funds may have been compared here with the performance of well-known and widely recognised indexes, the indexes have not been selected to represent an appropriate benchmark of the Funds whose holdings, performance, and volatility may differ significantly from the securities that comprise the indexes. The performance data is for sovereign/institutional investors who usually negotiate fees, are subject to varying brokerage commissions, and may not be subject to non-resident dividend withholding taxes. For actual results net of all fees, applicable expenses and taxes, please refer to individual statements provided by the custodian. Past performance is not necessarily indicative of future results. Had the highest fee structure, and all expenses and all taxes been applied, performance results would likely be lower. Cumulative no. of win-loss observations since inception includes security selection, re-entering an exited but previously owned security and decisions to materially re-weight existing positions, but exclude foreign exchange attribution. The information contained herein reflects the opinions and projections of Andaz as of the date of publication, which is subject to change without notice at any time subsequent to the date of issue. Andaz does not represent any opinion, estimate or projection will be realised. The information presented in this document is not intended to be, nor should it be construed as, investment advice. It has not been prepared taking into account any particular investor’s or class of investor’s investment objectives, financial situation, circumstances or needs, and should not be used as the basis for making investment, financial or other decisions. This shall not constitute an offer to sell or the solicitation of an offer to buy any interests in any product managed by Andaz. Such an offer to sell or solicitation of an offer to buy interests may only be made pursuant to definitive subscription documents between Andaz and an investor. The information provided should not be deemed a recommendation to purchase or sell any specific security. Andaz has an economic interest in the price movement of the securities discussed in this document, but is subject to change without notice. While the information in this document has been prepared with all reasonable care, neither Andaz nor its affiliates makes any representation or warranty as to the accuracy or completeness of any statement in this document. To the extent permitted by law, no liability is accepted for any loss or damage as a result of any reliance on this information. This document may contain forward-looking statements regarding our intent, belief or current expectations with respect to market conditions. Readers are cautioned not to place undue reliance on these forward-looking statements. Andaz does not undertake any obligation to revise any such forward-looking statements to reflect events and circumstances after the date hereof. Andaz does not guarantee the repayment of capital, payment of income or portfolio performance. All investments involve risk including the loss of principal. |
Editor’s Note: The summary bullets for this article were chosen by Seeking Alpha editors.
Be the first to comment