

Anja W./iStock via Getty Images
We believe fallen angels may look attractive over the next year with the carry now offsetting a 1.43% rise in yield from rates or spreads.
Fallen angels underperformed broad high yield (HY) (by 0.37% in September, -4.39% vs. -4.02%) and were in line in Q3 (-0.68% for both strategies) but are still behind 2.72% on the YTD figure (-17.34% vs. -14.62%). In Q3, duration has continued to be the primary driver of returns, with a monthly return in the 95% percentile (since 2003) as rates declined. But that was not repeated in August and September as yields continued their climb upwards, with the 10-year U.S. Treasury yield almost reaching 4% by the end of the quarter.
As shown below, risk-free rates are now significantly higher than they were at the beginning of the year, and we believe there may now be opportunities to add exposure across fixed income asset classes, including high yield, which is back offering “high yields.”
US Treasury Yield Curve
US Treasury. Past performance is not a guarantee of future results.
Yields on Fallen Angel Bonds at Pre-Great Recession Levels
Fallen angels are offering a yield to worst of 7.95% and broad HY of 9.57%, which are levels that haven’t been sustained (outside of major selloff periods) since before the GFC. This increase in overall yield has been driven by the normalization of interest rates. Credit spreads have outperformed equities, reflecting generally strong credit fundamentals. However, rate volatility has driven spreads upwards, and broad high yield is back around 500 basis points, not far from the long-term average since 2003. Fallen angel credit spreads are still below the long-term average. That being said, changes in credit quality should be considered when comparing current levels to long-term averages. The fallen angel universe remains close to 90% BB rated (the highest rating category within high yield), compared to an average of 73% since 2003. The current average spread of fallen angels is just slightly below the long-term average once adjusting for current credit quality.
The chart below shows how the fallen angel index rating allocation has changed over time relative to the average spread.
ICE Data Services and VanEck as of 9/30/2022. Past performance is not a guarantee of future results.
Although the risk of wider spreads in this uncertain environment is a concern, adding exposure at much higher yield levels means that carry could now play a much greater role in driving returns going forward and also provide a significant cushion against wider overall yields that could result from wider spreads (which would likely coincide with lower interest rates, offsetting the price impact to some extent). For example, at the end of September, the carry earned from fallen angels could offset a rise in overall yield over the next 12 months of 1.43%, which could conceivably allow an investor to breakeven over the period if interest rates or spreads were to rise by that amount. As a comparison, the breakeven level at the beginning of the year was only 0.49%. In other words, expected returns for bonds are much higher today, and further increases in yields have a lower impact on forward returns at this point, given the higher levels of carry being earned.
Fallen Angel Bonds Price Hits New YTD-Low
Lastly, as we previously wrote, we cannot forget about the fallen angel price. On 6/30, the average price was $88.47, and by the end of last month, it was $86.14, a new YTD-low, with the average price, since December 2003, dropping to $95.74. Current average prices are approaching those seen during the 2016 energy downgrades price of $84.01 and Covid at $83.30. Again, it is key to recognize that the prior price declines were driven by new fallen angels entering the index at discounted prices, while this time, it is higher interest rates. In fact, this has been one of the lowest years on record for new fallen angel volume.
Fallen Angels Price
ICE Data Services and VanEck as of 9/30/2022. Past performance is not a guarantee of future results.
Fallen Angel Bonds Overall Stats
Fallen angels YTW is now 7.95%, a 2.3x increase since the beginning of the year, and although broad HY is now the highest it’s been since the end of 2009, it hasn’t increased by more than the fallen angels. Fallen angel duration keeps shortening, a trend since the beginning of the year, whereas broad HY shortened for the first time this past quarter, but it’s extended YTD. Spreads retreated a bit over this past quarter but widened over the last weeks as the Fed announced more rate hikes.
ICE Data Services and VanEck as of 9/30/2022. Past performance is not a guarantee of future results.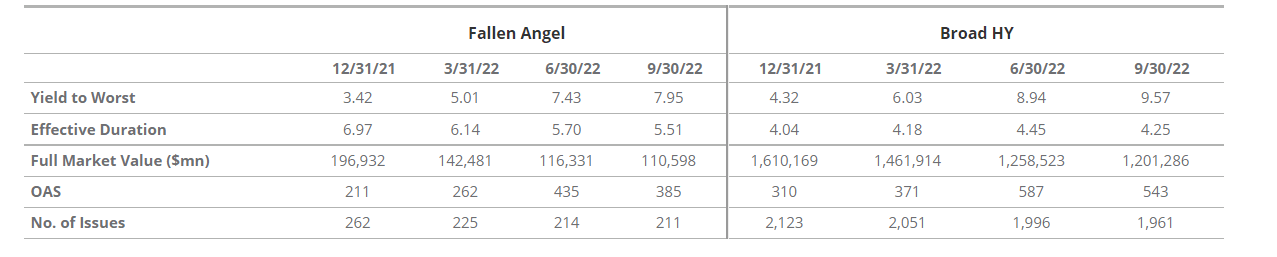
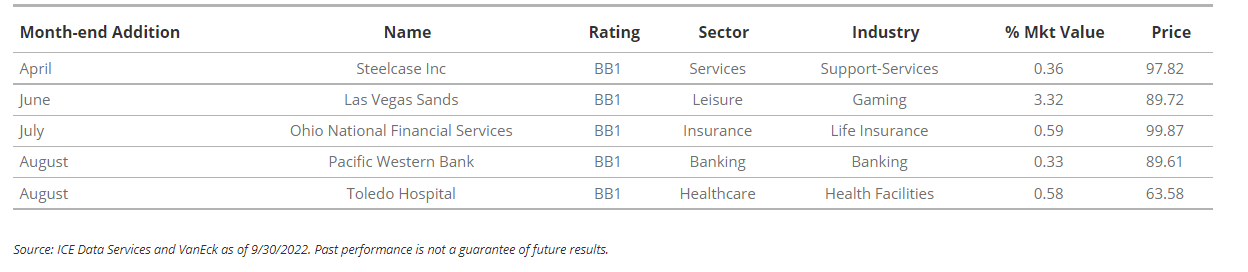
New Fallen Angel Bonds
A couple of new fallen angels entered the index over Q3. Ohio National Financial Services entered in July after Moody’s downgraded it, reflecting the company’s weakened market position and challenges supporting growth plans in its businesses. In August, two new fallen angels entered the index: Pacific Western Bank and Toledo Hospital. Fitch downgraded Pacific Western Bank, citing the company’s recent decline in capital reserves as some recent acquisitions have put pressure on their capital levels. S&P downgraded Toledo Hospital as there has been an acceleration in losses beyond expectations. Over the last 6 months, Ohio National Financial Services saw its price deteriorate by ~13%, Pacific by ~9%, while Toledo Hospital’s price deteriorated by ~40%. With these two new issues, the count of fallen angels this year is now 5, adding 5.18% weight this year. With the current economic environment, there may continue to be some fallen angels, mostly idiosyncratic in nature.
Rising Stars
Only one new rising star in Q3: DCP Midstream, removing 1.36% weight of the index. DCP was a fallen angel back in early 2015. It posted a price return of ~-16% over the last 12 months in the index, which despite being negative, was in line with broad HY price return over the same period. There have been 6 rising stars this year, removing 16.41% from the index.
ICE Data Services and VanEck as of 9/30/2022. Past performance is not a guarantee of future results. This is not a recommendation to buy or sell securities mentioned.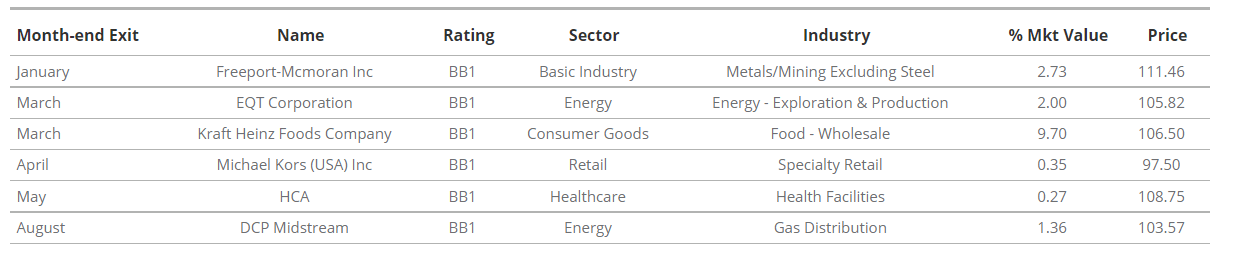
Fallen Angel Bonds Performance by Sector
Q3 didn’t bring any major changes in terms of sector allocations; the Energy saw a reduction of its 30% weight since DCP exited the index. There were 4 sectors in which spreads narrowed by more than 100bps: Basic Industry, Insurance, Leisure, and Real Estate, which make up about 14% on September month end, with Leisure being the top weight as Las Vegas Sand entered the index in June. All these four sectors posted positive returns, an average of +1.64% for the quarter. In terms of price, about 80% of the sectors are trading in the $80-90 bucket, ~12% in the $90s, and ~9% in the $70s.
ICE Data Services and VanEck as of 9/30/2022. Past performance is not a guarantee of future results.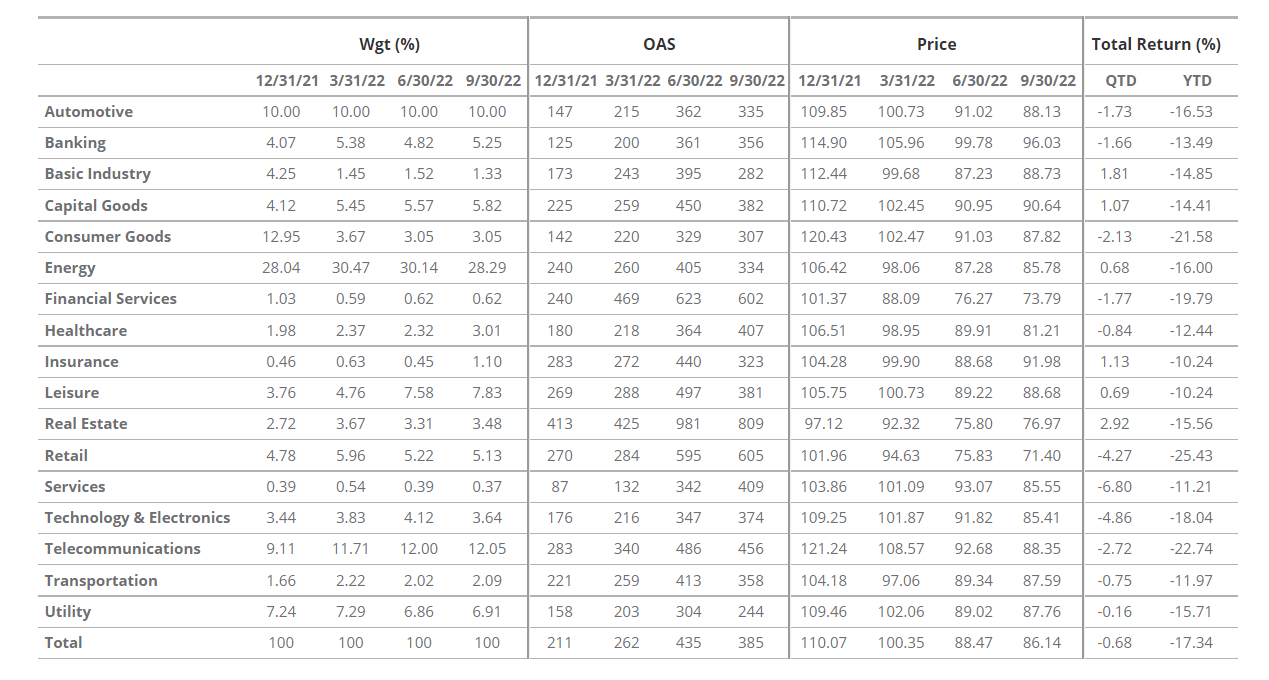
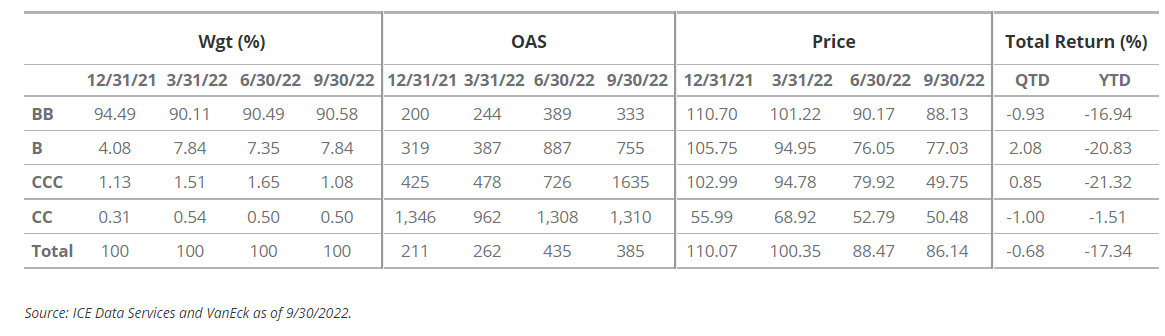
Fallen Angel Bonds Performance by Rating
Excluding the CC-bucket (which only includes one issuer), higher quality has outperformed, despite still posting negative returns, its lower-rated peers YTD – something expected as high quality tends to outperform in periods with higher volatility. Generally speaking, high-quality, high-yield firms may better adapt to the transition to a later stage of the business cycle. We believe the higher quality tilt of fallen angels may provide a strong cushion against more spread widening and volatility.
Disclosures
Please note that VanEck may offer investments products that invest in the asset class(ES) or industries included in this blog.
Data throughout sourced from ICE Data Services and VanEck.
Index returns are not Fund returns and do not reflect any management fees or brokerage expenses. Certain indices may take into account withholding taxes. Investors cannot invest directly in the Index.
A fallen angel bond is a bond that was initially given an investment-grade rating but has since been reduced to junk bond status.
High yield bonds may be subject to greater risk of loss of income and principal and are likely to be more sensitive to adverse economic changes than higher rated securities.
A rising star is a high yield bond that is upgraded to investment grade.
This is not an offer to buy or sell, or a recommendation to buy or sell any of the securities/financial instruments mentioned herein. The information presented does not involve the rendering of personalized investment, financial, legal, or tax advice. Certain statements contained herein may constitute projections, forecasts and other forward looking statements, which do not reflect actual results, are valid as of the date of this communication and subject to change without notice. Information provided by third party sources are believed to be reliable and have not been independently verified for accuracy or completeness and cannot be guaranteed. VanEck does not guarantee the accuracy of third party data. The information herein represents the opinion of the author(s), but not necessarily those of VanEck.
There are inherent risks with fixed income investing. These risks may include interest rate, call, credit, market, inflation, government policy, liquidity, or junk bond. When interest rates rise, bond prices fall. This risk is heightened with investments in longer duration fixed-income securities and during periods when prevailing interest rates are low or negative.
ICE BofA US High Yield Index (H0A0, “Broad HY Index”), formerly known as BofA Merrill Lynch US High Yield Index prior to 10/23/2017, is comprised of below-investment grade corporate bonds (based on an average of various rating agencies) denominated in U.S. dollars.
ICE US Fallen Angel High Yield 10% Constrained Index (H0CF, Index) is a subset of the ICE BofA US High Yield Index and includes securities that were rated investment grade at time of issuance.
Fallen Angel U.S. High Yield index data on and prior to February 28, 2020 reflects that of the ICE BofA US Fallen Angel High Yield Index (H0FA). From February 28, 2020 forward, the Fallen Angel U.S. High Yield index data reflects that of the Fund’s underlying index, the ICE US Fallen Angel High Yield 10% Constrained Index (H0CF). Fallen Angel U.S. High Yield index data history which includes periods prior to February 28, 2020 links H0FA and H0CF and is not intended for third party use.
ICE Data Indices, LLC and its affiliates (“ICE Data”) indices and related information, the name “ICE Data”, and related trademarks, are intellectual property licensed from ICE Data, and may not be copied, used, or distributed without ICE Data’s prior written approval. The licensee’s products have not been passed on as to their legality or suitability, and are not regulated, issued, endorsed, sold, guaranteed, or promoted by ICE Data. ICE Data MAKES NO WARRANTIES AND BEARS NO LIABILITY WITH RESPECT TO THE INDICES, ANY RELATED INFORMATION, ITS TRADEMARKS, OR THE PRODUCT(S) (INCLUDING WITHOUT LIMITATION, THEIR QUALITY, ACCURACY, SUITABILITY AND/OR COMPLETENESS).
All investing is subject to risk, including the possible loss of the money you invest. As with any investment strategy, there is no guarantee that investment objectives will be met and investors may lose money. Diversification does not ensure a profit or protect against a loss in a declining market. Past performance is no guarantee of future results.
© Van Eck Securities Corporation, Distributor, a wholly owned subsidiary of Van Eck Associates Corporation.
Editor’s Note: The summary bullets for this article were chosen by Seeking Alpha editors.
Be the first to comment