

metamorworks/iStock via Getty Images
Analog Devices (NASDAQ:ADI) is a diversified semiconductor company with end markets ranging from industrial, automotive, communications and consumer. Analog Devices has a diverse customer base with over 125k customers with none representing more than 5% of revenue.
With highly technical semiconductors Analog Devices is able to foster long-term partnerships with their customers as they aim to solve their own technical challenges. Those long-term partnerships help lead to very sticky revenue sources.
While you might expect that Analog Devices would have short product lifetimes, they actually have over 75K SKUs that have an average product life greater than 10 years.
ADI Investor Day (ADI Investor Day)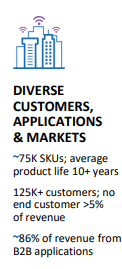
Analog Devices is poised to capitalize on the continued digitization of nearly everything. Analog Devices holds the number one position in analog, mixed signal, and RF and the number two position in power management.
Dividend History
The dividend growth strategy is the one that most appealed to me when I began my investment journey. While I prefer to target companies in the so-called “sweet spot” with 2.5% to 4.0% current yield and annual growth in the 6% to 10% range, I also realize that growth is a critical component to this strategy and try to balance out the portfolio with lower starting yields but faster growth opportunities.
Analog Devices Dividend History (ADI Investor Relations)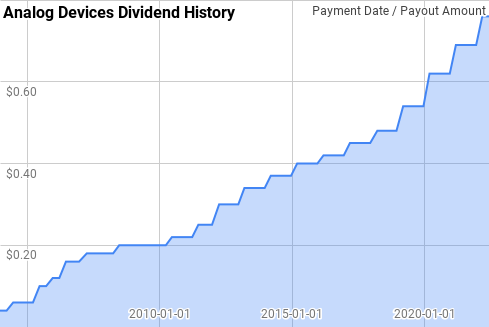
Analog Devices has paid and increased their annual dividend payment for 19 consecutive years giving them the title of Dividend Contender. Even during the financial crisis and the global pandemic they were still able to raise their payout.
Since 2004 Analog Devices has given year over year dividend growth ranging from 5.0% to 75.0% with an average of 17.4% and a median of 10.8%.
Over that same period there’s been 14 rolling 5-year periods with annualized dividend growth ranging from 7.4% to 32.0% with an average of 12.7% and a median of 10.9%.
During that timeframe there’s been 9 rolling 10-year periods with Analog Devices’ annualized dividend growth ranging from 9.5% to 21.9% with an average of 12.5% and a median of 11.1%.
The rolling 1-, 3-, 5- and 10-year annualized dividend growth rates from Analog Devices since 2004 can be found in the following table.
| FY | Annual Dividend | 1 Year | 3 Year | 5 Year | 10 Year |
| 2004 | $0.200 | ||||
| 2005 | $0.320 | 60.00% | |||
| 2006 | $0.560 | 75.00% | |||
| 2007 | $0.700 | 25.00% | 51.83% | ||
| 2008 | $0.760 | 8.57% | 33.42% | ||
| 2009 | $0.800 | 5.26% | 12.62% | 31.95% | |
| 2010 | $0.840 | 5.00% | 6.27% | 21.29% | |
| 2011 | $0.940 | 11.90% | 7.34% | 10.91% | |
| 2012 | $1.150 | 22.34% | 12.86% | 10.44% | |
| 2013 | $1.320 | 14.78% | 16.26% | 11.67% | |
| 2014 | $1.450 | 9.85% | 15.54% | 12.63% | 21.91% |
| 2015 | $1.570 | 8.28% | 10.93% | 13.32% | 17.24% |
| 2016 | $1.660 | 5.73% | 7.94% | 12.05% | 11.48% |
| 2017 | $1.770 | 6.63% | 6.87% | 9.01% | 9.72% |
| 2018 | $1.890 | 6.78% | 6.38% | 7.44% | 9.54% |
| 2019 | $2.100 | 11.11% | 8.15% | 7.69% | 10.13% |
| 2020 | $2.400 | 14.29% | 10.68% | 8.86% | 11.07% |
| 2021 | $2.690 | 12.08% | 12.49% | 10.14% | 11.09% |
| 2022 | $2.970 | 10.41% | 12.25% | 10.91% | 9.95% |
Source: Author; Data Source: Analog Devices Investor Relations
A quick gauge for the safety of a dividend is the dividend payout ratio. The payout ratio compares the dividends versus either profits or free cash flow and lets you know how well covered a dividend is.
ADI Dividend Payout Ratios (ADI SEC filings)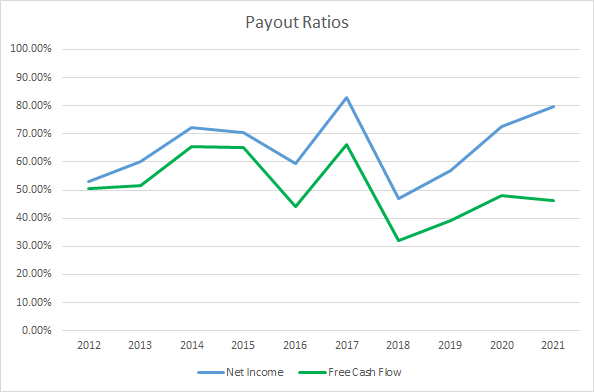
Analog Devices runs a higher payout ratio than I would have expected given the historical pace of dividend growth. The 10-year average net income payout ratio is 65% with the 5-year average at 68%. Meanwhile the average free cash flow payout ratios are 51% and 46%, respectively.
Quantitative Quality
Before investing, or as part of position maintenance, I like to see how the business has performed across several financial metrics. As an investor with a target of owning my stake in a company for years if not decades I try to not get bogged down in the quarterly fluctuations and instead focus on the bigger picture. The longer your time horizon the more important the success of the underlying business becomes in order to generate adequate investment results.
ADI Revenue Profits and Cash Flow (ADI SEC filings)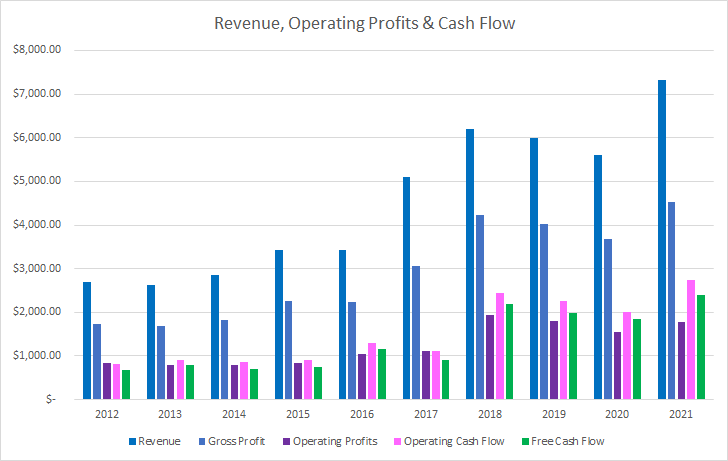
Through both organic growth and acquisitions Analog Devices has been able to grow its revenues 171% in total over the last decade or 11.7% annualized. During that same time gross profits increase 160% or 11.2% annualized with operating profits rising 114% or 8.8% annualized.
Operating cash flow far outpaced revenue growth climbing 236% in total or 14.4% annualized. Free cash flow fared the best out of those metrics increasing 251% over that time or 15.0% annualized.
Quality businesses with a defensible moat should be able to show stable and more likely rising margins over time. I generally look for free cash flow margins greater than 10% as a sign that the business does a good job at turning revenues into free cash flow.
ADI Margins and CCR (ADI SEC Filings)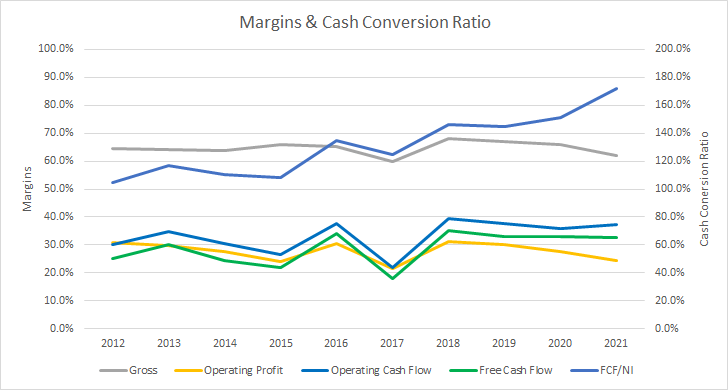
Analog Devices’ gross margins have been quite stable when looking at longer period of time. Over the last ten and five years Analog Devices has averaged a 64.6% gross margin.
Analog Devices’ free cash flow margin has been rising over that time which is a very positive sign. The 10-year average free cash flow margin is 28.7% with the 5-year average at 30.3%.
Similarly, I want to see how efficient the business is at turning assets or invested capital into free cash flow by examining the free cash flow returns. My preference is to see FCF ROICs greater than 10% and the higher the better and I want to see stable or rising FCF ROICs over time.
ADI Free Cash Flow Returns (ADI SEC filings)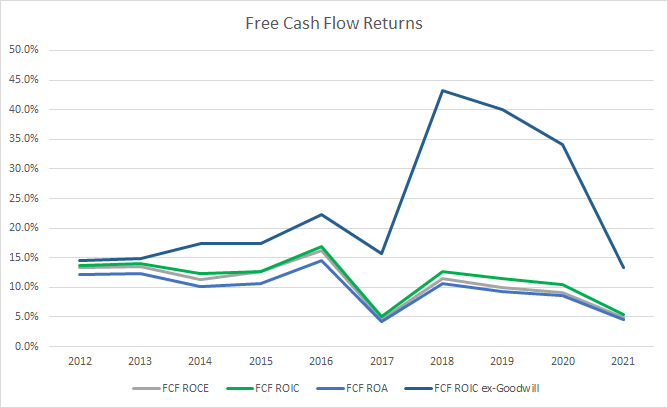
Analog Devices hasn’t shown the most stable FCF ROIC over time, part of which is due to M&A during that time. The 10-year average FCF ROIC for Analog Devices is 11.4% with the 5-year average at 9.0%. Looking at a FCF ROIC ex-goodwill to try and see what the business itself is earning excluding M&A the averages are 23.3% and 29.3%, respectively.
To understand how Analog Devices uses its free cash flow I calculate three variations of the metric, defined below:
- Free Cash Flow, FCF: Operating cash flow less capital expenditures
- Free Cash Flow after Dividend, FCFaD: FCF less total cash dividend payments
- Free Cash Flow after Dividend and Buybacks, FCFaDB: FCFaD less net cash used on share repurchases
ADI Free Cash Flows (ADI SEC filings)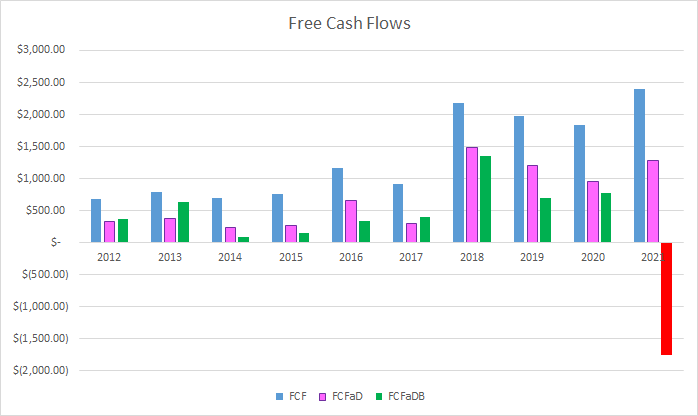
Over the last decade Analog Devices has generated a total of $13.4 B in FCF. With that FCF they have paid out a total of $6.3 B to shareholders in dividend payments which puts the cumulative FCFaD at $7.1 B. Analog Devices hasn’t typically used share repurchases; although they have spent $4.0 B net during the last decade. That puts the 10-year FCFaDB at $3.1 B.
Despite spending a net of $4.0 B on share repurchases during the last decade the share count has actually risen by 31% or roughly 3.1% increase annually. Much of that is due to the M&A during that time.
ADI Shares Outstanding (ADI SEC filings)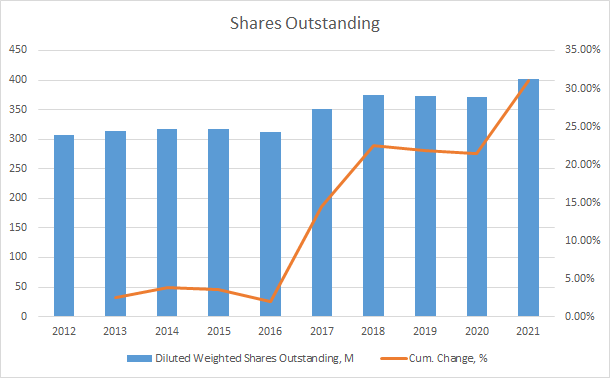
As an investor in the equity of a business I want to make sure that debt does not appear to jeopardize my investment. While I would prefer no debt on the balance sheet, I also understand that most companies will utilize debt in some capacity in their capital structure.
ADI Debt to Capitalization (ADI SEC filings)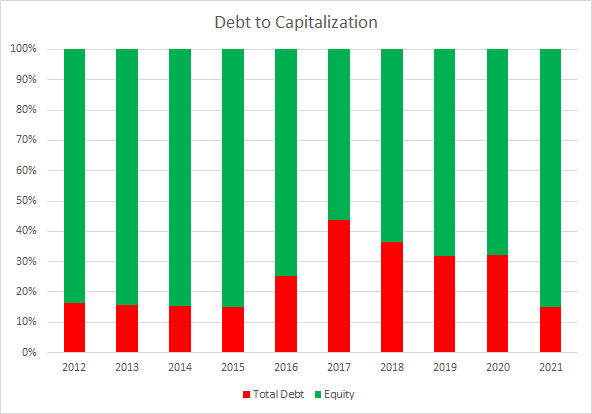
Analog Devices increased debt in their capital structure primarily due to the Linear Technology acquisition in 2017. Since then the debt weighting has been on the decline. The 10-year average debt-to-capitalization ratio is 25% with the 5-year average at 32%.
While the capital structure is something I pay attention to, I place more emphasis on the net debt ratios which examine the net debt levels versus a profit or cash flow metric. The debt ratios give you two pieces of information: (1) how quickly the company could de-lever assuming operations aren’t severely impacted, and (2) how much claim on the annual profits or cash flow there is.
ADI Debt Ratios (ADI SEC filings)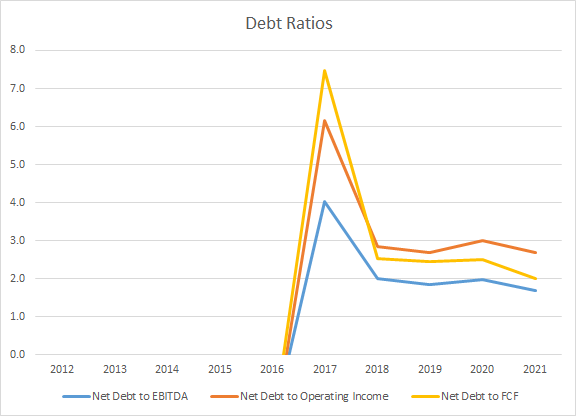
Prior to the Linear Technology acquisition Analog Devices carried a net cash position. Since then they maintained fairly stable levels. The 5-year average net debt-to-EBITDA, net debt-to-operating income, and net debt-to-FCF ratios are 2.3x, 3.5x, and 3.4x, respectively.
Valuation
I employ 3 primary valuation methods in order to determine price levels at which I deem an investment to be an attractive candidate to purchase. The valuation methods that I use are the minimum acceptable rate of return, MARR analysis, dividend yield theory, and a reverse discounted cash flow analysis.
A MARR analysis entails estimating the future earnings and dividends that a business will be able to generate over a given period of time. You then apply a reasonable expected terminal multiple at some future point and then calculate what the expected return would be. If the expected return is greater than your minimum acceptable return, then you can feel free to invest in the business.
Analysts expect Analog Devices to have FY 2022 EPS of $9.28 and FY 2023 EPS of $10.06. They also expect Analog Devices to be able to grow EPS at a 11.1% rate over the next 5 years. I then assumed that Analog Devices would be able to grow at a 5.0% annual rate for the following 5 years. Dividends are assumed to target a 32.5% payout ratio.
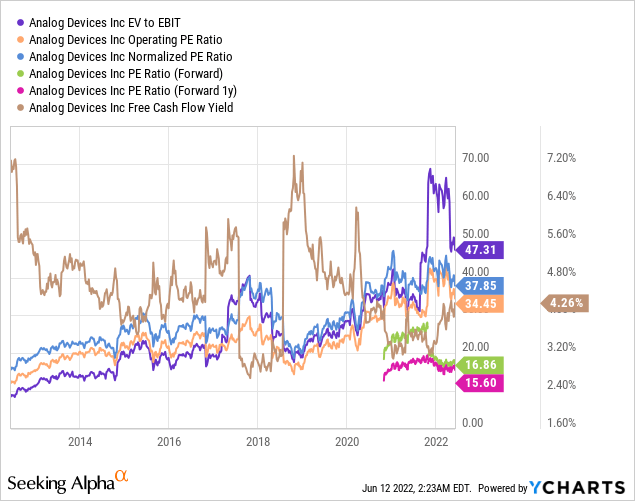
For the expected terminal multiple I like to examine a range of possibilities as the market can go through periods of overall high or low valuations. Historically, Analog Devices has traded between ~15x and ~30x TTM EPS and is currently trading around 16.9x FY 2022 estimates.
The following table shows the potential internal rates of return that an investment in Analog Devices could generate if the assumptions laid out above turn out to be reasonable estimates of how the future plays out. Returns assume shares are purchased at $161.61, Friday’s closing price. Dividends are assumed to be paid and increased along the time line that Analog Devices has historically followed and that dividends are paid in cash.
| IRR | ||
| P/E Level | 5 Year | 10 Year |
| 30 | 26.2% | 15.6% |
| 25 | 21.4% | 13.6% |
| 22.5 | 18.7% | 12.5% |
| 20 | 15.8% | 11.2% |
| 17.5 | 12.6% | 9.8% |
| 15 | 9.0% | 8.2% |
Source: Author
Additionally, I use the MARR analysis framework to work backwards to find the price I could pay for shares today in order to generate the returns that I desire from my investments. My base hurdle rate is a 10% IRR and for Analog Devices I’ll examine 12% and 8% returns.
| Purchase Price Targets | ||||||
| 10% Return Target | 12% Return Target | 8% Return Target | ||||
| P/E Level | 5 Year | 10 Year | 5 Year | 10 Year | 5 Year | 10 Year |
| 30 | $294 | $250 | $272 | $213 | $318 | $294 |
| 25 | $247 | $213 | $229 | $182 | $267 | $250 |
| 22.5 | $224 | $194 | $208 | $166 | $242 | $228 |
| 20 | $201 | $176 | $186 | $151 | $217 | $206 |
| 17.5 | $177 | $157 | $164 | $135 | $191 | $184 |
| 15 | $154 | $139 | $143 | $120 | $166 | $162 |
Source: Author
Dividend yield theory is a valuation methodology focused on reversion to the mean. It operates under the assumption that investors, collectively, will value a business based on the dividends that it pays out over time and around a normal dividend yield level. For Analog Devices I’ll use the 3-year average forward dividend yield as a proxy for the fair value.
Analog Devices Dividend Yield Theory (ADI Investor Relations and Yahoo Finance)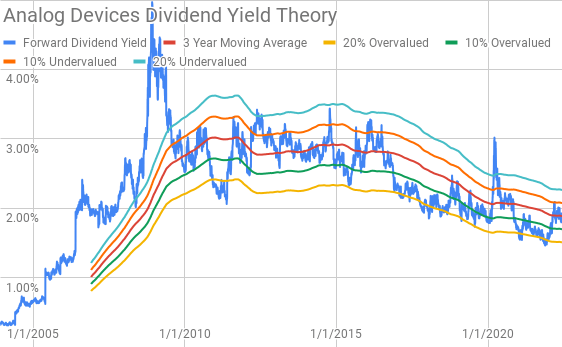
Analog Devices currently offers a forward dividend yield of 1.94% compared to the 3-year average forward dividend yield of 1.89%.
A reverse discounted cash flow analysis can be used to decode what kind of expectations are built into the current market valuation. In other words you can find out what kind of growth and margins you need to believe the business can maintain in order to generate the cash flows that will support the current market valuation.
I use a simplified DCF model built on revenue growth, an initial free cash flow margin of 32.0% that improves to 35.0% during the forecast period. Based on that margin profile Analog Devices needs to grow revenues at a 4.1% rate between FY 2022 and FY 2031 in order to generate the necessary free cash flows to support a 10% return. Reducing the required return to 8% lowers the revenue growth to just 2.2% during the forecast period.
Conclusion
Analog Devices has proven itself over the last decade. It’s pretty amazing that despite a 30% increase in the share count over the last decade the revenue per share still rose 8.4% annualized with operating income per share climbing 5.6% and free cash flow increasing 11.5%. Granted that’s come with sizable M&A activity although impressive nonetheless.
Even more impressive is that growth has come with improving free cash flow margins. Unfortunately, the free cash flow returns have been trending down over the last decade, but once again the M&A activity has played a role in that.
Dividend yield theory suggests a fair value range for Analog Devices between $147 and $179. Meanwhile the MARR analysis puts the fair value between $154 and $201 when looking for 10% IRRs over the next 5 years and assuming an exit multiple between 15x and 20x.
The reverse DCF also suggests that 10% returns are readily achievable from the current levels with just 4.1% required revenue growth. In my opinion that’s a pretty low hurdle for Analog Devices to be able to hit.
Especially considering that during Analog Devices’ Investor Day from April, management is expecting revenue growth in the 7-10% range with free cash flow margins between 34-40%. Using the mid point of that guidance puts the fair value around $199 with a 10% discount rate before accounting for share repurchases which could see annual share count reduction >2%.
Stock Return Forecast (Author)
If we follow the above estimate for the return a stock will generate there’s a lot to like about Analog Devices. The starting dividend yield sits at 1.94% with share repurchases potentially in the 2.0%+ area. Earnings growth of 8% to 11% pushes the return estimate prior to multiple change to around 12.0% to 15.0%.
At the current FY 2022 EPS the P/E multiple is just 16.9x which suggests that multiple expansion could very well be a boost to the return. If the multiple rises to 20x over 10 years that adds 1.9% to the annual returns and even a contraction to 12.5x is just a 3.3% drag on annual returns.
Analog Devices is aligned with many secular growth trends. Moving forward I would expect share repurchases to start being a meaningful boost to shareholder returns since management has targeted 100% return of free cash flow combined through both dividends and buybacks.
In my opinion Analog Devices is quite attractive at current levels with a high likelihood of impressive returns. I intend to add to my position in Analog Devices over the coming week should the share price remain at current levels or drift lower.
Be the first to comment