

gabort71/iStock via Getty Images
To say that the first half of 2022 has been difficult for investors is an understatement. Mortgage rates have nearly-doubled; the yield on the 10-year Treasury has risen 150% in less than 6 months; the SPX 500 has fallen -22%, the Nasdaq Composite -33%, and in certain high-growth tech sectors, stocks have fallen -75% to -90%.
Bitcoin and its brethren have fallen -75% since their November 2021 highs, and there seems no bottom in sight for the cryptos (yet). Sentiment has gotten so poor with cryptocurrencies that one well-known TV analyst even shared a view on Monday, June 13th, that cryptos were being considered a “con” in some circles.
But where there is carnage, there is opportunity. Such washout extremes and parabolic-pricing will soon revert to the mean, and now is the time to put a toe in the water.
Nasdaq 100
The Nasdaq 100 – one of the market’s chief growth engines – has been locked in a vicious downdraft for almost 6 months. Because of the inverse relationship between rising interest rates (the cost of money) and long-duration tech stocks, tech stocks with high multiples have taken it on the chin.
But the Nasdaq 100 is reaching an inflection-point, one rarely seen in the last 5 years: 92% of its components are below their 200 day moving averages.
There have been 2 previous times when this happened: the week of the Pandemic low (March 23, 2020), and the end of the interest-rate-tightening cycle, in December 2018.
Both times were followed by a significant rally in the subsequent quarter. See chart below:
Barchart.com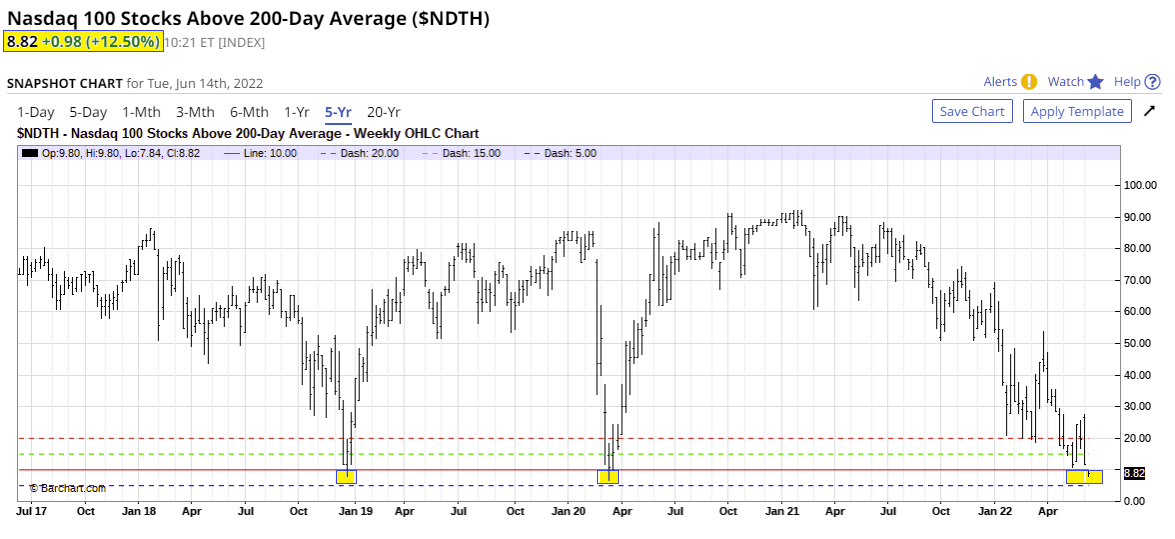
Only the Great Financial Crisis in 2008-09 created a longer period of weakness for the Nasdaq 100, lasting several months (below, left of chart):
Barchart.com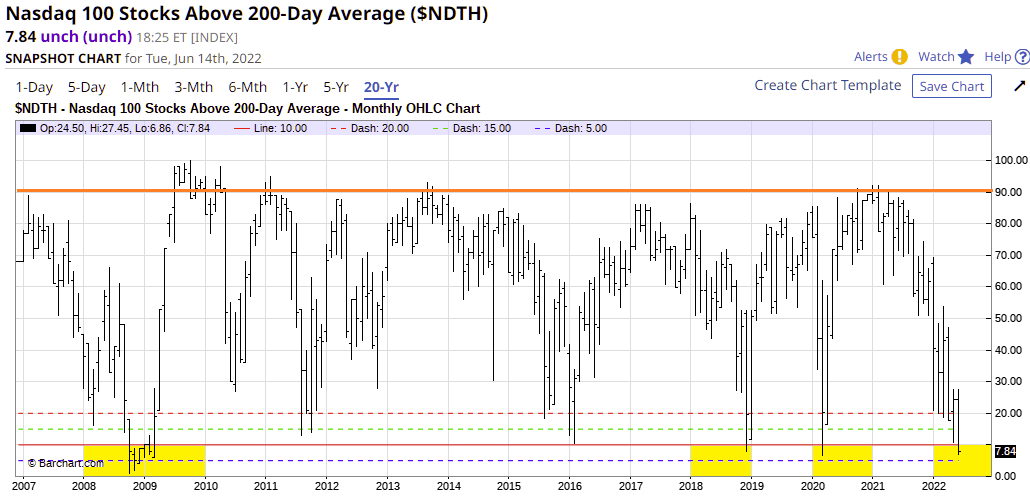
The time to entertain uber-bearishness on this index is not now, when over 90% of its components are in the tank. Judging from the charts, there is a high-probability that mean-reversion will appear in the upcoming quarter, lifting the Nasdaq 100 from its lows.
The way to play a recovery in the Nasdaq Composite is through a Nasdaq 100 ETF, buying at levels of leverage you are comfortable with: (QQQ) 1x, (QLD) 2x, or (TQQQ) 3x.
SPX 500
The same can be said of the SPX 500. On Thursday, June 16, 2022, only 2.25% of its 500 companies were above their 50-day moving average. This is a rare event for the SPX 500, a -2 standard deviation (STD) from the mean.
Standard deviations define data within certain boundaries, or distributions, from the mean. For example, in the illustration below, I have boxed-off in red 2 Standard Deviations as part of a distribution of data. These red boxes lay outside of 95.4% of all the other data, and so are an “outlier” (13.6% + 34.1% + 34.1% + 13.6% = 95.4%).
With stocks and ETFs, such readings are significant because the condition will rarely persist for more than 5-7 days before reverting towards the mean. Oversold markets generate investor demand (because stocks are cheap) and overbought stocks can start a flurry of selling (to lock in profits).
It’s like a yo-yo or oscillator. To be successful, a trader must be bullish when it is time to be bullish, and bearish when it is time to be bearish.
Markets are a two-way street. They are not long-only.
Standard deviations give clues that a change in trend may be imminent. We are at such a juncture now.
M.W. Toews: Wikipedia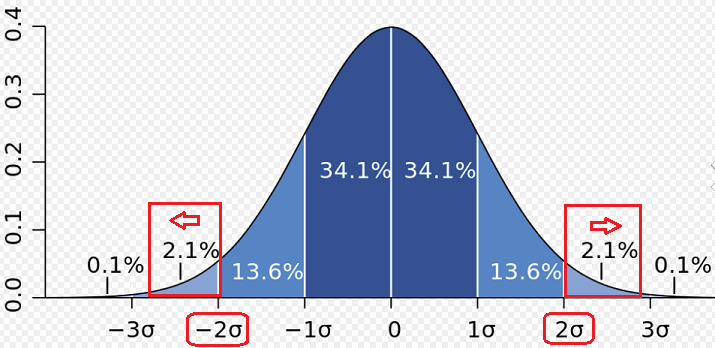
Barchart.com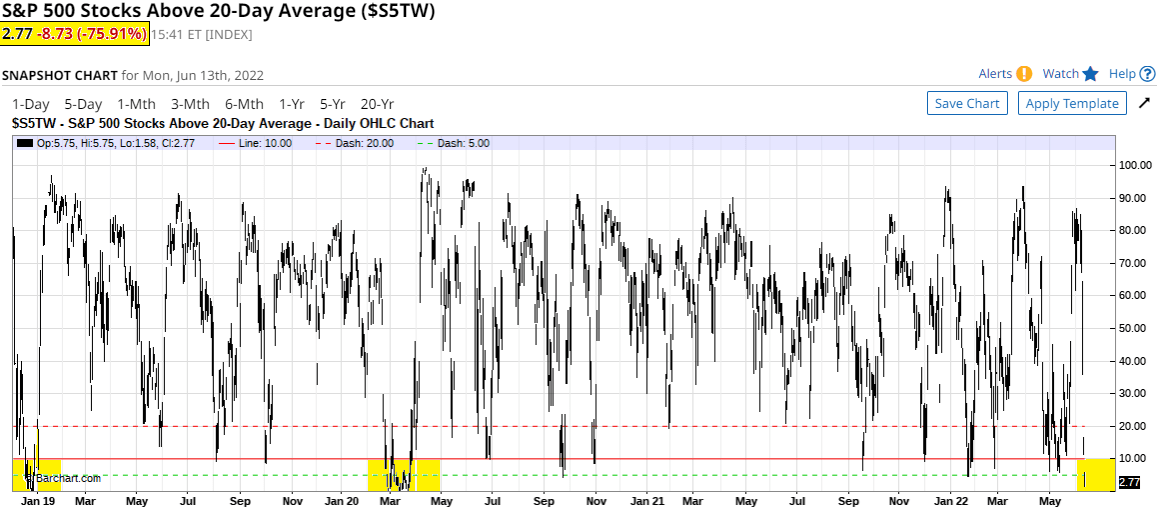
A way to play a recovery is through buying a SPX 500 ETF, at levels of leverage you are comfortable with: (SPY) 1x, (SSO) 2x, or (SPXL) 3x.
NYSE Composite
There are over 2,000 stocks on the NY stock exchange. Almost 83% of these companies are at least -2 Standard Deviations below their 10, 20, 50, 150, and 200-day moving averages. This only happens when market sentiment is extremely-negative (like now), and often coincides with a washout in stock prices.
Marketcharts.com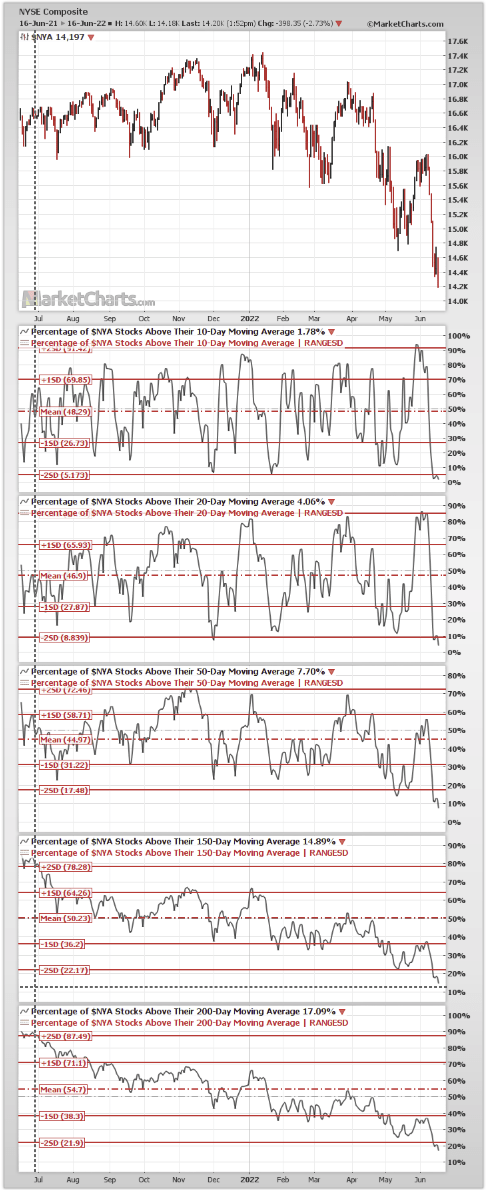
Interest Rates
The yield on the 10-year Treasury is approaching an inflection-point at which the cost of credit is becoming prohibitive. Both business and consumers could soon draw back from the precipice, deciding to borrow and spend less.
The recent rise in interest rates has been virtually parabolic since January 1, 2022. Interest rates pass through to consumer borrowing and to all adjustable-rate loan products such as home equity loans and credit cards. Now that the projected 50-75 bps hike has been announced (June 15, 2022), it will have a powerful effect on consumer behavior and should help cool inflation. It could also put a floor under bond prices and create a trend-change in the bond market (more on that below).
Stockcharts.com Barchart.com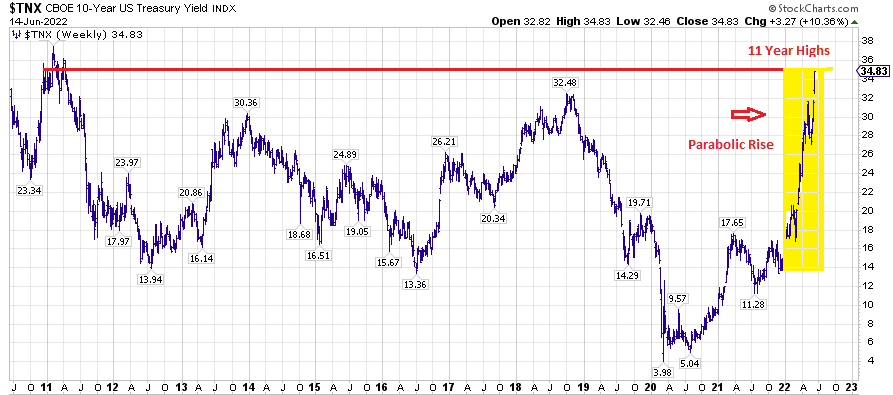
To see just how dramatic the recent rise in interest-rates has become, consider the cost of a new monthly-mortgage payment on a median single-family dwelling in the United States ($375,000).
In real terms (the monthly payment), the cost of this home has risen 41% since January 3, 2022. Sales in the real estate market have gone from red hot to ice cold in a matter of weeks. The unsustainable rise in mortgage costs has flattened the real estate market and taken buyers out of the market.
| 2022 Monthly Mortgage Payment | ||||
| Date | Rate | Monthly Amount ($) | Monthly Increase ($) |
6 mo Totals |
| January 3 | 3.29% | 1640.27 | N/A | 0.00% |
| March 3 | 3.96% | 1781.67 | 141.40 | +8.6% |
| April 4 | 4.84% | 1967.50 | 185.83 | +20% |
| May 5 | 5.5% | 2129.21 | 161.71 | +30% |
| June 14 | 6.28% | 2316.26 | 187.05 | +41% |
Mortgage News Daily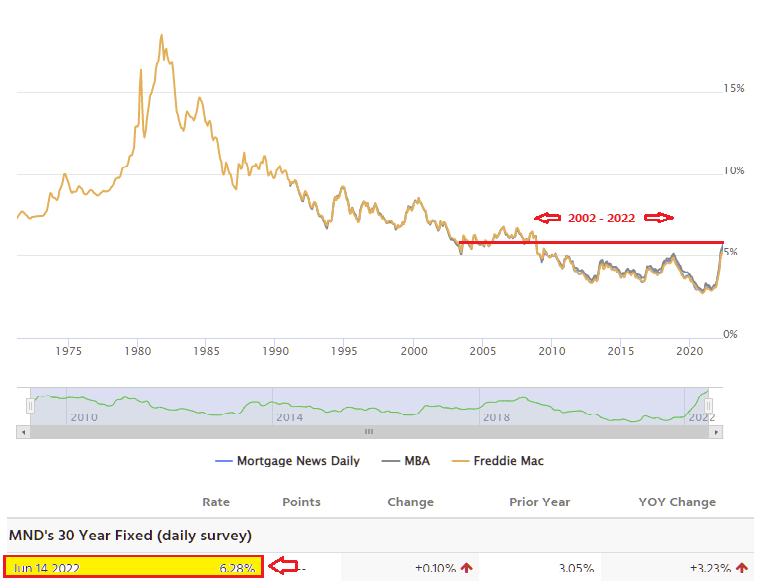
It is not surprising that the Michigan US consumer sentiment survey is at the lowest point in its 60+ year survey.
TradingEconomics.com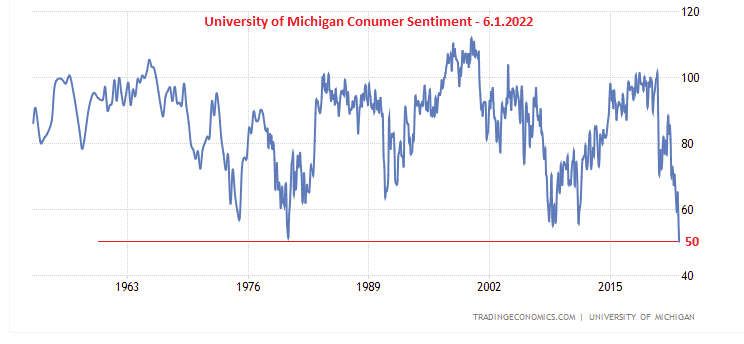
Or that the American Association of Individual Investors (AAII) recorded a 32-year low in bullishness of 15.8% on April 13, 2022. Only in the years 1990 and 1993 were there lower, single readings (see chart below).
Stockcharts.com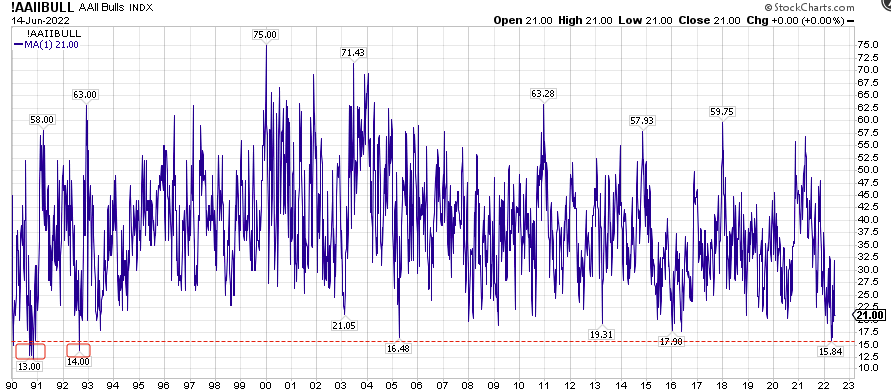
Market Trading Background
Machine-trading dominates our equity market. Large traders hedge risks through artificial intelligence [AI] and computer-driven trading-programs. It is estimated that about 60-75% of overall trading volume in the U.S. stock market is generated through algorithmic trading.
Algorithmic trading has grown significantly in popularity since the early 1980s and is used by institutional investors and large trading firms.
An algorithm is a set of directions for solving a problem. Computer algorithms send small portions of the full order to the market over time to be filled.
Algorithmic trading utilizes automated and pre-programmed trading instructions to account for variables such as price, timing and volume.
(Algorithmic Trading, by James Chen, Investopedia, January 31, 2022) .
The individual investor often doesn’t realize he is competing with machines for prices, but it is very important to understand what is going on in the markets around you.
It has been my experience that this machine-assisted trading generates huge volumes in order to achieve better results ($) but over shorter time horizons. “Long-term” investing has now become attenuated by machines which buy and sell willy-nilly within clearly-defined support and resistance levels.
As an investor, you fight this reality at your peril, and can be severely disappointed when algos sell en masse into inevitable pullbacks. Your ‘Long-term’ profits are quickly lost in the volatility, over and over again. Who has the patience to stick around for an ultimate reward, years hence, while enduring dramatic volatility day in and day out? Or are you willing to change your viewpoint?
During the 2020-2021 bull market, I had the unenviable experience of 10 consecutive 40+% moves in travel-related stocks, only to see those profits vanish at resistance levels.
My experience prompted me to develop a system for trading within sentiment levels governed by moving averages, and it has served me well ever since.
I look for extremes (like the current market) for a change in trend, before beginning a trade.
The selection criteria for stock and ETFs remain the same:
- Stocks and ETFs with solid forward guidance (fundamentals)
- Well-defined support and resistance levels on their stock charts,
- At a time when the overall market is at an oversold inflection point.
Below are a few examples from the travel/hospitality sector:
Park Hotels (PK)
Stockcharts.com
Park Hotels has fallen into the $15-$16 level nine (9) previous times over the last 18 months, and each time it has rallied back up into the $19.00-$20.50 range (approximately +20%-25%). This time around would be number 10, and with the stock at a new 52-week low.
On the positive side, management recently (June 6, 2022) raised revenue and EBITDA guidance for the second quarter, asserting that the business is progressing well and occupancy levels are increasing. They are buying back shares, raising cash by selling non-core properties, and currently estimate their NAV at $30/share, which means the share price is 50% of net asset value.
On October 15, 2021, I wrote an SA article on Park Hotels exploring the background and the fundamentals of the company. Despite the recent market-wide selloff, the company story hasn’t changed. The fundamentals of the hospitality industry continue to improve.
To wit, in a CNBC interview on June 6, 2022, Christopher Nassetta, CEO of Hilton Worldwide Holdings (HLT) indicated that Summer 2022 could be the biggest summer in the company’s 103-year history. A month earlier, on May 4, 2022, Tony Capuano, CEO of Marriott International (MAR), said much the same, calling the environment for leisure travel “gangbusters“.
SABRE (SABR)
Stockcharts.com
I wrote an SA article on Sabre on December 31, 2020, making it my top travel pick for 2021. Investor enthusiasm for Sabre soon waned after a monster 3-month rally (+50%). In March, 2020, Sabre began a collapse (along with much of the travel industry) that has lasted over two long years.
Recently, on June 14, 2022, Sabre hit a low of $5.70. It is now as cheap as its been throughout the pandemic recovery. However, I think the worst is behind the company, and the bad news priced-in to the shares.
Since the peak in March 2021, Sabre shares have oscillated between $5.70 and $11.50. As recently as May 2022, the share price was just under $11.00.
Between Sabre and Amadeus (OTCPK:AMADY), these two companies control 80% of the world’s travel bookings through clients such as online travel agencies [OTAs], hotel chains, and airline and rail companies. Sabre’s woes are not unique to it. The charts of both Sabre and Amadeus are practically identical (see comparison below).
Barchart.com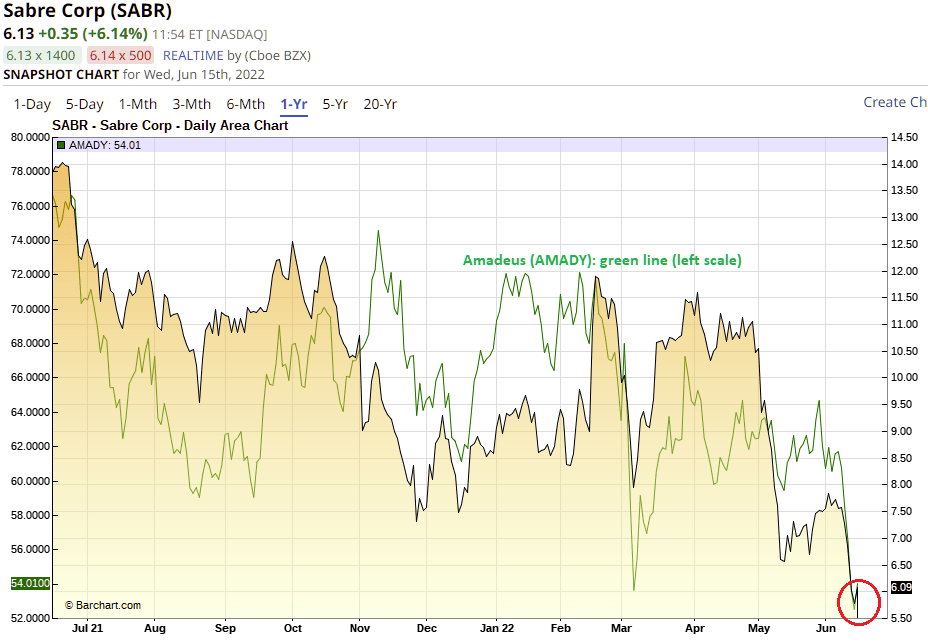
On May 3, 2022, Sabre’s earnings call presented a positive outlook for the year. The company also beat on revenues and EPS estimates. But investors panned the shares, and the stock fell 46% in 6 weeks.
A part of what is unrecognized with Sabre is just how much of their free cash flow is being spent to convert their software to the cloud, a very expensive and multi-year effort. When that conversion is complete, more of those revenues will flow directly to the bottom line and the company will become free cash flow positive.
I rate it a strong buy anywhere under $7.
Direxion Daily Travel And Vacation Bull ETF 2x (OOTO)
Stockcharts.com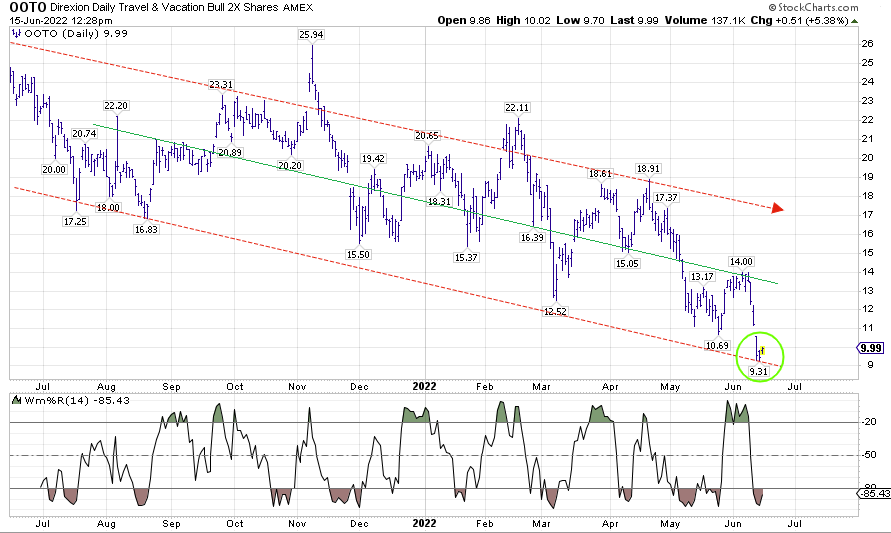
This new ETF (June 2021) is composed of blue chips in the travel sector: such as Airbnb (ABNB), Hilton, Marriott, Booking (BKNG), Expedia (EXPE), Delta Airlines (DAL), Carnival (CCL), Choice Hotels (CCH), Sabre, Park Hotels, etc.
A recovery in the travel and hospitality sector will first be felt in this ETF. If this ETF merely returns to where it was 5 days ago, that would be a 30% return. It is a strong buy anywhere in the $9-12 range.
Bond Market
We are fast approaching the point where the Fed’s dual efforts of monetary tightening (interest rate hikes) and balance sheet reduction are going to bear fruit. Today’s announcement of a 75 bps hike is the largest in 28 years. The Fed is also prioritizing what it reduces off its balance sheet, with mortgage backed securities being first in line, solidly reducing demand for mortgages.
SA Authors Avi Gilburt and Patrick Doyle recently penned articles articulating the case for a bond market rally. I agree. If the Fed is successful in taming inflation, the first place we will see that is in the bond market. See their articles:
- Sentiment Speaks: Big Bond Rally Is Coming Despite The Fed, by Avi Gilburt, June 2, 2022
- The Bond Market Is Heading Higher, by Patrick Doyle, June 2, 2022
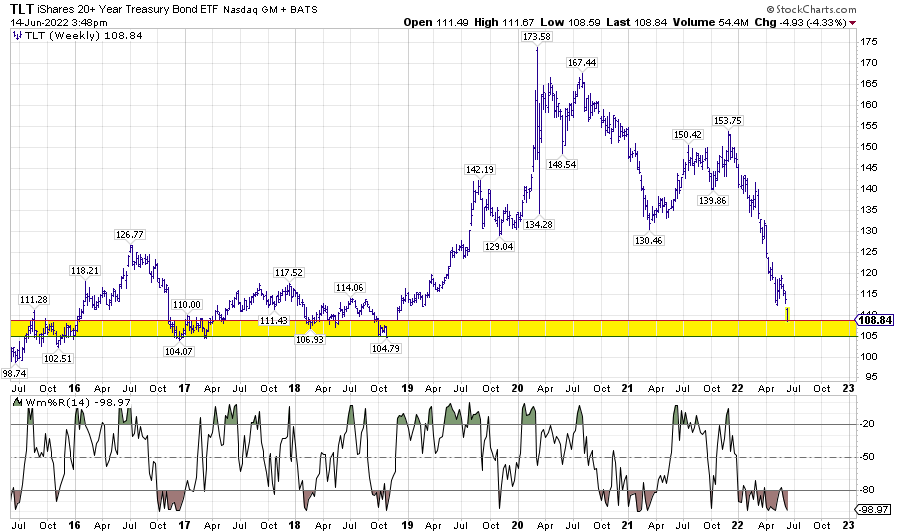
The way to play a mean-reversion in interest rates is by scaled-in purchases of the (TLT), or its leveraged cousin, (TMF). Any price point under 112 is a strong buy on TLT and under $13 for TMF.
Conclusions
There have been 6 months of relentless hammering-away at the 3 arms of wealth creation in the United States: the bond market, the stock market, and real estate.
The market is at an inflection point. You can see it in the sentiment charts.
If you believe that the Fed’s mission is to ensure stability in prices and employment, and by association, continuation of the wealth effect of owning assets, then a cooling-off of the economy is coming, not its destruction. This could create a rally in the bond market.
It’s time to get out a shopping list of companies.
Why travel and hospitality stocks on the list?
It’s often the case that companies hit hardest at the epicenter of a recession become stronger after they survive. Recall the eventual recovery of the tech sector after the dotcom bust, or the home builders and banks after the Great Financial Crisis, to see what could eventually evolve for the hospitality sector, and thus my list of names here.
Be the first to comment