

pcess609
By Catalina Zota
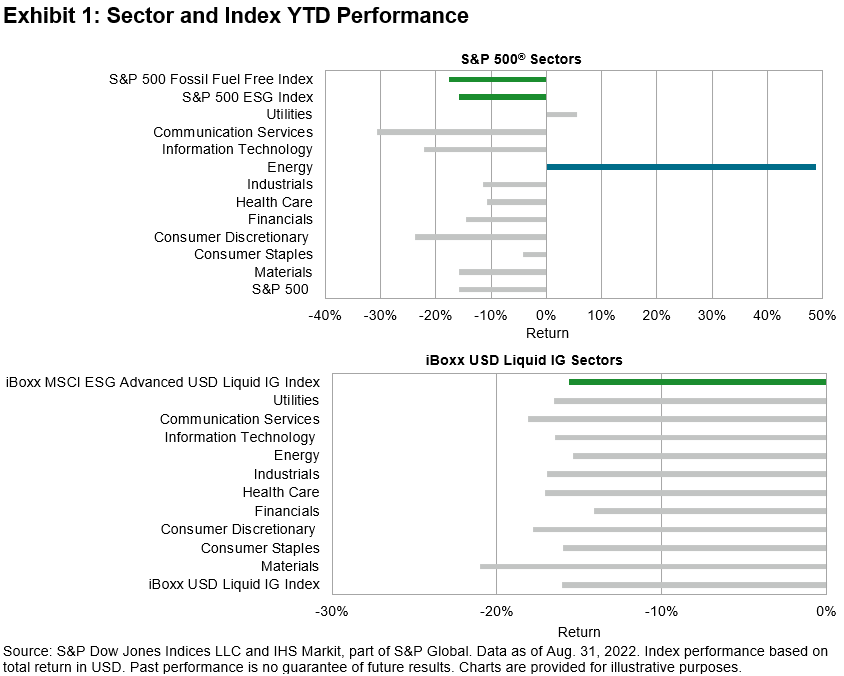
Year-to-date, global stock and bond market returns have been mired in red. The picture has been consistent across the various bond and equity sectors, except for Energy and Utilities stocks, posting YTD returns of 48.8% and 5.5%, respectively.
Before this Energy rally, the iBoxx MSCI ESG Advanced USD Liquid Investment Grade (IG) Index was launched to reflect the performance of U.S. dollar-denominated IG corporate debt issued by companies that have an above-average environmental, social, and governance (ESG) rating compared to peers.
The Oil & Gas sectors are excluded from the index, instead seeking exposure to companies that have a higher ESG rating (as measured by MSCI ESG research data). Companies involved in business controversies and UNGC global norms violations are not included.
The iBoxx MSCI ESG Advanced USD Liquid IG Index had a YTD return of -15.66% versus the benchmark’s YTD return of -16.06% (see Exhibit 2). Compared with the benchmark, there was 2.82% underweight in bonds with over 20 years to maturity (YTM), as well as 2.16% and 1.30% overweight in bonds with 1-5 and 5-10 YTM, respectively. As a result, the ESG index had lower duration and convexity compared with the benchmark.
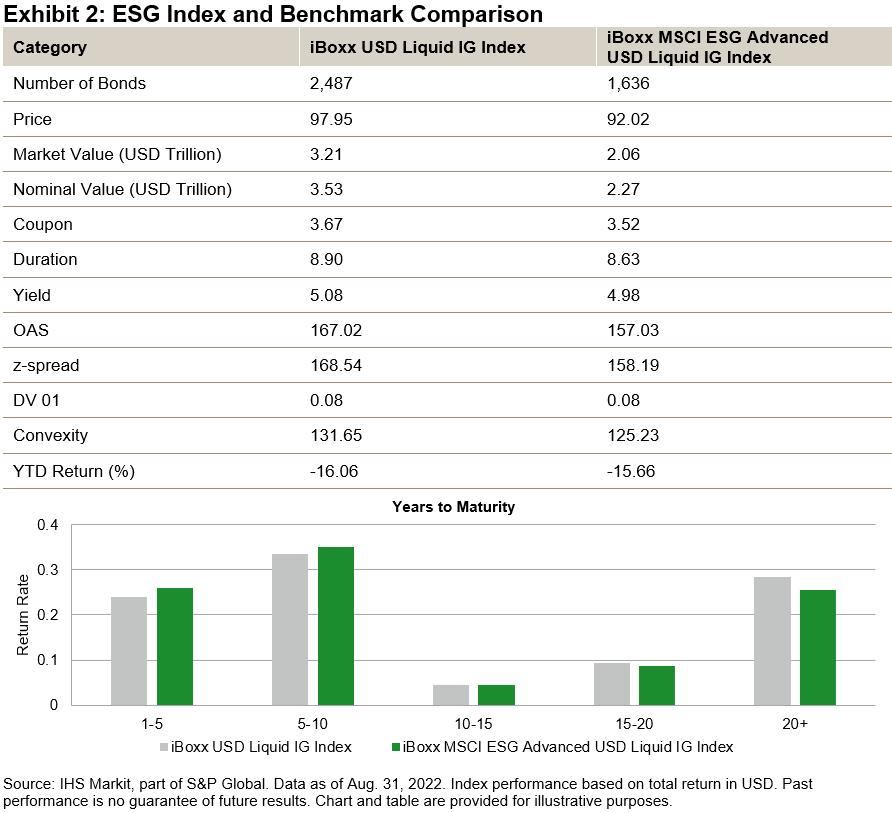
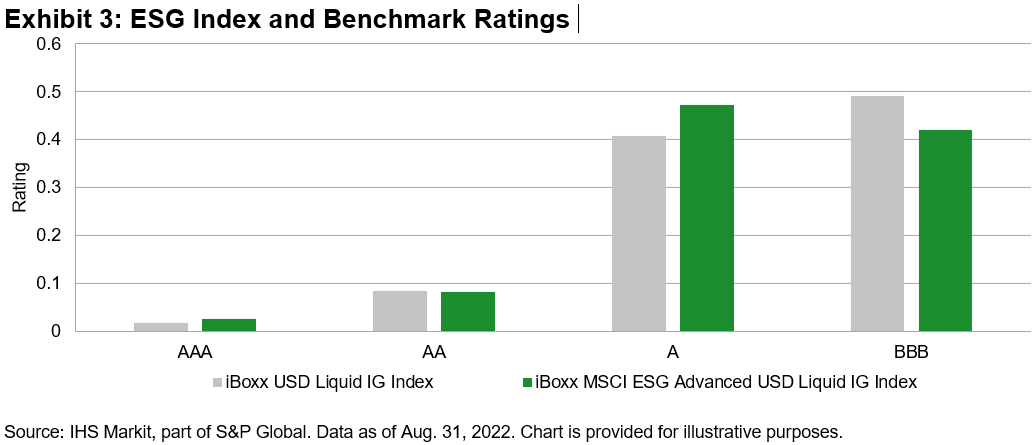
The ESG index underweighted lower-rated bonds (BBB) by 6.94%. The index composition has led to lower yield and coupon rate for the ESG index, at 4.98% and 3.52%, respectively.
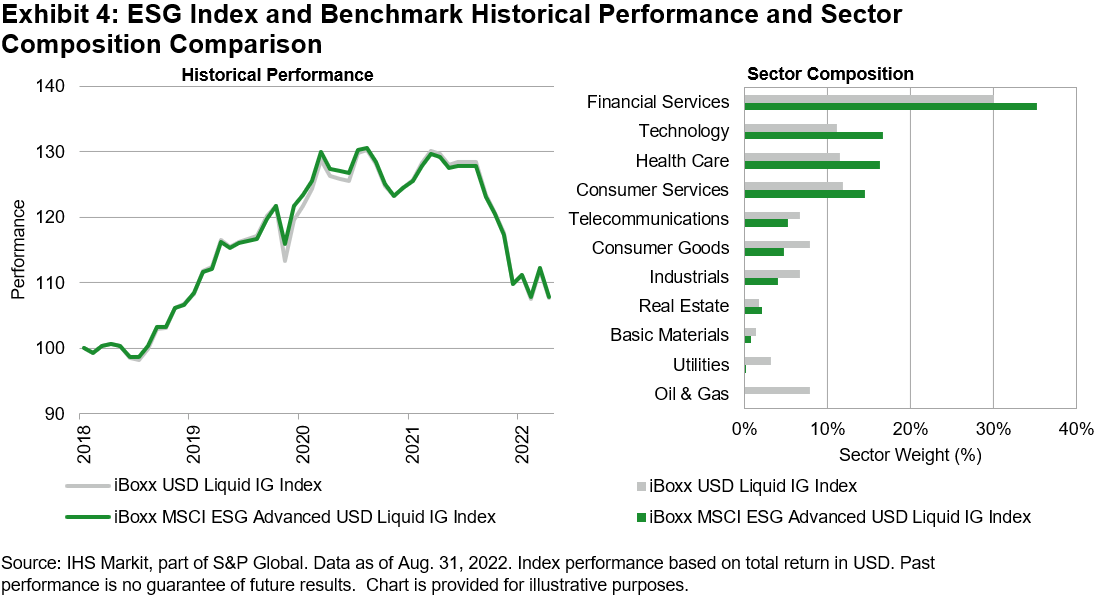
Exhibit 4 shows a comparison of index performance for the past five years (rebased to 100). The iBoxx MSCI ESG Advanced USD Liquid IG Index has performed comparable to the benchmark in terms of total return, despite missing the entire Energy sector, which accounted for 7.88% of the benchmark as of Aug. 31, 2022.
Thus, the similar performance can be attributed to index construction, namely the additional ESG business activity screens and higher rated, best-in-class companies measured by their ESG rating. On a YTD basis, the iBoxx MSCI ESG Advanced USD Liquid IG Index has provided a consistent risk/return profile compared with the benchmark.
ESG has tremendous opportunity for growth in the global bond market that reached USD 126.9 trillion in 2021.1 The U.S., the most liquid market in the world, was responsible for USD 49.7 trillion (38.7%) of global bond issuance.
The ESG bond market has grown from less than USD 1 trillion in 2017 to over USD 2.1 trillion in 2022.2 The ESG market is estimated to reach USD 3.5 trillion by the end of 2025 based on the growth rate of the iBoxx MSCI ESG Advanced USD Liquid IG Index.3
This exponential growth is fueled by regulatory movement toward a greener and more sustainable economy in the U.S. and the EU. The Federal Reserve is considering the implementation of systemic climate risk (CRISK)4 bank stress tests in 2023, and the SEC has opened consultations for index providers to disclose data on ESG-labeled products.5
The EU Taxonomy requirements will push companies to further improve their ESG credentials and align their business activities with at least one of the six objectives for a more sustainable future (only two of the six EU objectives are mapping to company sectors at this time).
Many other regulations, such as SFDR Articles 8 and 9, will push index providers and asset managers to be even more selective of the companies included in the funds.
In the U.S., there are headwinds in the ESG market. States such as Florida and Texas banned ESG-labeled products from the state pension funds. A debate emerged along political lines, which trickled down into the financial industry regarding the performance and validity of ESG-labeled products.
This brief analysis of the iBoxx MSCI ESG Advanced Liquid IG Index shows that, despite market turbulence, well-constructed ESG products remain as competitive as the broad market.
1 Capital Markets Fact Book 2022, July 2022, SIFMA
2 ESG bond market measured by the iBoxx MSCI ESG Advanced USD Liquid IG Index.
3 ESG bond market is estimated based on the growth rate of the iBoxx MSCI ESG Advanced USD Liquid IG Index from Jan. 31, 2018, (historical back-tested data) to Aug. 31, 2025.
4 Jung, H., Engle, R., Berner, R., Climate Stress Testing, September 2021, Federal Reserve Bank of New York Staff Reports, no. 977
5 Securities and Exchange Commission, 17 CFR Parts 270 and 275.
Disclosure: Copyright © 2022 S&P Dow Jones Indices LLC, a division of S&P Global. All rights reserved. This material is reproduced with the prior written consent of S&P DJI. For more information on S&P DJI please visit www.spdji.com. For full terms of use and disclosures please visit Terms of Use.
Editor’s Note: The summary bullets for this article were chosen by Seeking Alpha editors
Be the first to comment